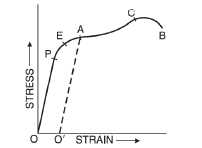
The stress-strain graph for a metal wire shown in the Fig. Upto the point E, the wire returns to its original state O along the curve EPO, when it is gradually unloaded. The point B corresponds to the fracture of the wire. Describe what happens, when the wire is loaded up to a stress corres-ponding to the point A on the graph and then unloaded gradually. In particular, explain the dotted curve.
 Solution in Punjabi
Step by step video & image solution for The stress-strain graph for a metal wire shown in the Fig. Upto the point E, the wire returns to its original state O along the curve EPO, when it is gradually unloaded. The point B corresponds to the fracture of the wire. Describe what happens, when the wire is loaded up to a stress corres-ponding to the point A on the graph and then unloaded gradually. In particular, explain the dotted curve. by Physics experts to help you in doubts & scoring excellent marks in Class 11 exams.
Updated on:21/07/2023Topper's Solved these Questions
Similar Questions
Discuss stress-strain graph.
View SolutionA bend in a level road has radius of 100 m.Find the maximum speed with which a car turning this bend may have without skidding ,if the coefficient of friction between the tyres and road is 0.8.
View SolutionDistinguish between streamline and turbulent flow of a liquid.
View SolutionOn gradual loading , stress - strain relationship for a metal wire is as follows . Within proportionality limit , stress ∝ strain or, Stressstrain = a constant for the material of wire.
Two wires of same material have length and radius (L,r) and (2L,r2). The ratio of their young's modulii is
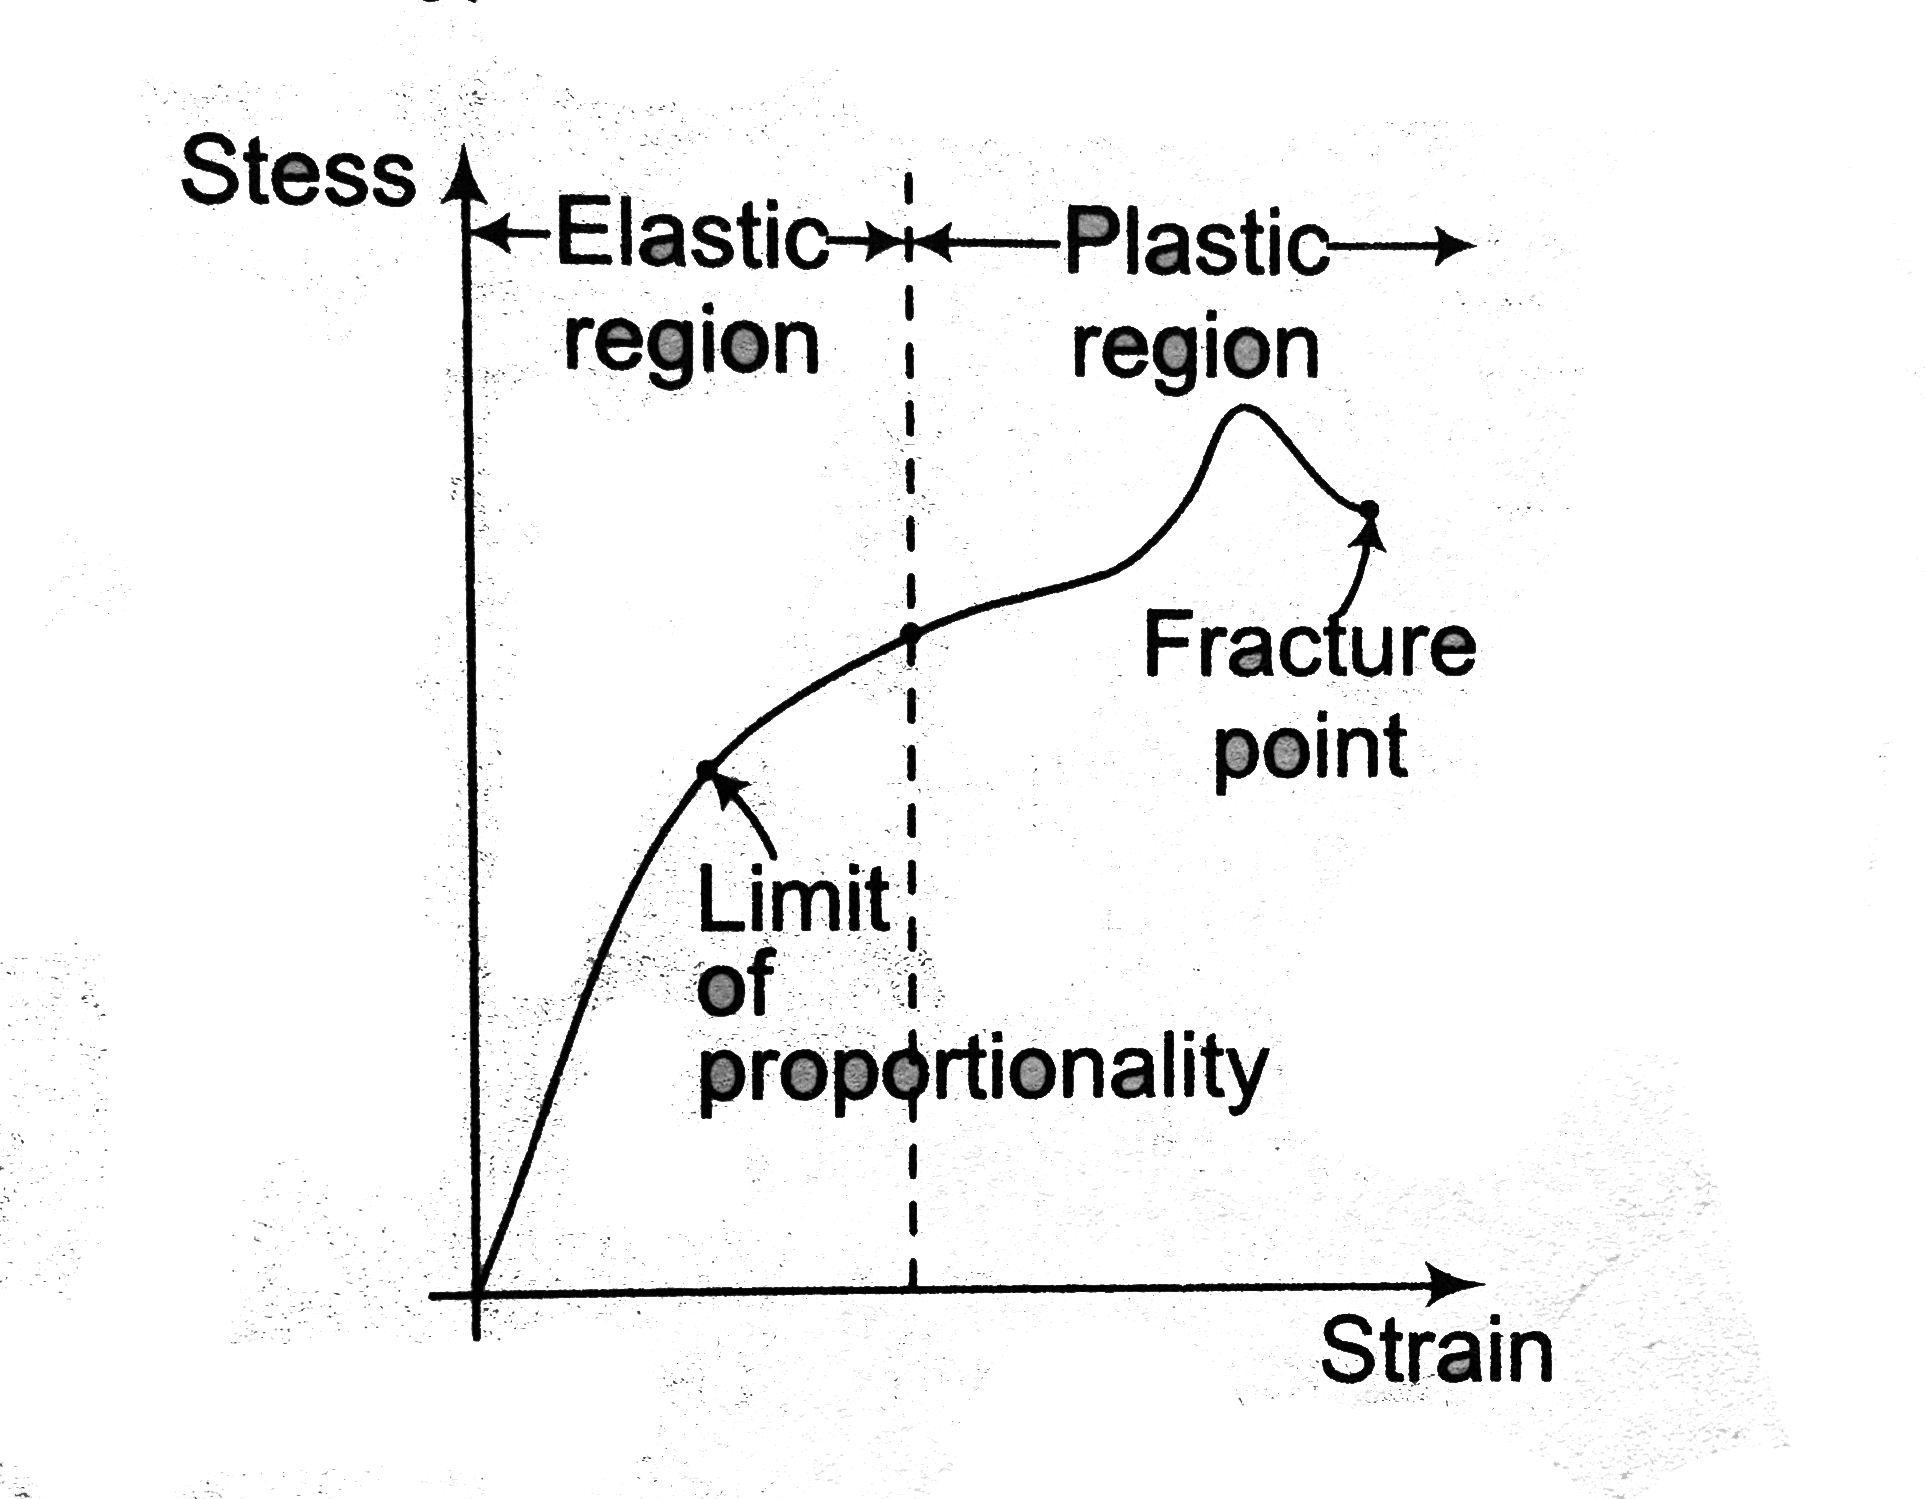
View SolutionOn gradual loading , stress - strain relationship for a metal wire is as follows . Within proportionality limit , stress prop strain or, Stressstrain = a constant for the material of wire.
Just on crossing the yield region, the material will have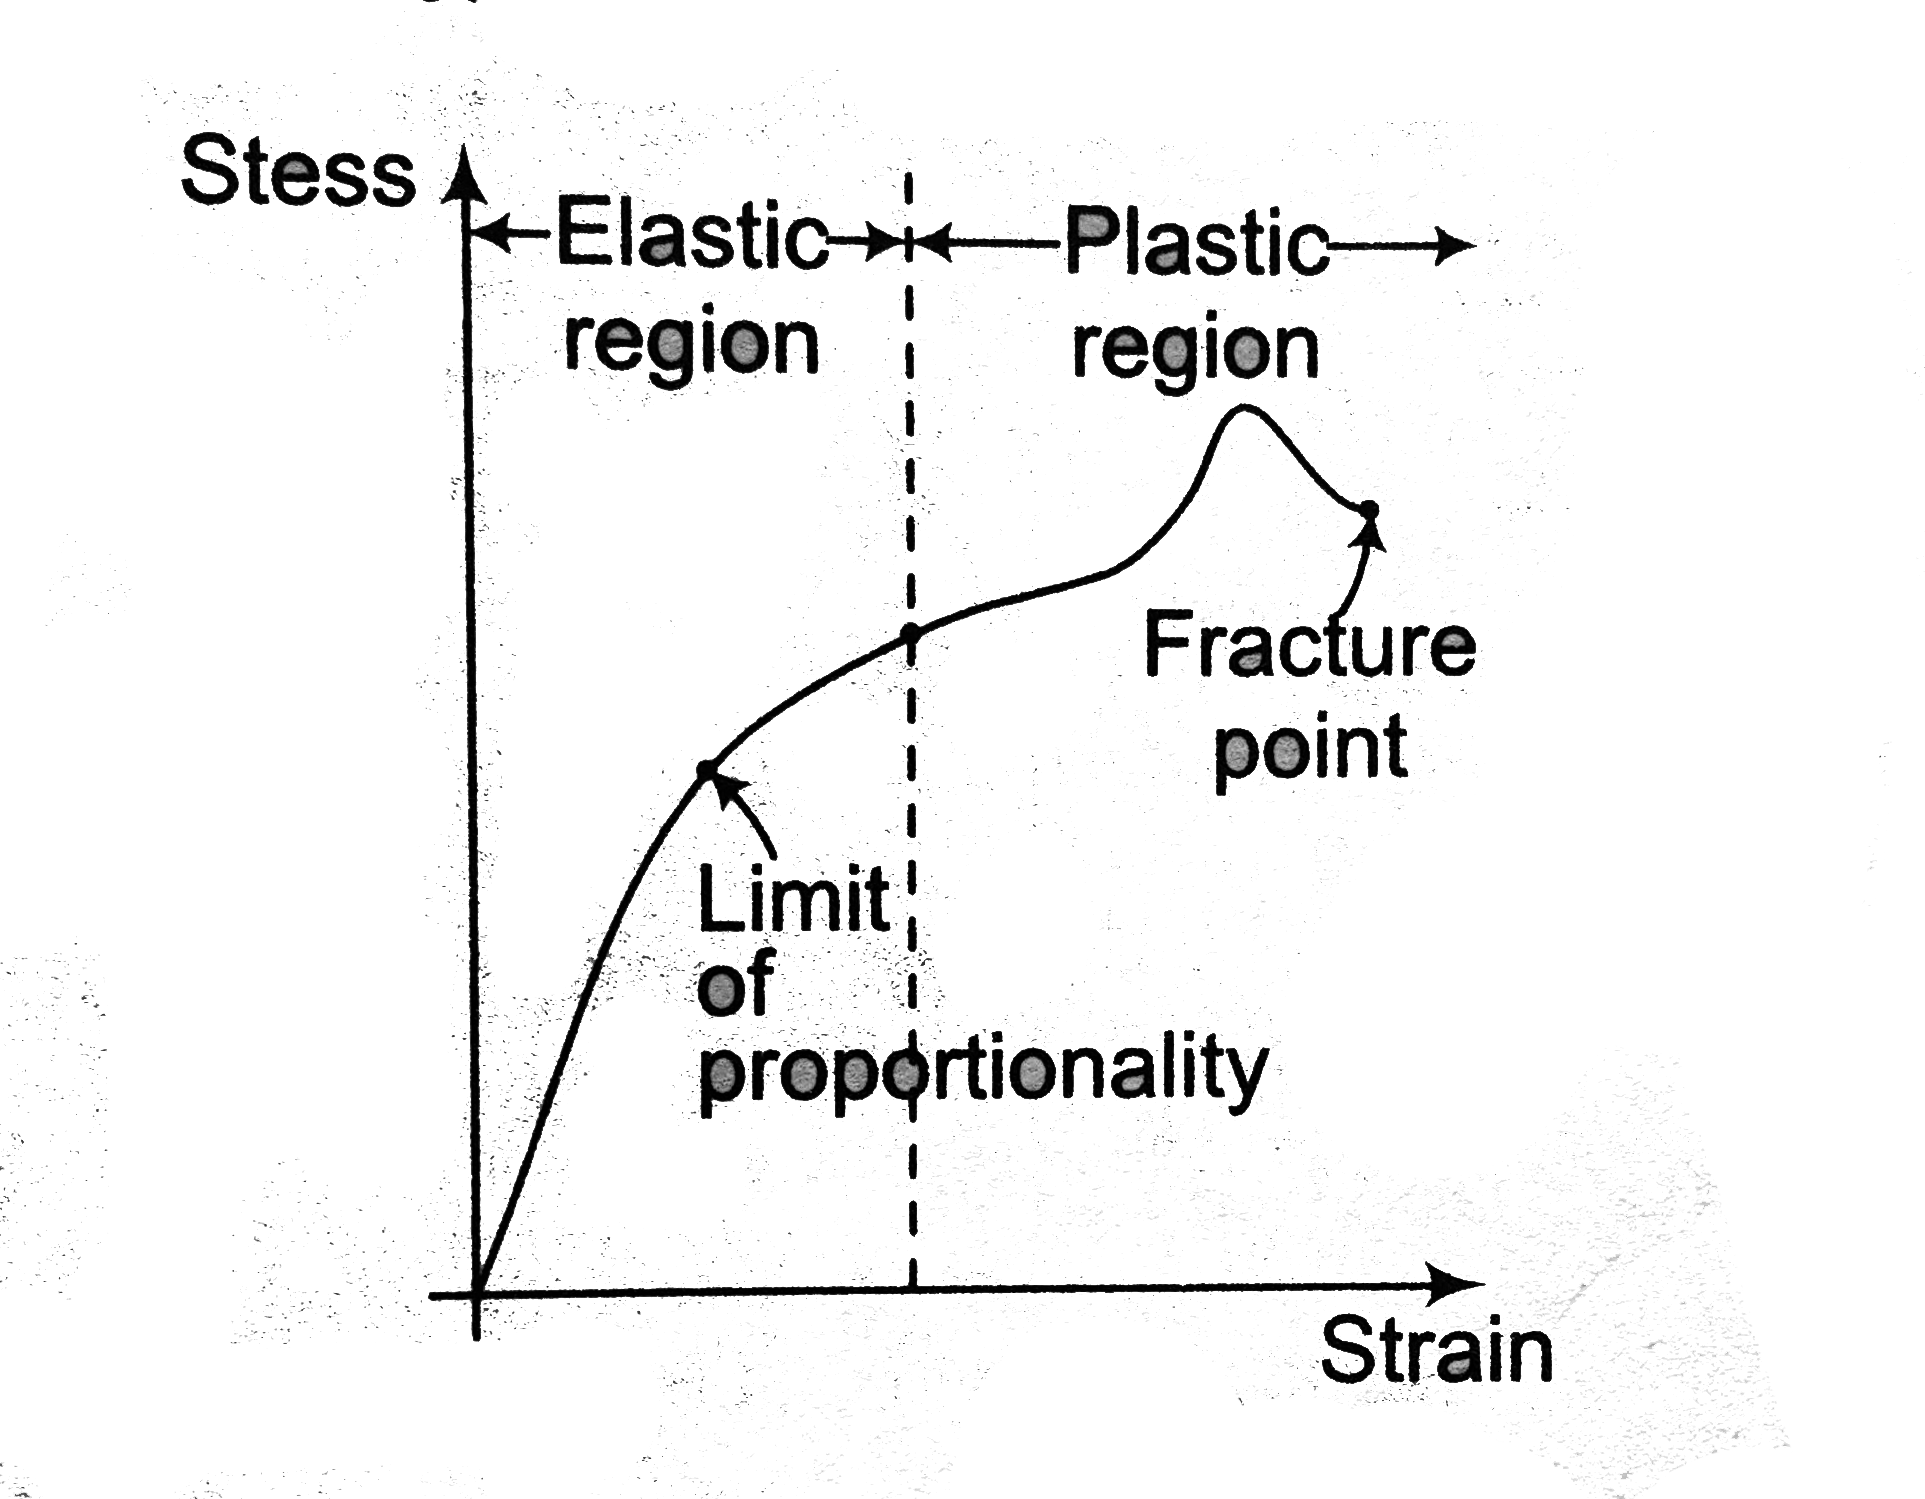
View Solution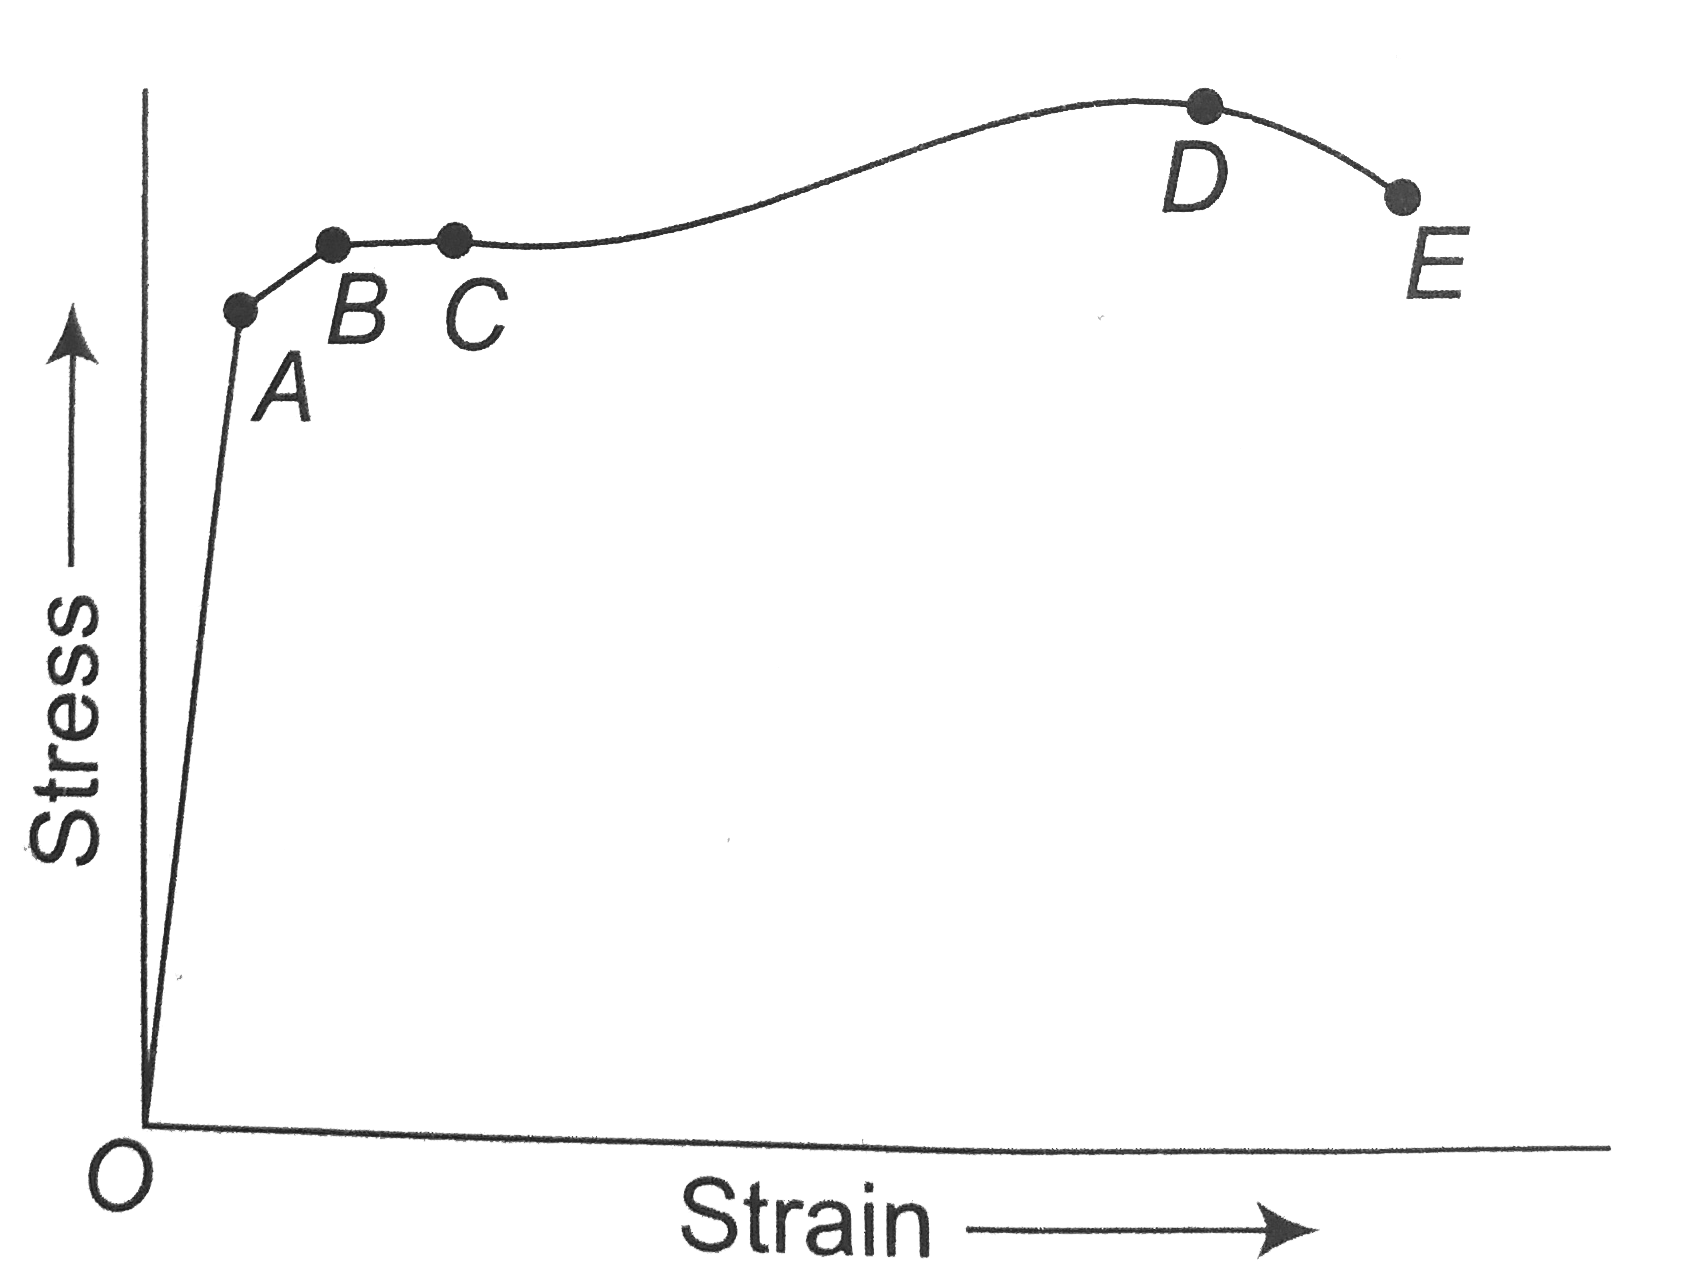
The stress strain graph for a metal wire is as shown in the figure. In the graph, the region in which Hooke's law is obeyed, the ultimate strength and fracture are represented by
View SolutionThe stress strain graph for a metal wire is shown in the fig. Upto the point E, the wire returns to its original state O along the curve EPO, when it is gradually unloaded. Point B corresponds to the fracture of the wire. (a) Upto what point on the curve is Hooke's law obeyed? (this point some times called proportional limits). (b) Which point on the curve corresponding to elastic limet or yield point of the wire? (c ) Indicate teh elastice and plastic regions of the stree-strain graph. (d) Describe what happens when the wire is loaded upto a stress corresponding to the point A on the graph and then unloaded gradulally. In particular explain the dotted curve. (e) Wht is peculiar about the protion of the stree- strain graph from C to B? Upto what stress can the wire be subjected with out causing fracture?
View SolutionAssertion Upto elastic limit of a stress-strain curve, the steel wire tends to regain its original shape when stress is removed. Reason Within elastic limit, the wire follows Hooke's law.
View Solutionकिसी तार के लिये प्रतिबल तथा विकृति के बीच ग्राफ खींचिये | एक ग्राफ से प्रत्यास्थ सीमा, पराभव बिन्दु तथा भंजक बिन्दु समझाइए |
View SolutionDescribe the behaviour of a wire under gradually increasing load.
View SolutionExplain what happens when the load on a metal wire suspended from a rigid support is gradually increased. Illustrate your answer with a suitable stress-strain graph.
View SolutionDefine the terms stress and strain and also state their SI units. Draw the stress versus strain graph for a metallic wire, when stretched upto the breaking point.
View SolutionThe strain stress curves of three wires of different material as shown in fig. A,B,C are the elastic limits of the wire. The figure show that
View SolutionThe stress strain graph for a metal wire is as shown in the figure. In the graph, the region in which Hooke's law is obeyed, the ultimate strength and fracture are represented by
View SolutionThe strain stress curves of three wires of different material as shown in fig. A,B,C are the elastic limits of the wire. The figure show that
View SolutionDraw the stress-strain graph of a loading wire. Mark the following points : i) Elastic limit ii) Fracture point iii) Plastic region iv) Elastic region
View Solution
