A baseball having a mass of 0.4kg is thrown such that the force acting on it varies with time as shown in the first graph. The corresponding velocity time graph is shown in the second graph. Determine the power applied as a function time and the work done till t=0.3s.

The graph of power delivered to baseball and time is a straight line.
The net force on baseball is constant.
For t>0.2 the graph of power delivered to the baseball and time is a parabola.
The net force on baseball is in direction of velocity.
The correct Answer is:D
Because accelerationof base ball is constant and positive so force is constant and in direction of velocity and P=→F.→V Graph straight line.
Topper's Solved these Questions
Similar Questions
A baseball having a mass of 0.4kg is thrown such that the force acting on it varies with time as shown in the first graph. The correspondeng velocity time gragh is shown in the second graph. Detemine the power applied as a functon time and the work done till t=0.3s.

View SolutionCurrent varies with time as shown in the graph
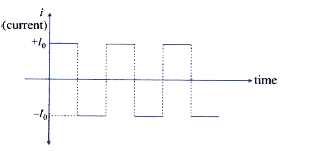
Current is
View Solution
Knowledge Check
Current varies with time as shown in the graph

The current isAAC with changing magnitudeBAC with constant magnitudeCDC with changing magnitudeDDC with constant magnitudeCurrent varies with time as shown in the graph

The current isAACBDCCchanging from DC to ACDcan't predictCurrent varies with time as shown in the graph
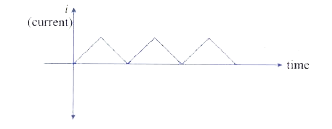
This current isADCBACCchanging from DC to ACDcan't predict
A baseball having a mass of 0.4kg is thrown such that the force acting on it varies with time as shown in the first graph. The corresponding velocity time graph is shown in the second graph. Determine the power applied as a function time and the work done till t=0.3s.

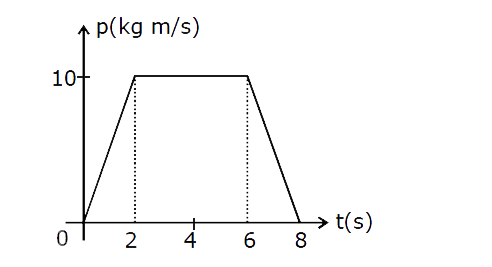
View SolutionThe momentum p of an object varies with time (t) as shown in figure. The corresponding force (F)- time (t) graph is -
View SolutionAcceleration-time graph of a body is shown. The corresponding velocity-time graph of the same body is.
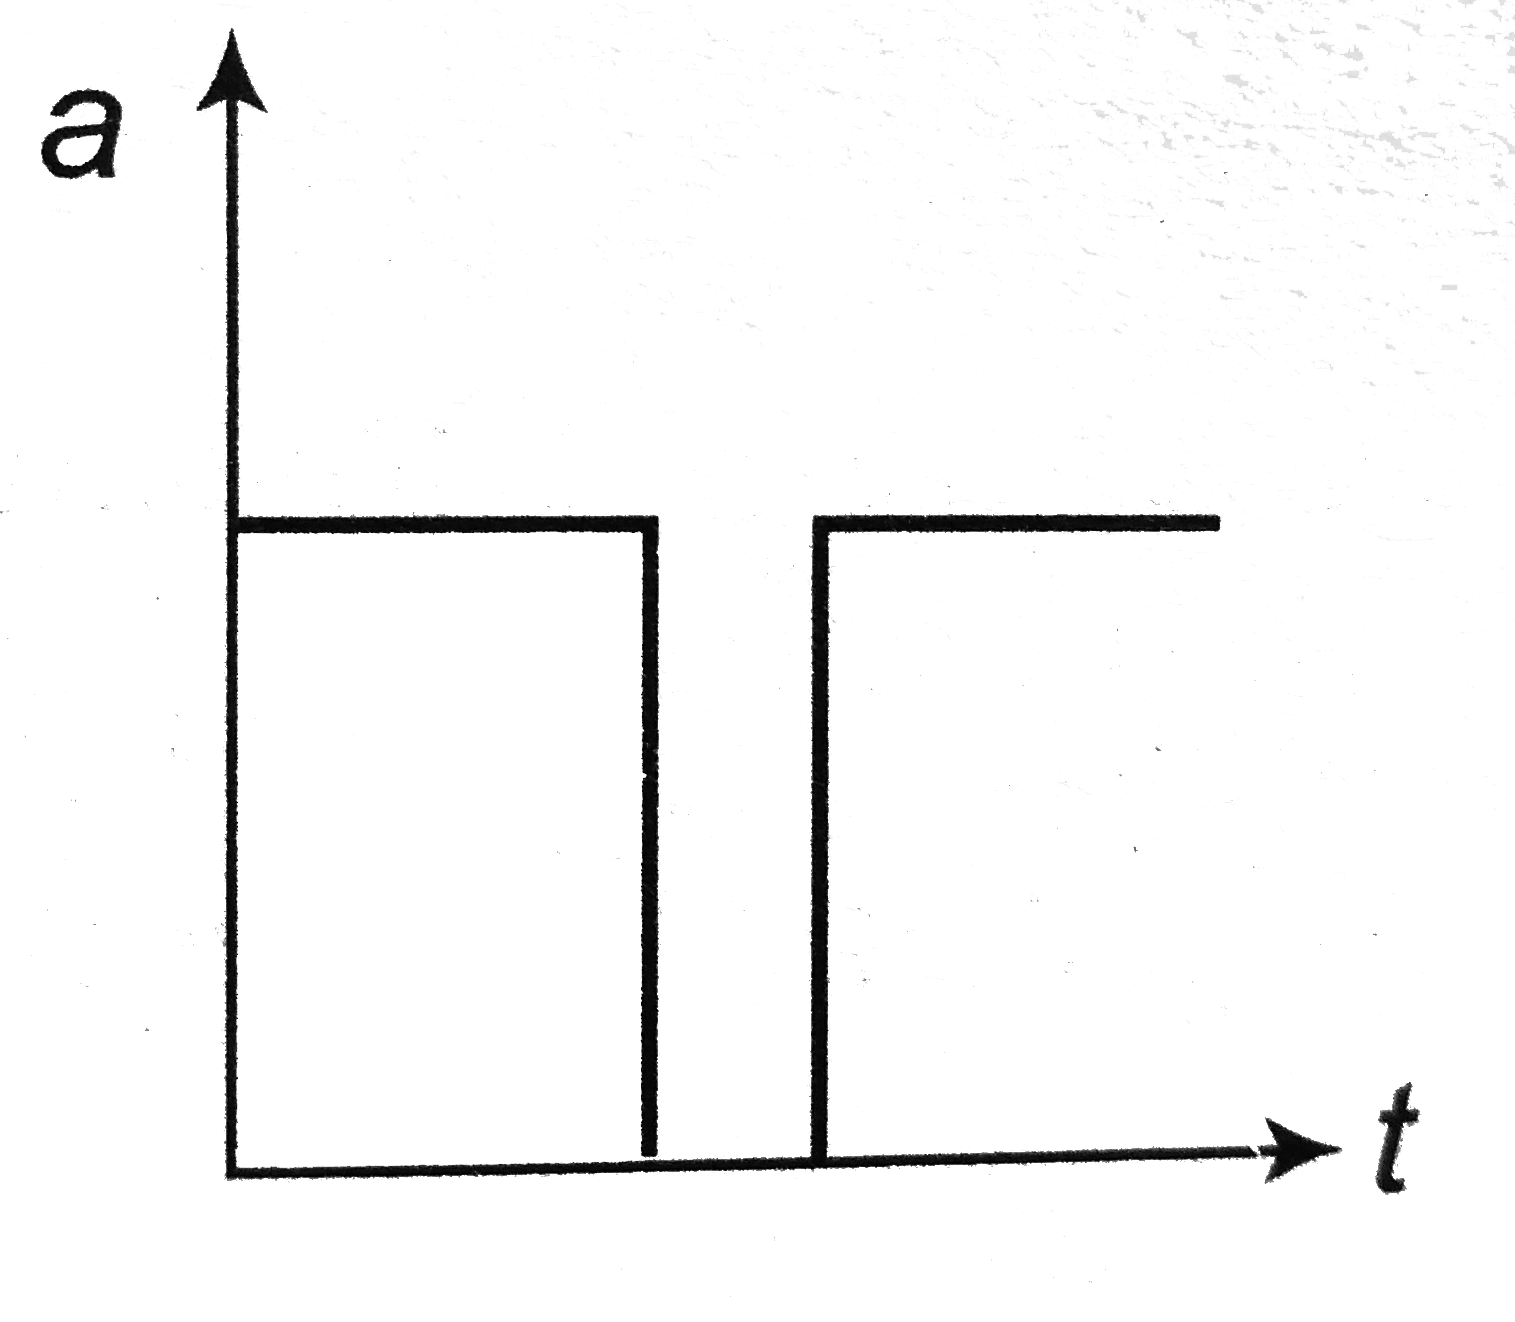
View SolutionAcceleration time graph of a body is shown below the corresponding velocity time graph of the same body is
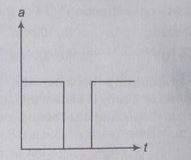
View SolutionAcceleration time graph of a body is shown below the corresponding velocity time graph of the same body is

View Solution
