Study the following table carefully to answer these questions.
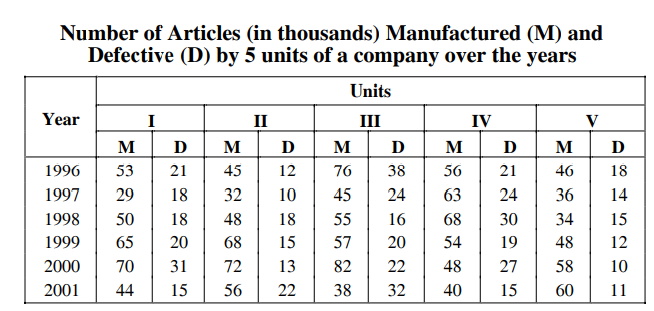 What was the percentage (rounded off to nearest integer) of defective articles over the number of articles manufactured by all units together in the year 2001?
42
40
37
33
The correct Answer is:B
Step by step video, text & image solution for Study the following table carefully to answer these questions. What was the percentage (rounded off to nearest integer) of defective articles over the number of articles manufactured by all units together in the year 2001? by Maths experts to help you in doubts & scoring excellent marks in Class 14 exams.
Updated on:21/07/2023Topper's Solved these Questions
Similar Questions
Study the following bar-diagram carefully and answer the questions.
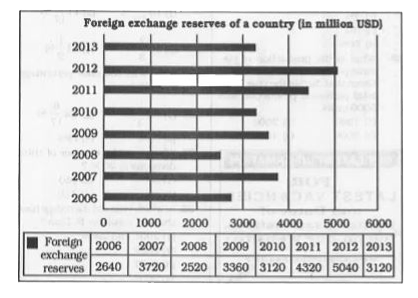
What was the percentage increase in the foreign reserve in 2012 over 2008?
View SolutionStudy the following graph carefully and answer the given questions.
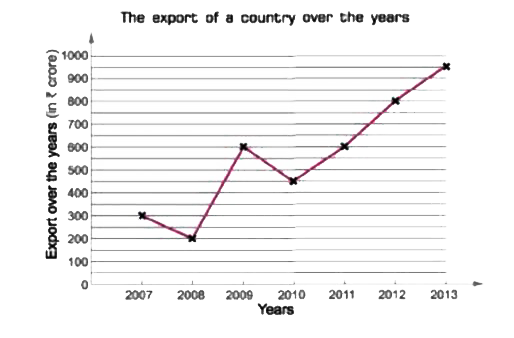
What is the percentage increase in exports from the lowest to the highest for the given years ?
View Solution
Knowledge Check
Study the following table carefully to answer these questions ---
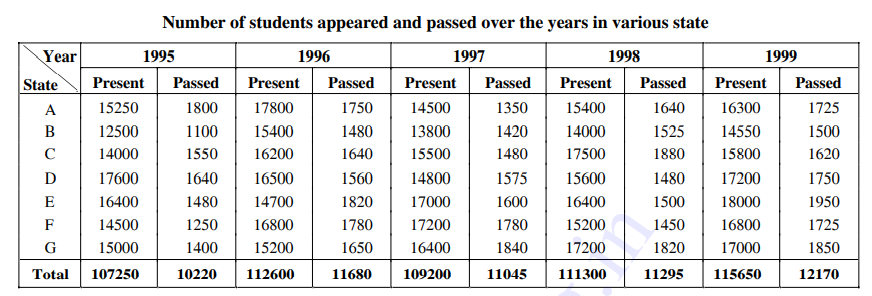
What is the average number of students appeared in B for all years ?A15850B14550C15050DNone of theseStudy the following table carefully to answer these questions ---
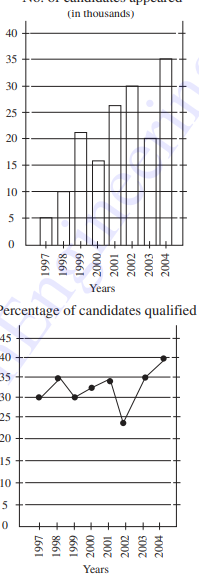
What is the average approximate number of passed students in 1998 all states ?A1630B1516C1615D1545Study the following table carefully to answer these questions ---
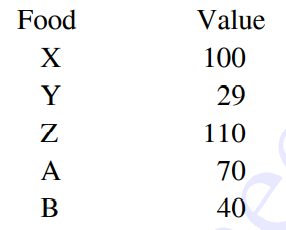
What is the percentage of passed students to the appeared students in 1997 of the states C and D together ?A10B12.5C15D20
Study the following graph carefully and answer the questions that
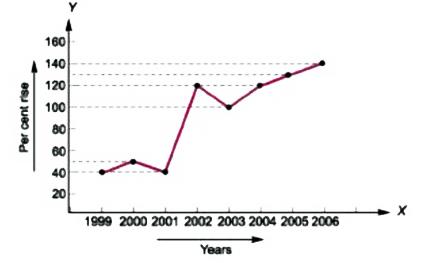
What was the average of percent rise over the given years ?
View SolutionStudy the following table carefully to answer these questions -----
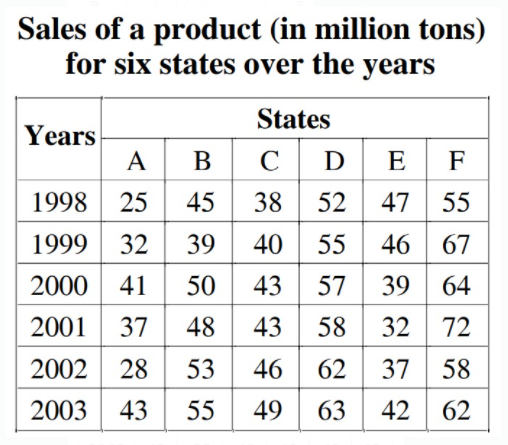
What was the percentage increase in total sales in 2003 from 1998 ?
(Rounded off to nearest integer)
View SolutionStudy the following table carefully to answer the questions that follows.
Number of Articles (in thousands) Manufactured (M) and Defective (D) company over the years-
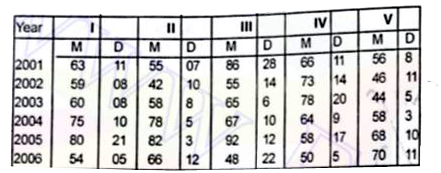
What was the percentage of defective articles over the number of articles manufactured by all units together in the year 2005 ?
View SolutionStudy the following table carefully to answer these questions.
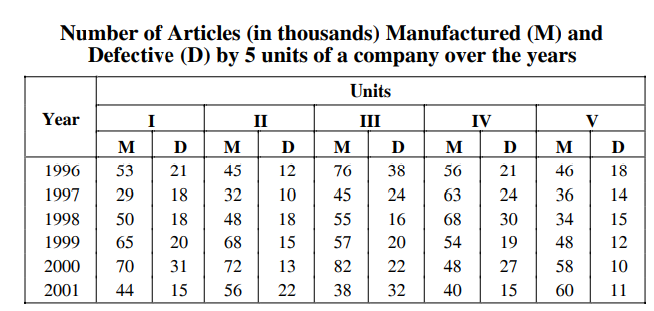
During which year was the percentage increase/decrease in manufacture from the previous year the highest for unit?
View SolutionStudy the following graph carefully and answer the questions that
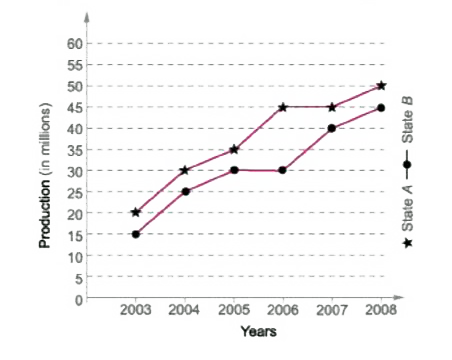
What was the average population of State B ( in millions ) for the years together ?
View Solution
