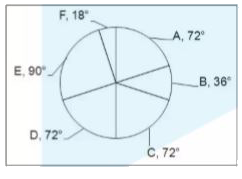
The given pie chart shows the number of students who likes different subjects. If a student is selected at random, then which of the following option is correct?
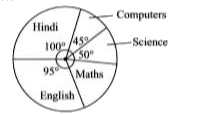
Total number of students = 1440
Probability of selecting a student who like Hindi is less than 729
Probability of selecting a student who like Science is more than 1136.
Probability of selecting a student who like Computers is more than 140.
Probability of selecting a student who like English lies between 0 and 14.
The correct Answer is:C
Step by step video, text & image solution for The given pie chart shows the number of students who likes different subjects. If a student is selected at random, then which of the following option is correct? Total number of students = 1440 by Maths experts to help you in doubts & scoring excellent marks in Class 8 exams.
Topper's Solved these Questions
Similar Questions
The following pie-chart shows the number of students who failed in different subjects in an examination. Examine the chart and answer the following questions. The total number of students who have failed is 500.
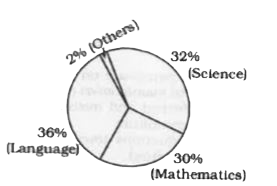
The number of students failed in science is less than the number of students failed in all other subjects by :View SolutionDirection :- The following pie-chart shows the number of students who failed in different subjects in an examination. Examine the chart and answer the following questions. The total number of students who have failed is 500.
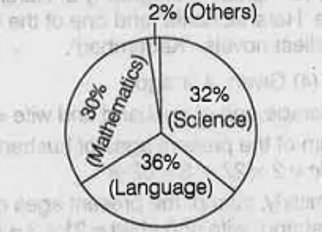
The number of students failed in Science is less than the number of student failed in all other subects byView Solution
Knowledge Check
- Question 1 - Select One
The Pie-graph given here shows the number of students opting different subjects in a school. If there are a total of 720 students, then by studying the pie-graph answer the questions.
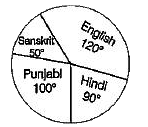
The total number of students studying English and Punjabi subjects areA220B440C110D240 - Question 2 - Select One
The pie chart given below shows the number of female students in different subjects. The number of female students in a particular subject are shown as a percentage of total number of female students in all the subjects together.
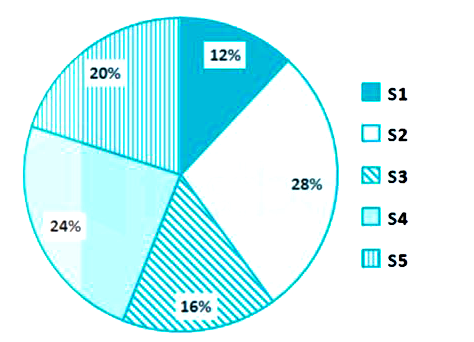
If the total number of female students are 3600, then what is the difference in number of female students in subjects S1 and S4?A412B400C432D456
The following pie-chart shows the number of students who failed in different subjects in an examination. Examine the chart and answer the following questions. The total number of students who have failed is 500.
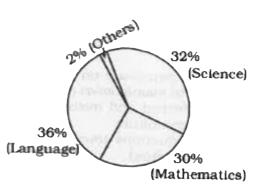
The central angle of the sector for the students who have failed in mathematics is :View SolutionThe following piechart shows the number of students who failed in different subjects in an examination. Examine the chart and answer the questions 5 to the total number of students who have failed is 500.

Number of students who failed in Mathema tics is less than the students who did not qualify in language is -View SolutionThe following piechart shows the number of students who failed in different subjects in an examination. Examine the chart and answer the questions 5 to the total number of students who have failed is 500.

Total number of students who did not qualify in Mathematics or Language or Science, isView SolutionThe pie chart given below shows the number of students in 6 different sections. The total number of students is 1800.
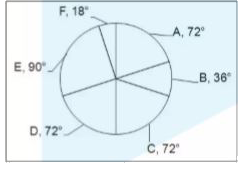
What is the ratio of number of students in section D to the number of students in section F and B?View SolutionThe given bar graph, shows the number of students in different classes.
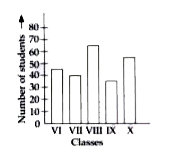
Find the total number of students in the classes VIII to X.View SolutionThe pie chart given below shows the number of students in 6 different sections. The total number of students is 1800.
What is the difference between the number of students in section F to the number of students in section C?View Solution

