Study graph carefully and answer the following questions.
The Bar graph shows the total production of Car and Bike in given years by a company and the Line graph shows the per unit selling price of Car in given years.
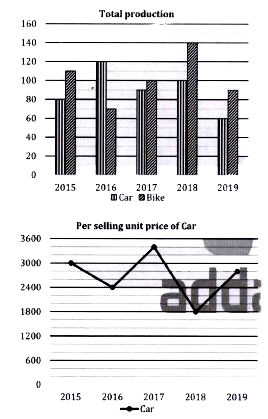
If production of car in 2020 is increased by 20% over previous year and selling price of Car increased by 12.5% over previous year, then find total per cent increase in revenue of car in 2020 over previous year?
The correct Answer is:B
Step by step video, text & image solution for Study graph carefully and answer the following questions. The Bar graph shows the total production of Car and Bike in given years by a company and the Line graph shows the per unit selling price of Car in given years. If production of car in 2020 is increased by 20% over previous year and selling price of Car increased by 12.5% over previous year, then find total per cent increase in revenue of car in 2020 over previous year? by Maths experts to help you in doubts & scoring excellent marks in Class 14 exams.
Topper's Solved these Questions
- BOOK - ADDA247CHAPTER - DATA INTERPRETATIONEXERCISE - Mains Questions33videos
DATA INTERPRETATION
- BOOK - ADDA247CHAPTER - DATA INTERPRETATIONEXERCISE - Previous Year Questions56videos
DATA INTERPRETATION
- BOOK - ADDA247CHAPTER - DATA INTERPRETATIONEXERCISE - Prelims Questions (Level-1)54videos
DATA INTERPRETATION
- BOOK - ADDA247CHAPTER - BOAT AND STREAM EXERCISE - Previous Year Question22videos
BOAT AND STREAM
- BOOK - ADDA247CHAPTER - DATA SUFFICIENCY EXERCISE - PREVIOUS YEAR QUESTIONS25videos
DATA SUFFICIENCY
Similar Questions
Study the graph carefully and answer the questions.
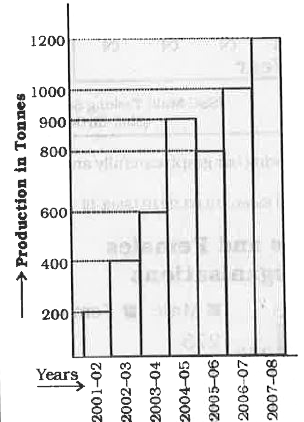
The graph shows production of an item (in tonnes) during certain years
The year in which productions increased the lowest as compared to the previous year isView SolutionStudy the table carefully to answer the following questions ----
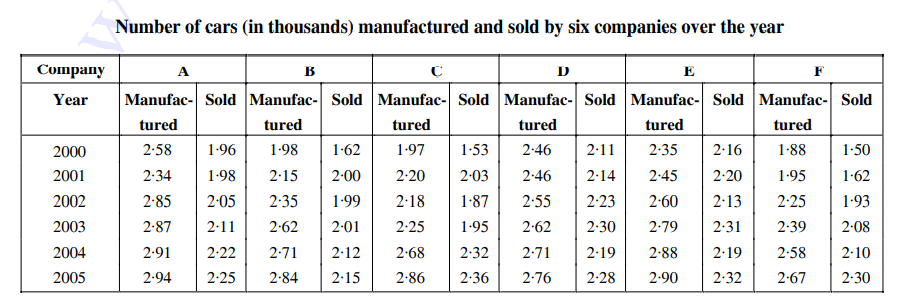
What is the approximate percent increase in the number of cars sold by company F in the year 2004 from the previous year ?View Solution
Knowledge Check
- Question 1 - Select One
Study the graph carefully and answer the following questions.
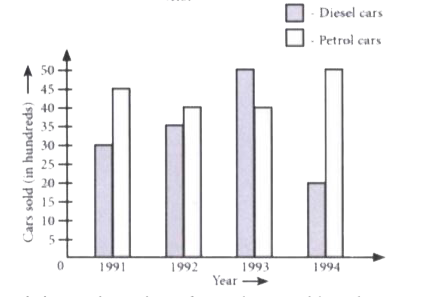
How many cars were sold during the year 1991?A9000B6500C7500D7000 - Question 2 - Select One
Study the graph carefully and answer the following questions.
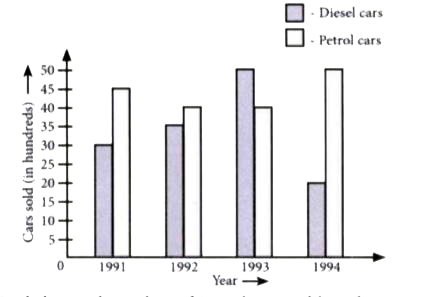
Find the total number of Diesel cars sold in the year 1992 and 1994 together.A2500B5500C1500D4500 - Question 3 - Select One
Study the graph carefully and answer the questions.
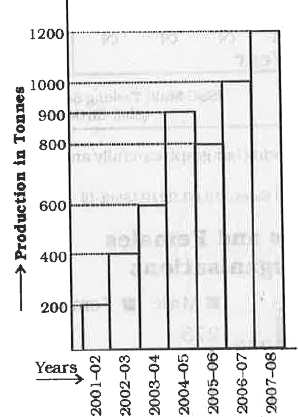
The graph shows production of an item (in tonnes) during certain years
The production from 2003-04 to 2007-08 increased byA125%B50%C75%D100%
Study the following graph carefully and answer the given questions :-
The following graph shows the % profit of two companies over the years :-
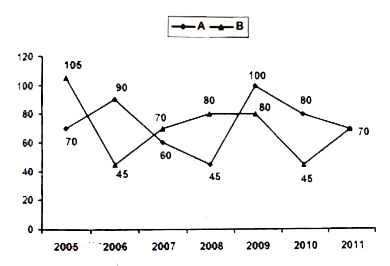
In which of the following years the ratio of expenditure to income was the least for company B?View SolutionStudy the following graph carefully and answer the questions that follow
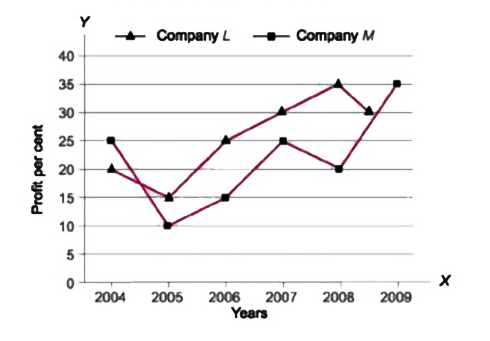
What was the percentage increase in percent rise in profit of company M in the year 2009 from the previous year ?View SolutionStudy the following graph carefully and answer the questions that
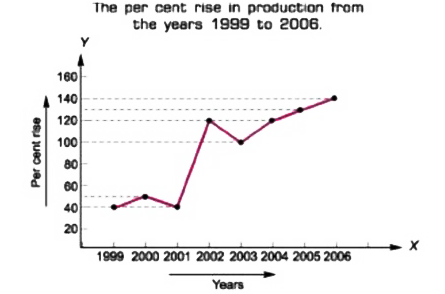
If the production in year 1998 was 1000 units , how much was the production in year 2002 ?View SolutionStudy the following graph carefully and answer the given questions :-
The following graph shows the % profit of two companies over the years :-
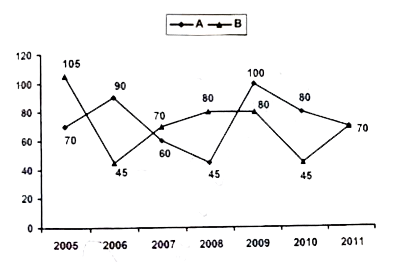
If the total expenditure of company A in 2007 was Rs 150 lakhs what was the total income ?View SolutionThe graph shows the production of food grains of a country in different years. Study the graph and answer the questions.
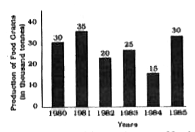
The percentage increase in production from 1984 to 1985 wasView Solution

