Table given below gives information about total no. of product sold by five companies, ratio of product sold in rural area to product sold in urban area by each company and also gives ratio of total mobile sold in rural area to total laptop sold in rural area by each company.
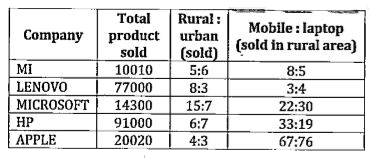
Find ratio of average no. of mobile sold by MI, MICROSOFT and APPLE in rural area to no. of product sold by LENOVO in urban area.
39:200
39:193
13:85
200:39
The correct Answer is:A
Step by step video, text & image solution for Table given below gives information about total no. of product sold by five companies, ratio of product sold in rural area to product sold in urban area by each company and also gives ratio of total mobile sold in rural area to total laptop sold in rural area by each company. Find ratio of average no. of mobile sold by MI, MICROSOFT and APPLE in rural area to no. of product sold by LENOVO in urban area. by Maths experts to help you in doubts & scoring excellent marks in Class 14 exams.
Topper's Solved these Questions
- BOOK - ADDA247CHAPTER - DATA INTERPRETATIONEXERCISE - Mains Questions33videos
DATA INTERPRETATION
- BOOK - ADDA247CHAPTER - DATA INTERPRETATIONEXERCISE - Previous Year Questions56videos
DATA INTERPRETATION
- BOOK - ADDA247CHAPTER - DATA INTERPRETATIONEXERCISE - Prelims Questions (Level-1)54videos
DATA INTERPRETATION
- BOOK - ADDA247CHAPTER - BOAT AND STREAM EXERCISE - Previous Year Question22videos
BOAT AND STREAM
- BOOK - ADDA247CHAPTER - DATA SUFFICIENCY EXERCISE - PREVIOUS YEAR QUESTIONS25videos
DATA SUFFICIENCY
Similar Questions
Knowledge Check
- Question 1 - Select One
In rural areas of India found
AEducated unemploymentBInvisible unemployment,CCyclical unemploymentDResistant unemployment. - Question 2 - Select One
The type of unemployment found in rural areas is
AOpen unemployment,BStructural unemploymentCSeasonal unemploymentDFrictional unemployment. - Question 3 - Select One
The given pie chart shows the quantity wise sales distribution of five products (A, B, C, D and E) of a company in 2016.
दिया गया पाई चार्ट 2016 में एक कंपनी के पाँच उत्पादों ( A, B, C, D और E ) की मात्रा वार बिक्री का वितरण दर्शाता है |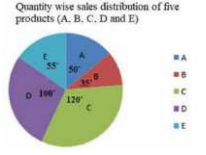 If 320 units of product A were sold by the company, then how many units of products B and E together were sold by the company?
यदि कंपनी के द्वारा वस्तु A की 320 इकाइयाँ बेची गयीं , तो कंपनी के द्वारा बेची गयी वस्तु B और E की कुल इकाइयों की संख्या ज्ञात करें |A567B576C512D640
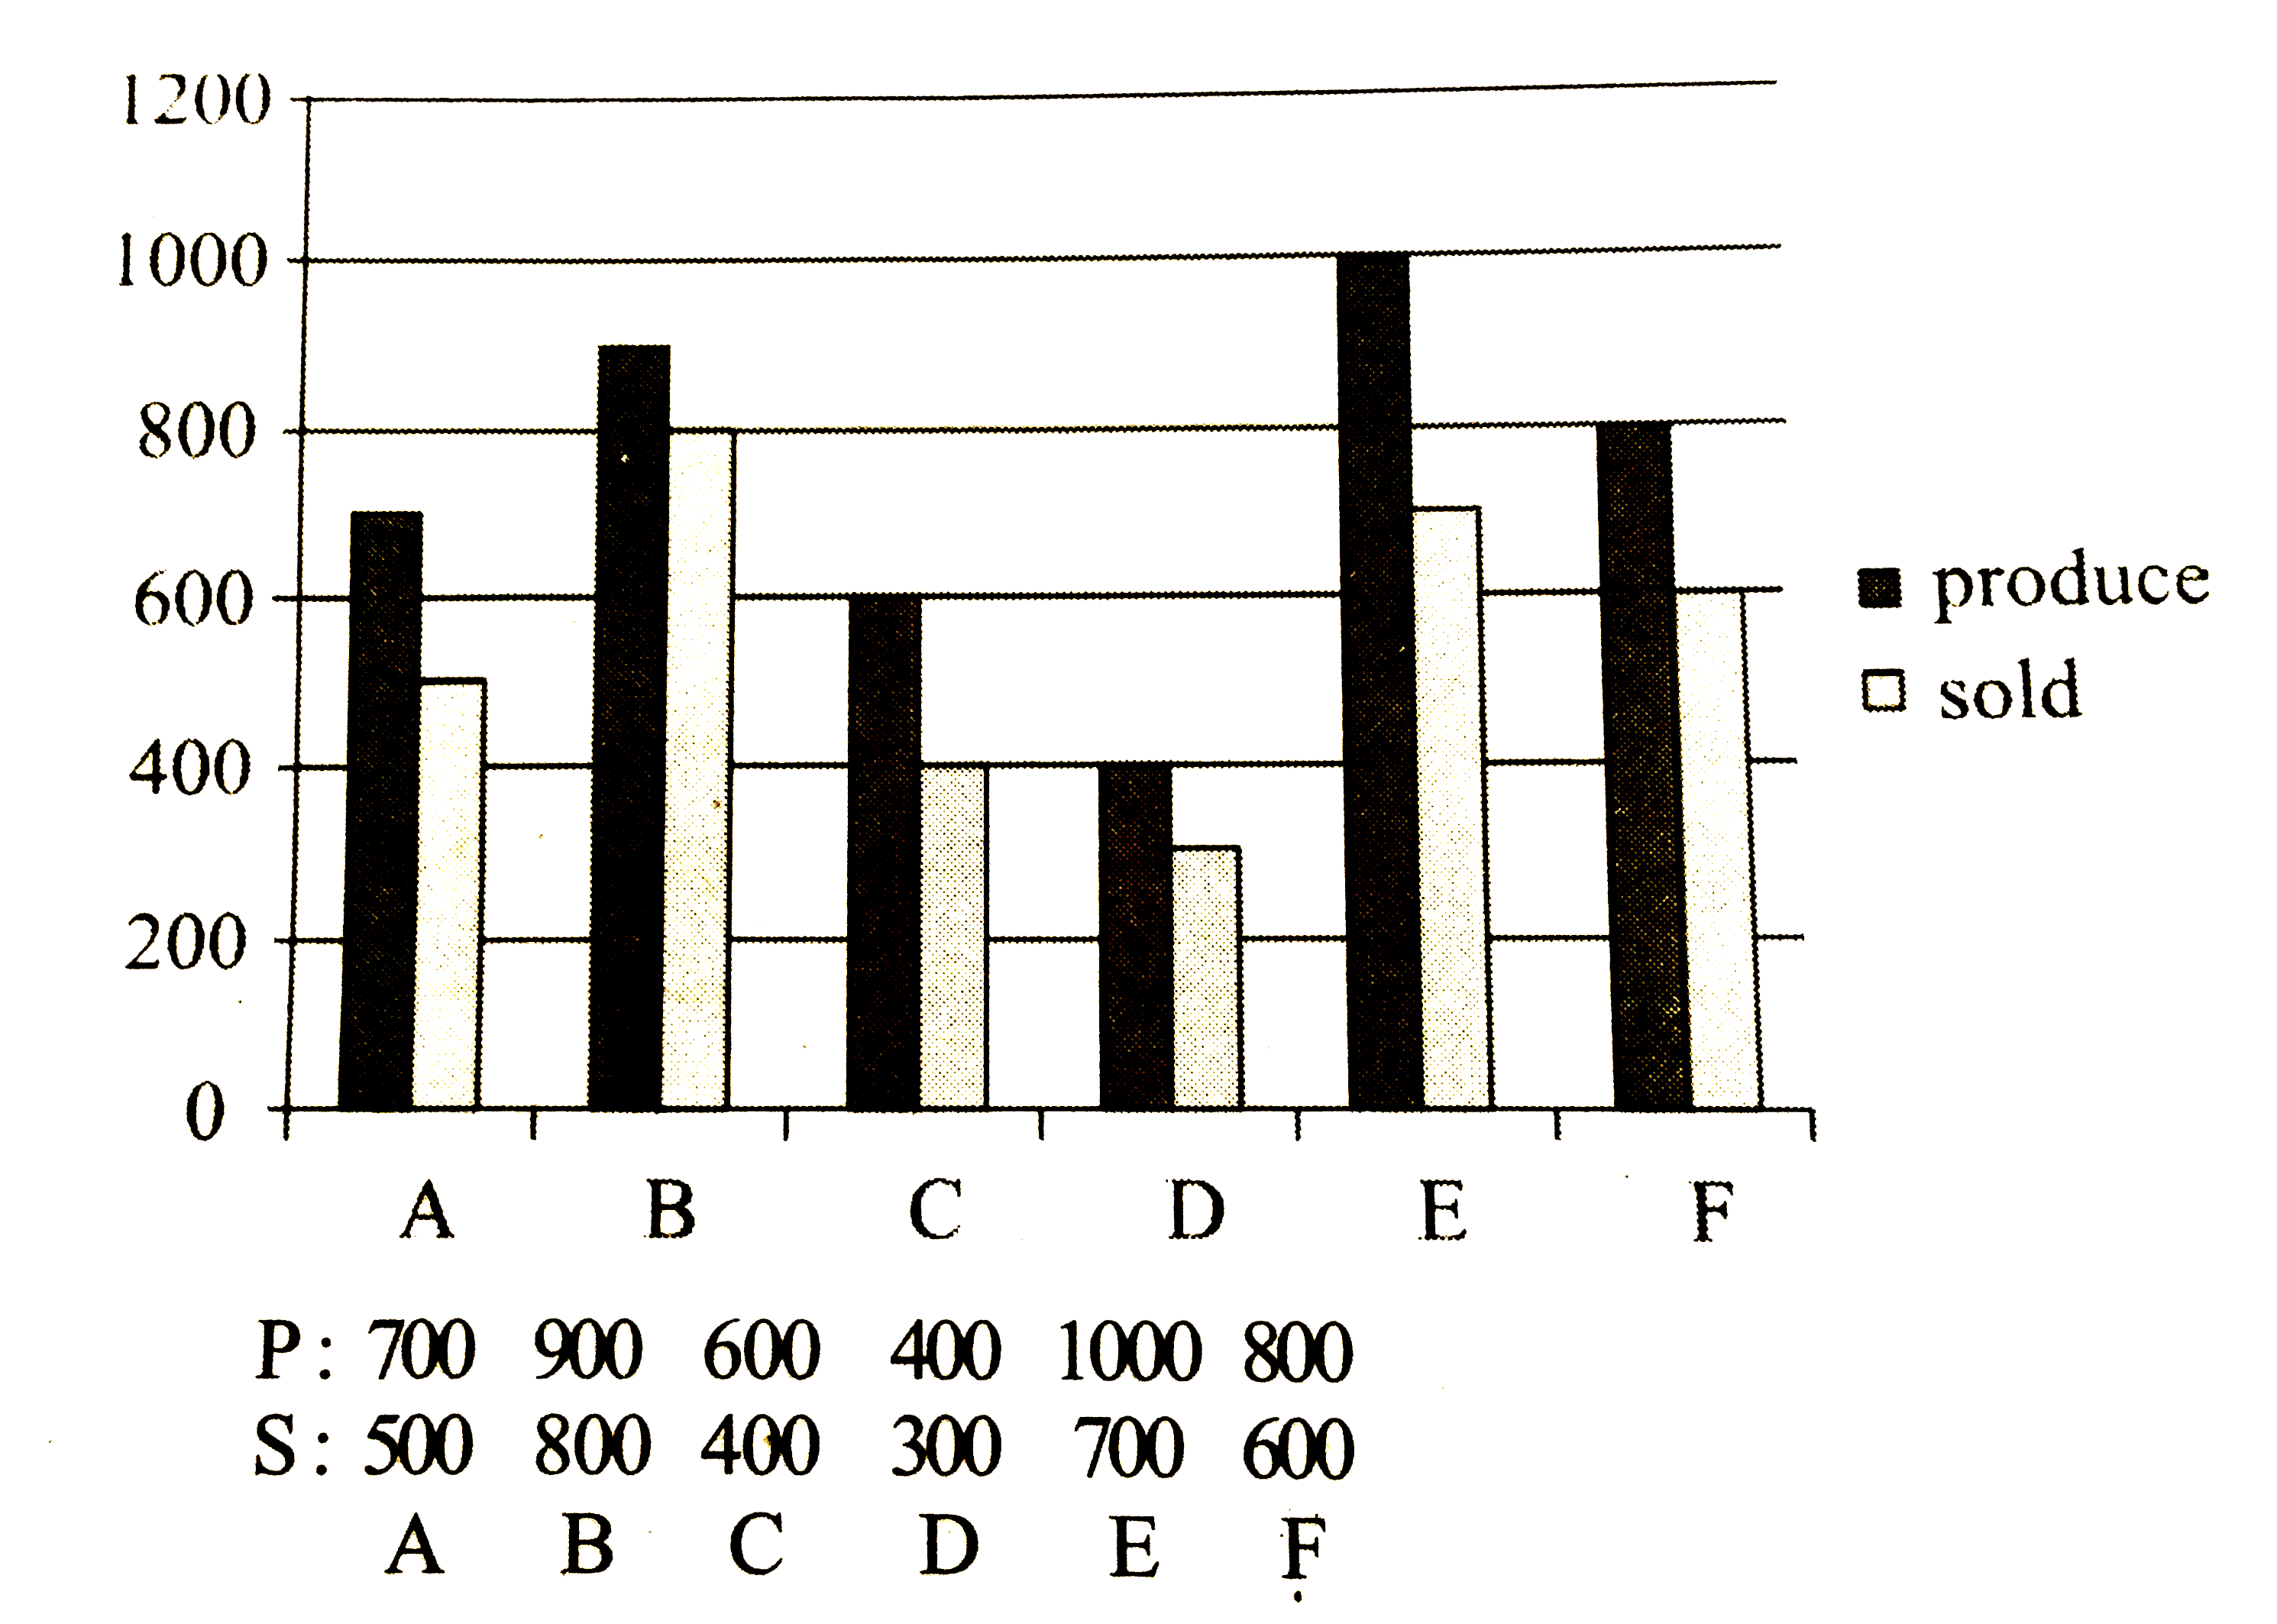
What is the ratio of total production of all the companies to the total sales of all the companies ?View Solution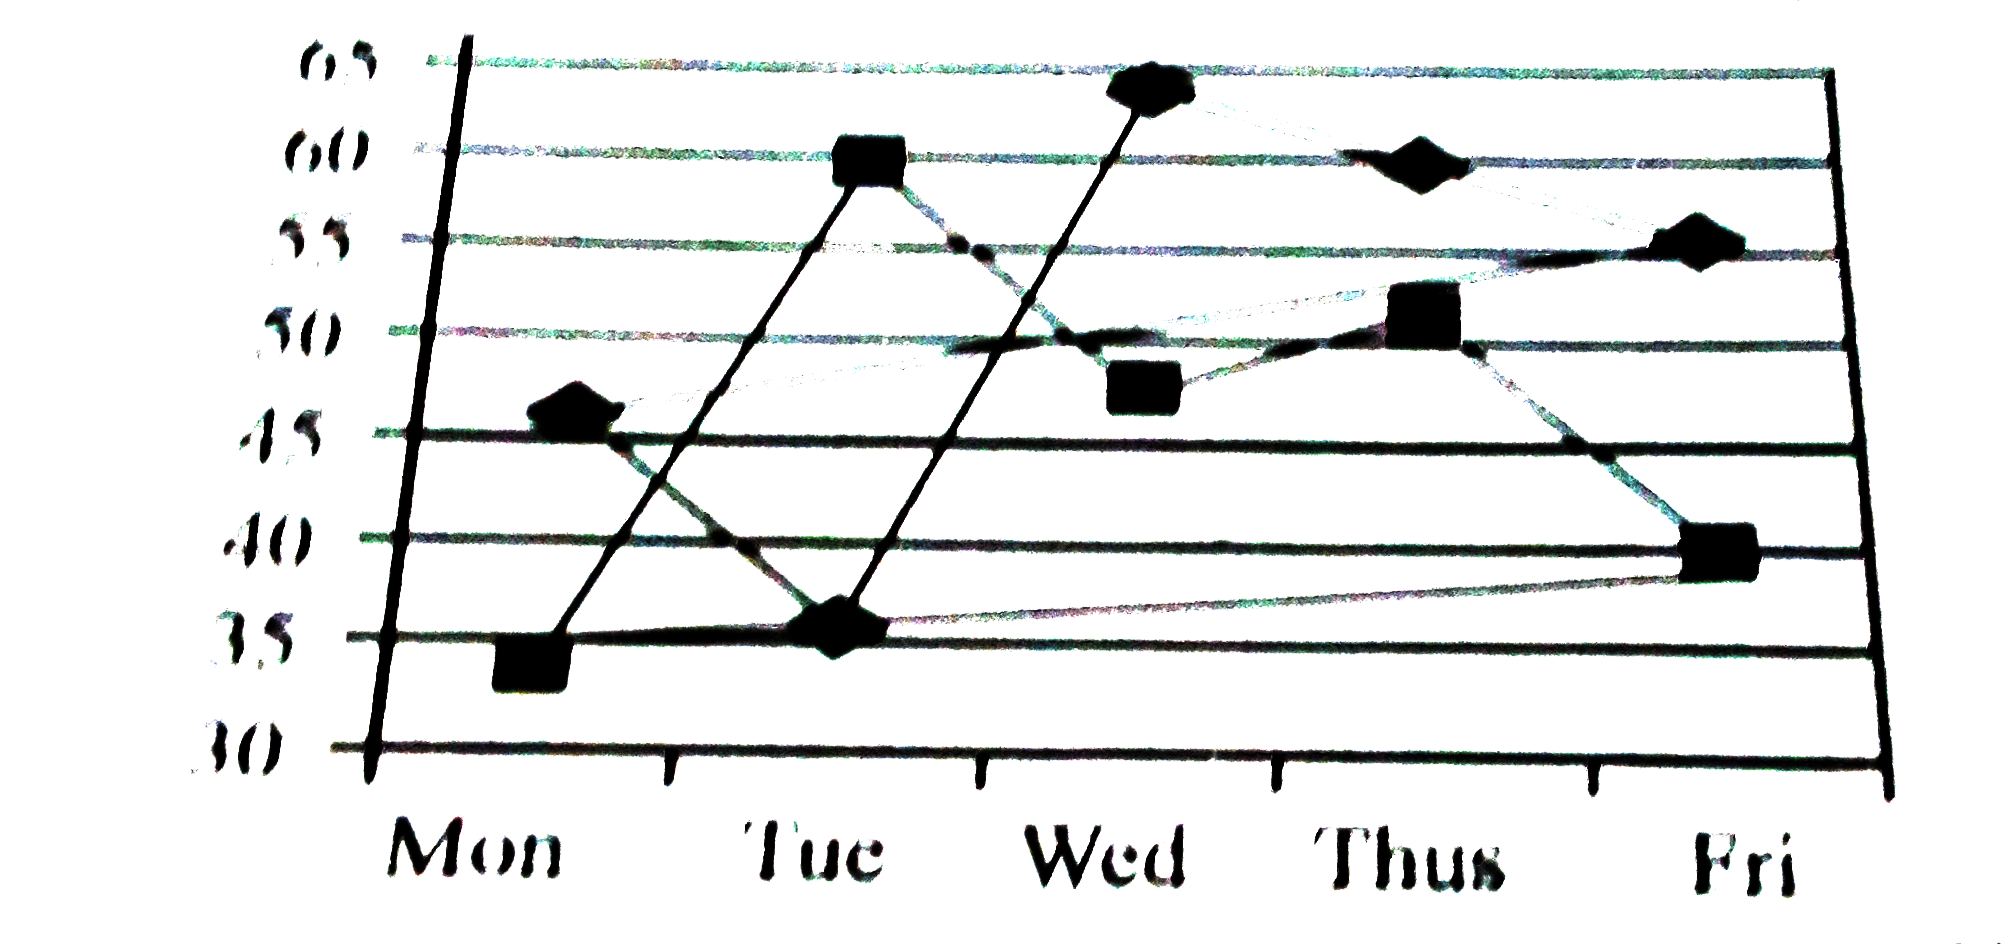
Find the ratio of number of mobiles sold by P on Tuesday & Friday together to number of mobiles sold by Q on same days.View SolutionPeople in rural areas earn their living in:
View SolutionThe given table represents the sale (in thousands) of cars by four companies A,B,C and D in six years. Study the table and answer the questions that follow:
दी गयी तालिका चार कंपनियों - A, B, C और D के द्वारा छः वर्षों में की गयी कारों की बिक्री ( हज़ार में ) दर्शाती है | इस तालिका का अध्ययन करें तथा फिर पूछे गए प्रश्नों के उत्तर दें |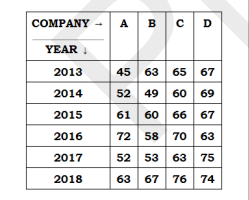 What is the ratio of total number of cars sold by companies A,B and D in 2017 to the total number
of cars sold by all companies in 2018?
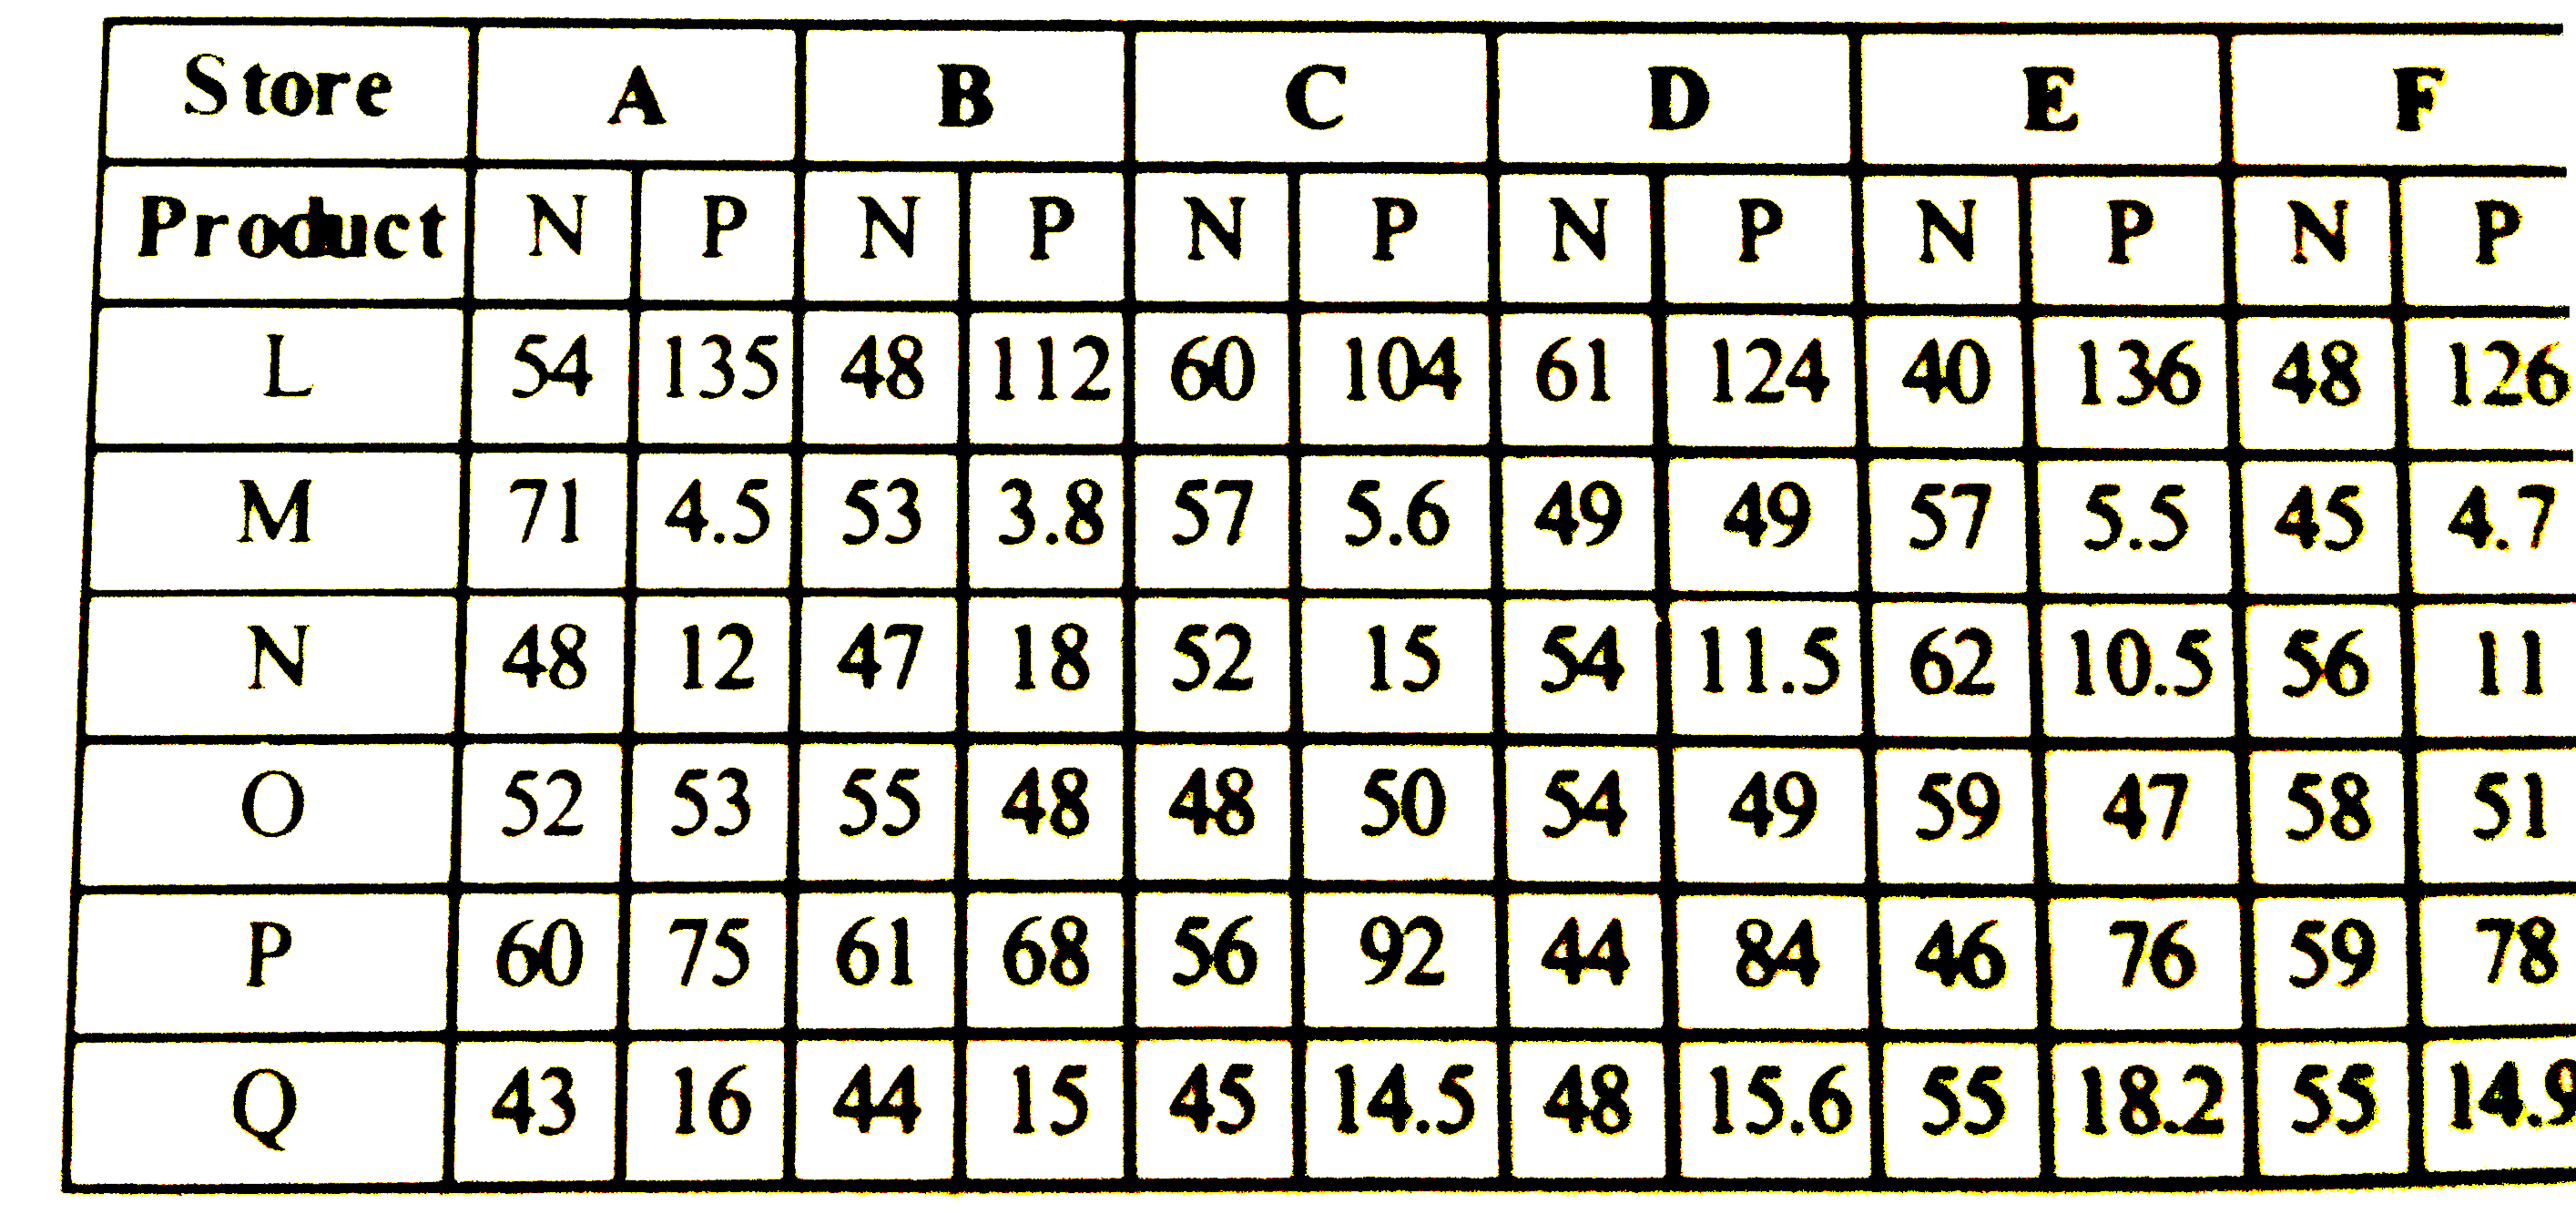
कंपनी A, B और D के द्वारा 2017 में बेची गयी कारों की कुल संख्या तथा 2018 में सभी कंपनियों के द्वारा बेची गयी कारों की कुल संख्या के बीच क्या अनुपात है ?View SolutionWhat is the respective ratio of total number of N and L type products together sold by store D and the same products sold by store A?
View Solution


