Table given below gives information about total no. of product sold by five companies, ratio of product sold in rural area to product sold in urban area by each company and also gives ratio of total mobile sold in rural area to total laptop sold in rural area by each company.
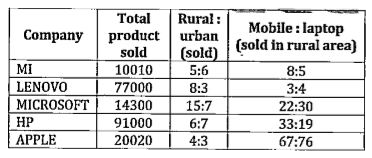
If ratio of mobile sold by MI to laptop sold by MI in urban area is 16 : 23, then find no. of laptop sold by APPLE in rural area is what part of laptop sold by MI in urban area.
304261
261161
304161
161304
The correct Answer is:C
Step by step video, text & image solution for Table given below gives information about total no. of product sold by five companies, ratio of product sold in rural area to product sold in urban area by each company and also gives ratio of total mobile sold in rural area to total laptop sold in rural area by each company. If ratio of mobile sold by MI to laptop sold by MI in urban area is 16 : 23, then find no. of laptop sold by APPLE in rural area is what part of laptop sold by MI in urban area. by Maths experts to help you in doubts & scoring excellent marks in Class 14 exams.
Topper's Solved these Questions
- BOOK - ADDA247CHAPTER - DATA INTERPRETATIONEXERCISE - Mains Questions33videos
DATA INTERPRETATION
- BOOK - ADDA247CHAPTER - DATA INTERPRETATIONEXERCISE - Previous Year Questions56videos
DATA INTERPRETATION
- BOOK - ADDA247CHAPTER - DATA INTERPRETATIONEXERCISE - Prelims Questions (Level-1)54videos
DATA INTERPRETATION
- BOOK - ADDA247CHAPTER - BOAT AND STREAM EXERCISE - Previous Year Question22videos
BOAT AND STREAM
- BOOK - ADDA247CHAPTER - DATA SUFFICIENCY EXERCISE - PREVIOUS YEAR QUESTIONS25videos
DATA SUFFICIENCY
Similar Questions
Knowledge Check
- Question 1 - Select One
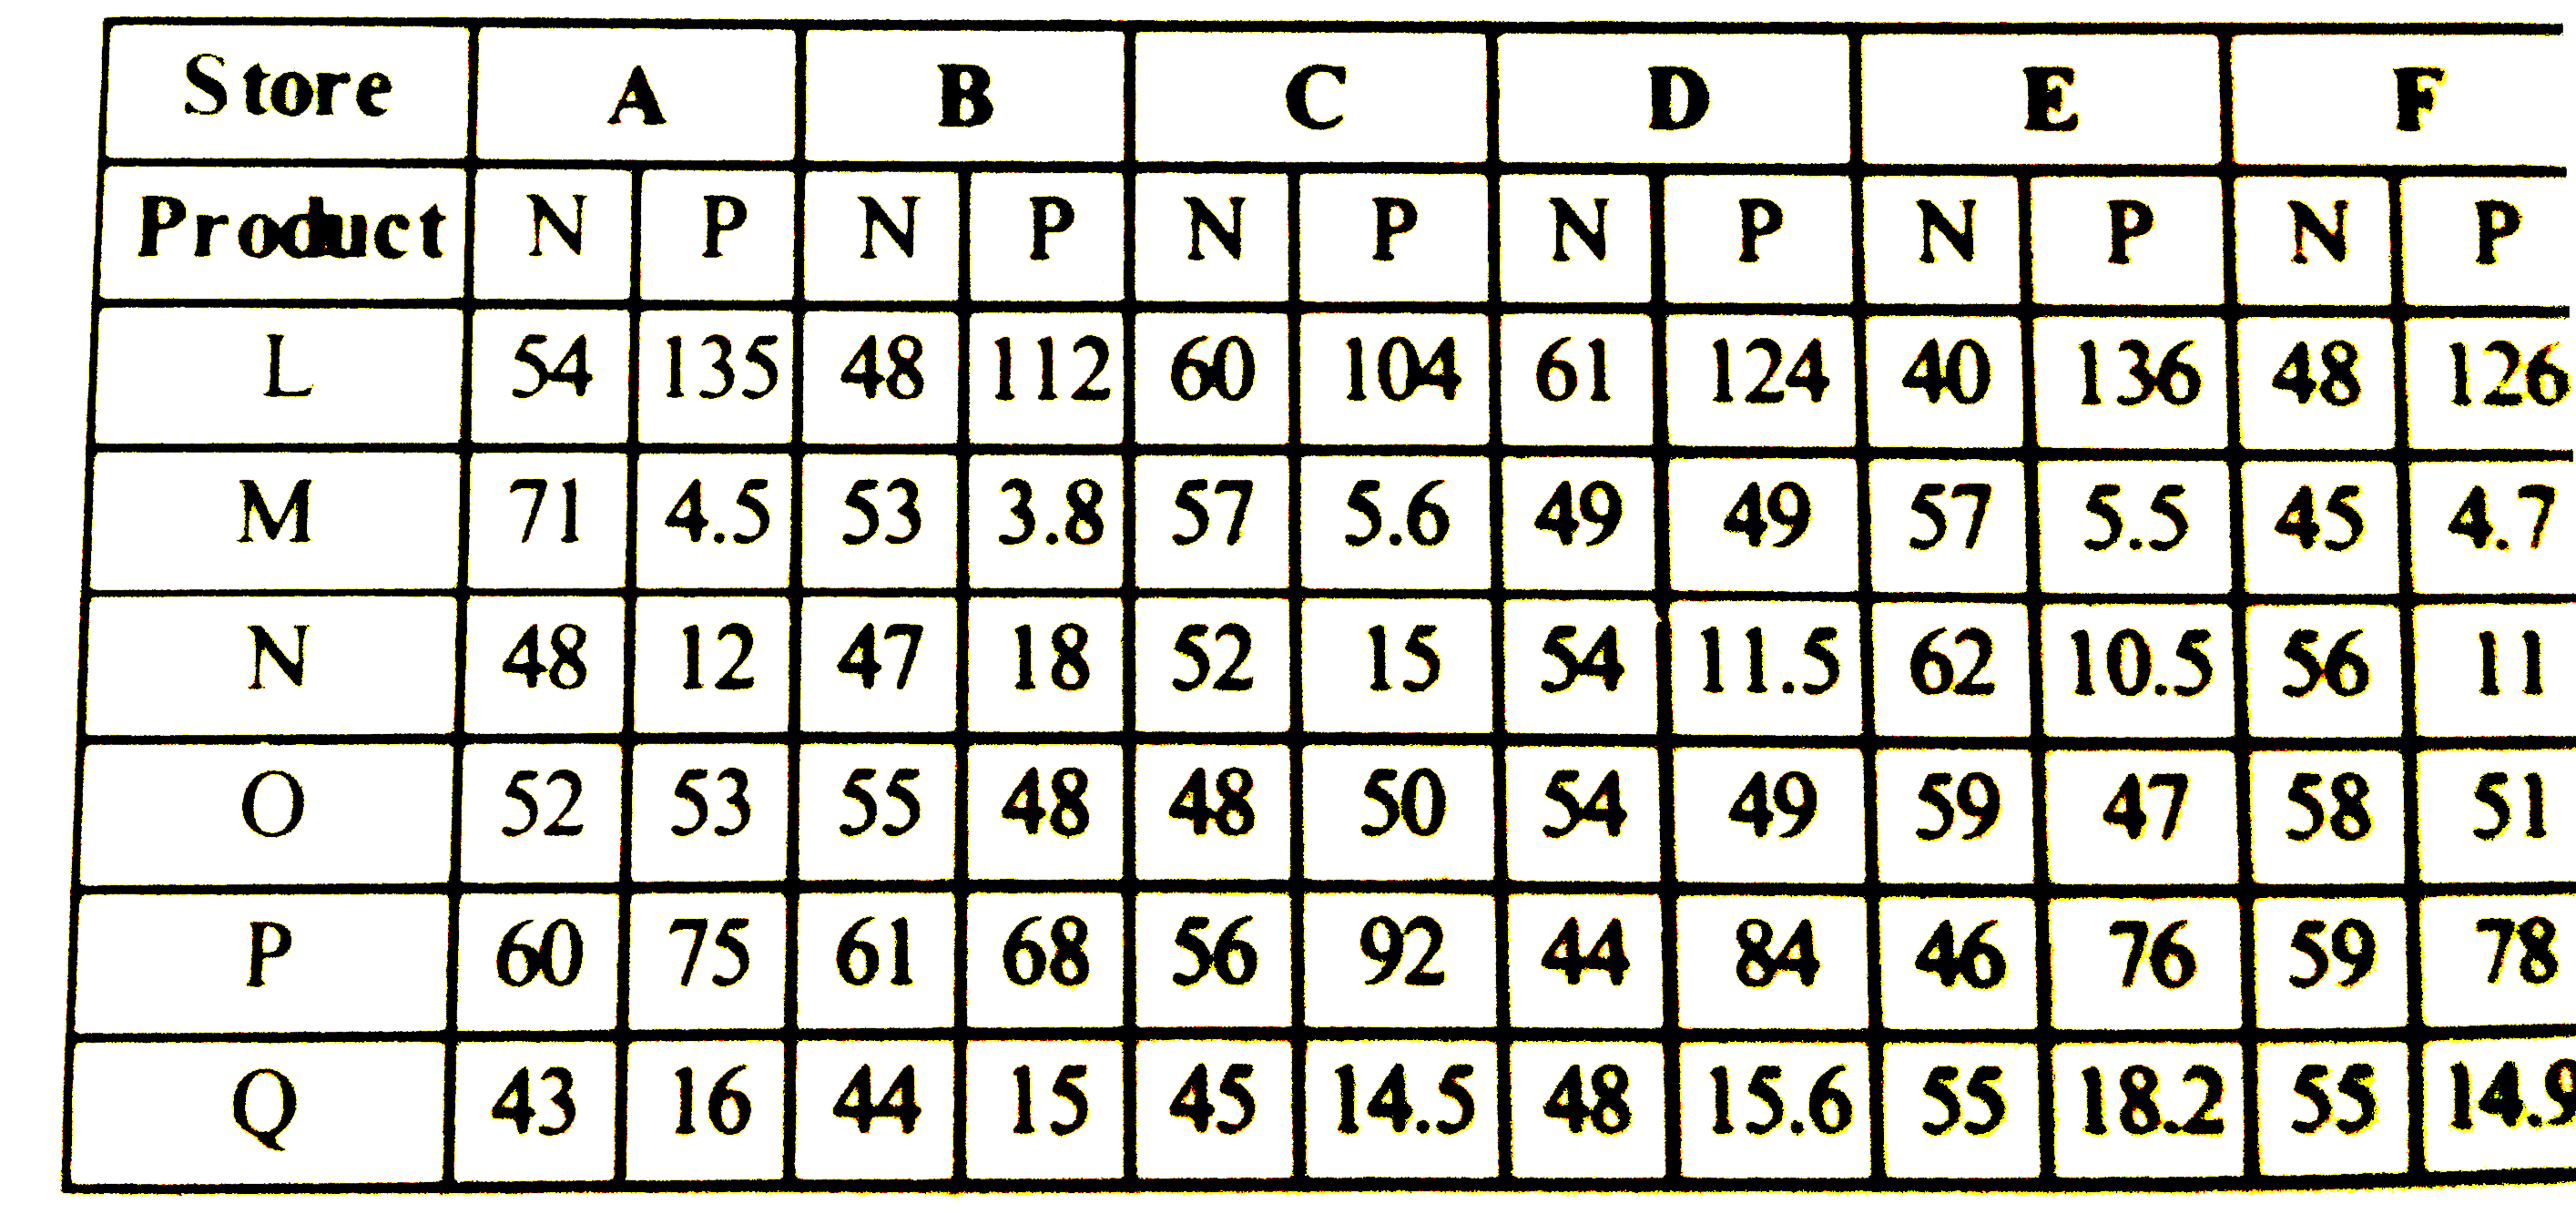
Number of L type product sold by store F is what percent of the number same type of products sold by store E
A76.33%B124%C83.33%D120% - Question 2 - Select One
The given pie chart shows the quantity wise sales distribution of five products (A, B, C, D and E) of a company in 2016.
दिया गया पाई चार्ट 2016 में एक कंपनी के पाँच उत्पादों ( A, B, C, D और E ) की मात्रा वार बिक्री का वितरण दर्शाता है |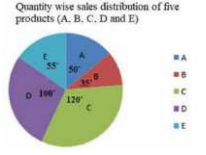 If 320 units of product A were sold by the company, then how many units of products B and E together were sold by the company?
यदि कंपनी के द्वारा वस्तु A की 320 इकाइयाँ बेची गयीं , तो कंपनी के द्वारा बेची गयी वस्तु B और E की कुल इकाइयों की संख्या ज्ञात करें |A567B576C512D640 - Question 3 - Select One
The given bar graph presents the sale of a particular brand of car by three showrooms, A, B and C( in multiples of 100) during the months of Jan, Feb, Mar and Apr, 2016
दिया गया दंड आरेख (बार ग्राफ) तीन शो-रूम- A, B और C के द्वारा जनवरी, फरवरी, मार्च और अप्रैल, 2016 के दौरान कार के एक खास ब्रांड की (100 के गुणक में) बिक्री को दर्शाता है|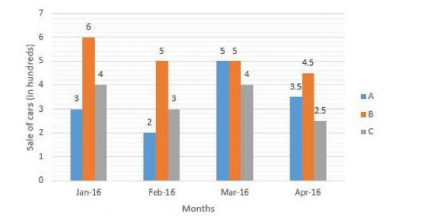 What is the ratio of the number of cars sold by A in Jan-Feb, 2016 to that of cars sold by B during Mar-Apr, 2016?
जनवरी-फरवरी, 2016 में A के द्वारा और मार्च-अप्रैल, 2016 के दौरान B के द्वारा बेची गई कारों की संख्या का अनुपात क्या है?A5:18B8:17C12:19D10:19
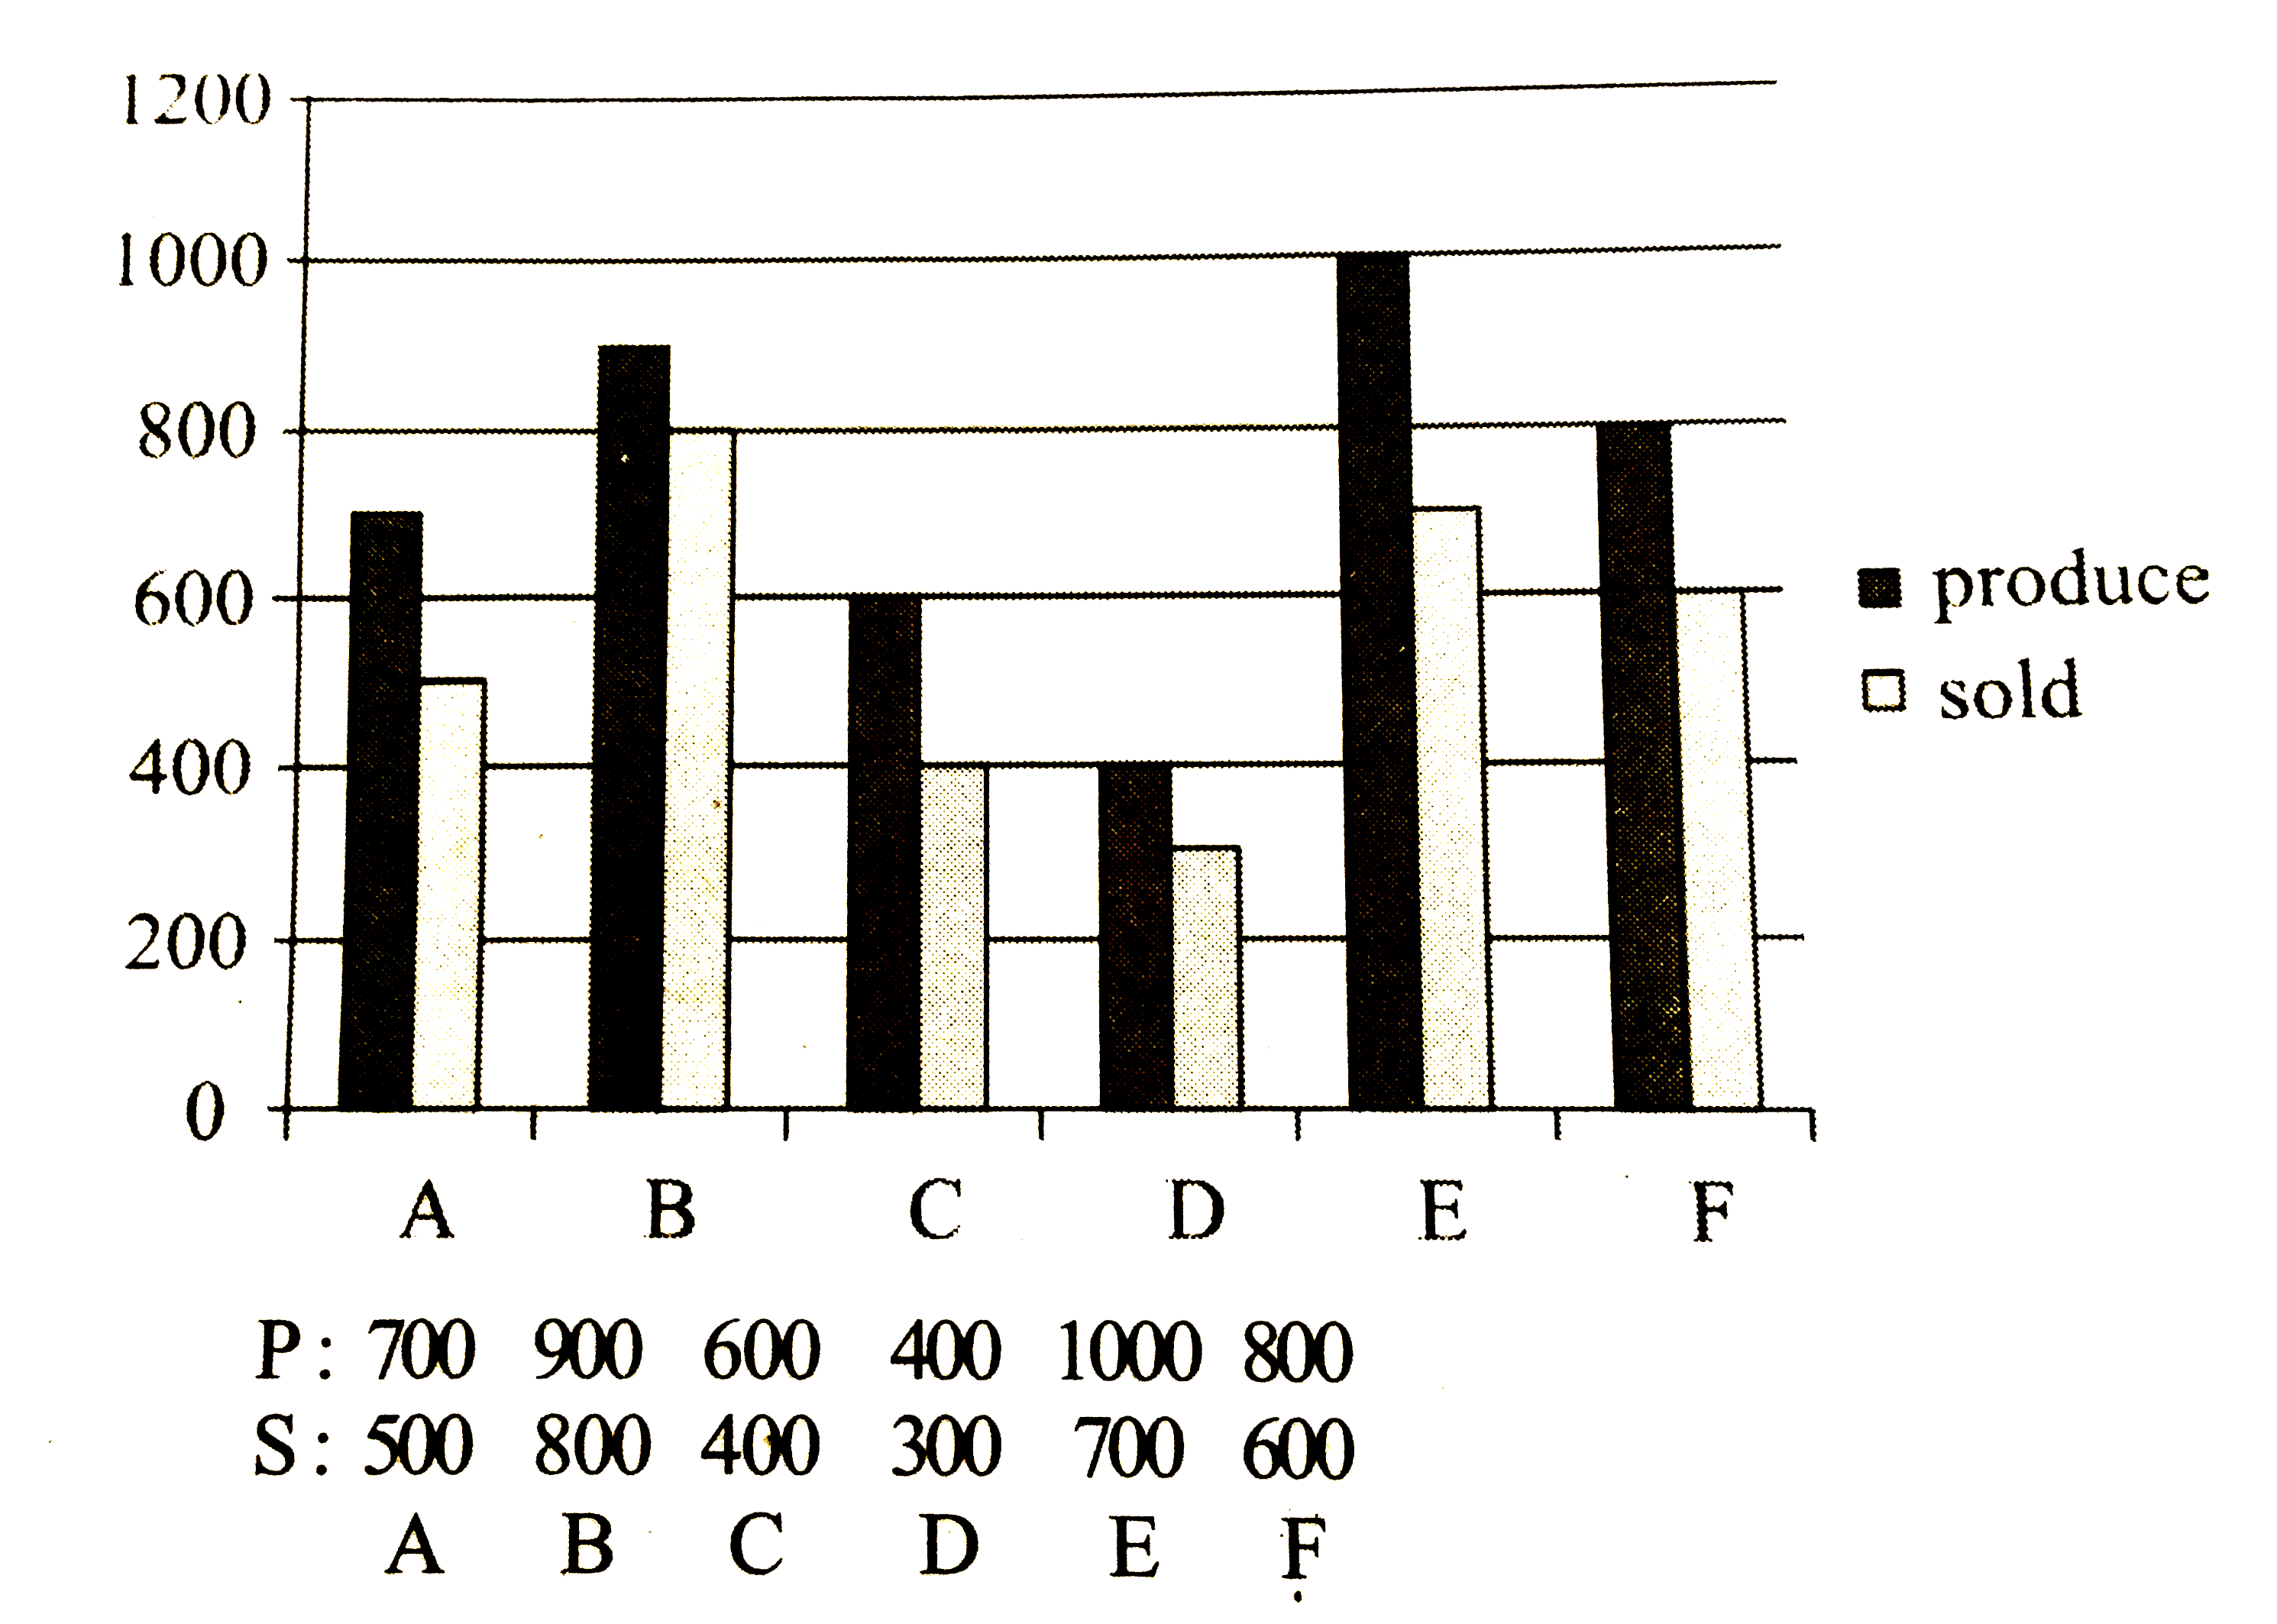
What is the ratio of total production of all the companies to the total sales of all the companies ?View Solution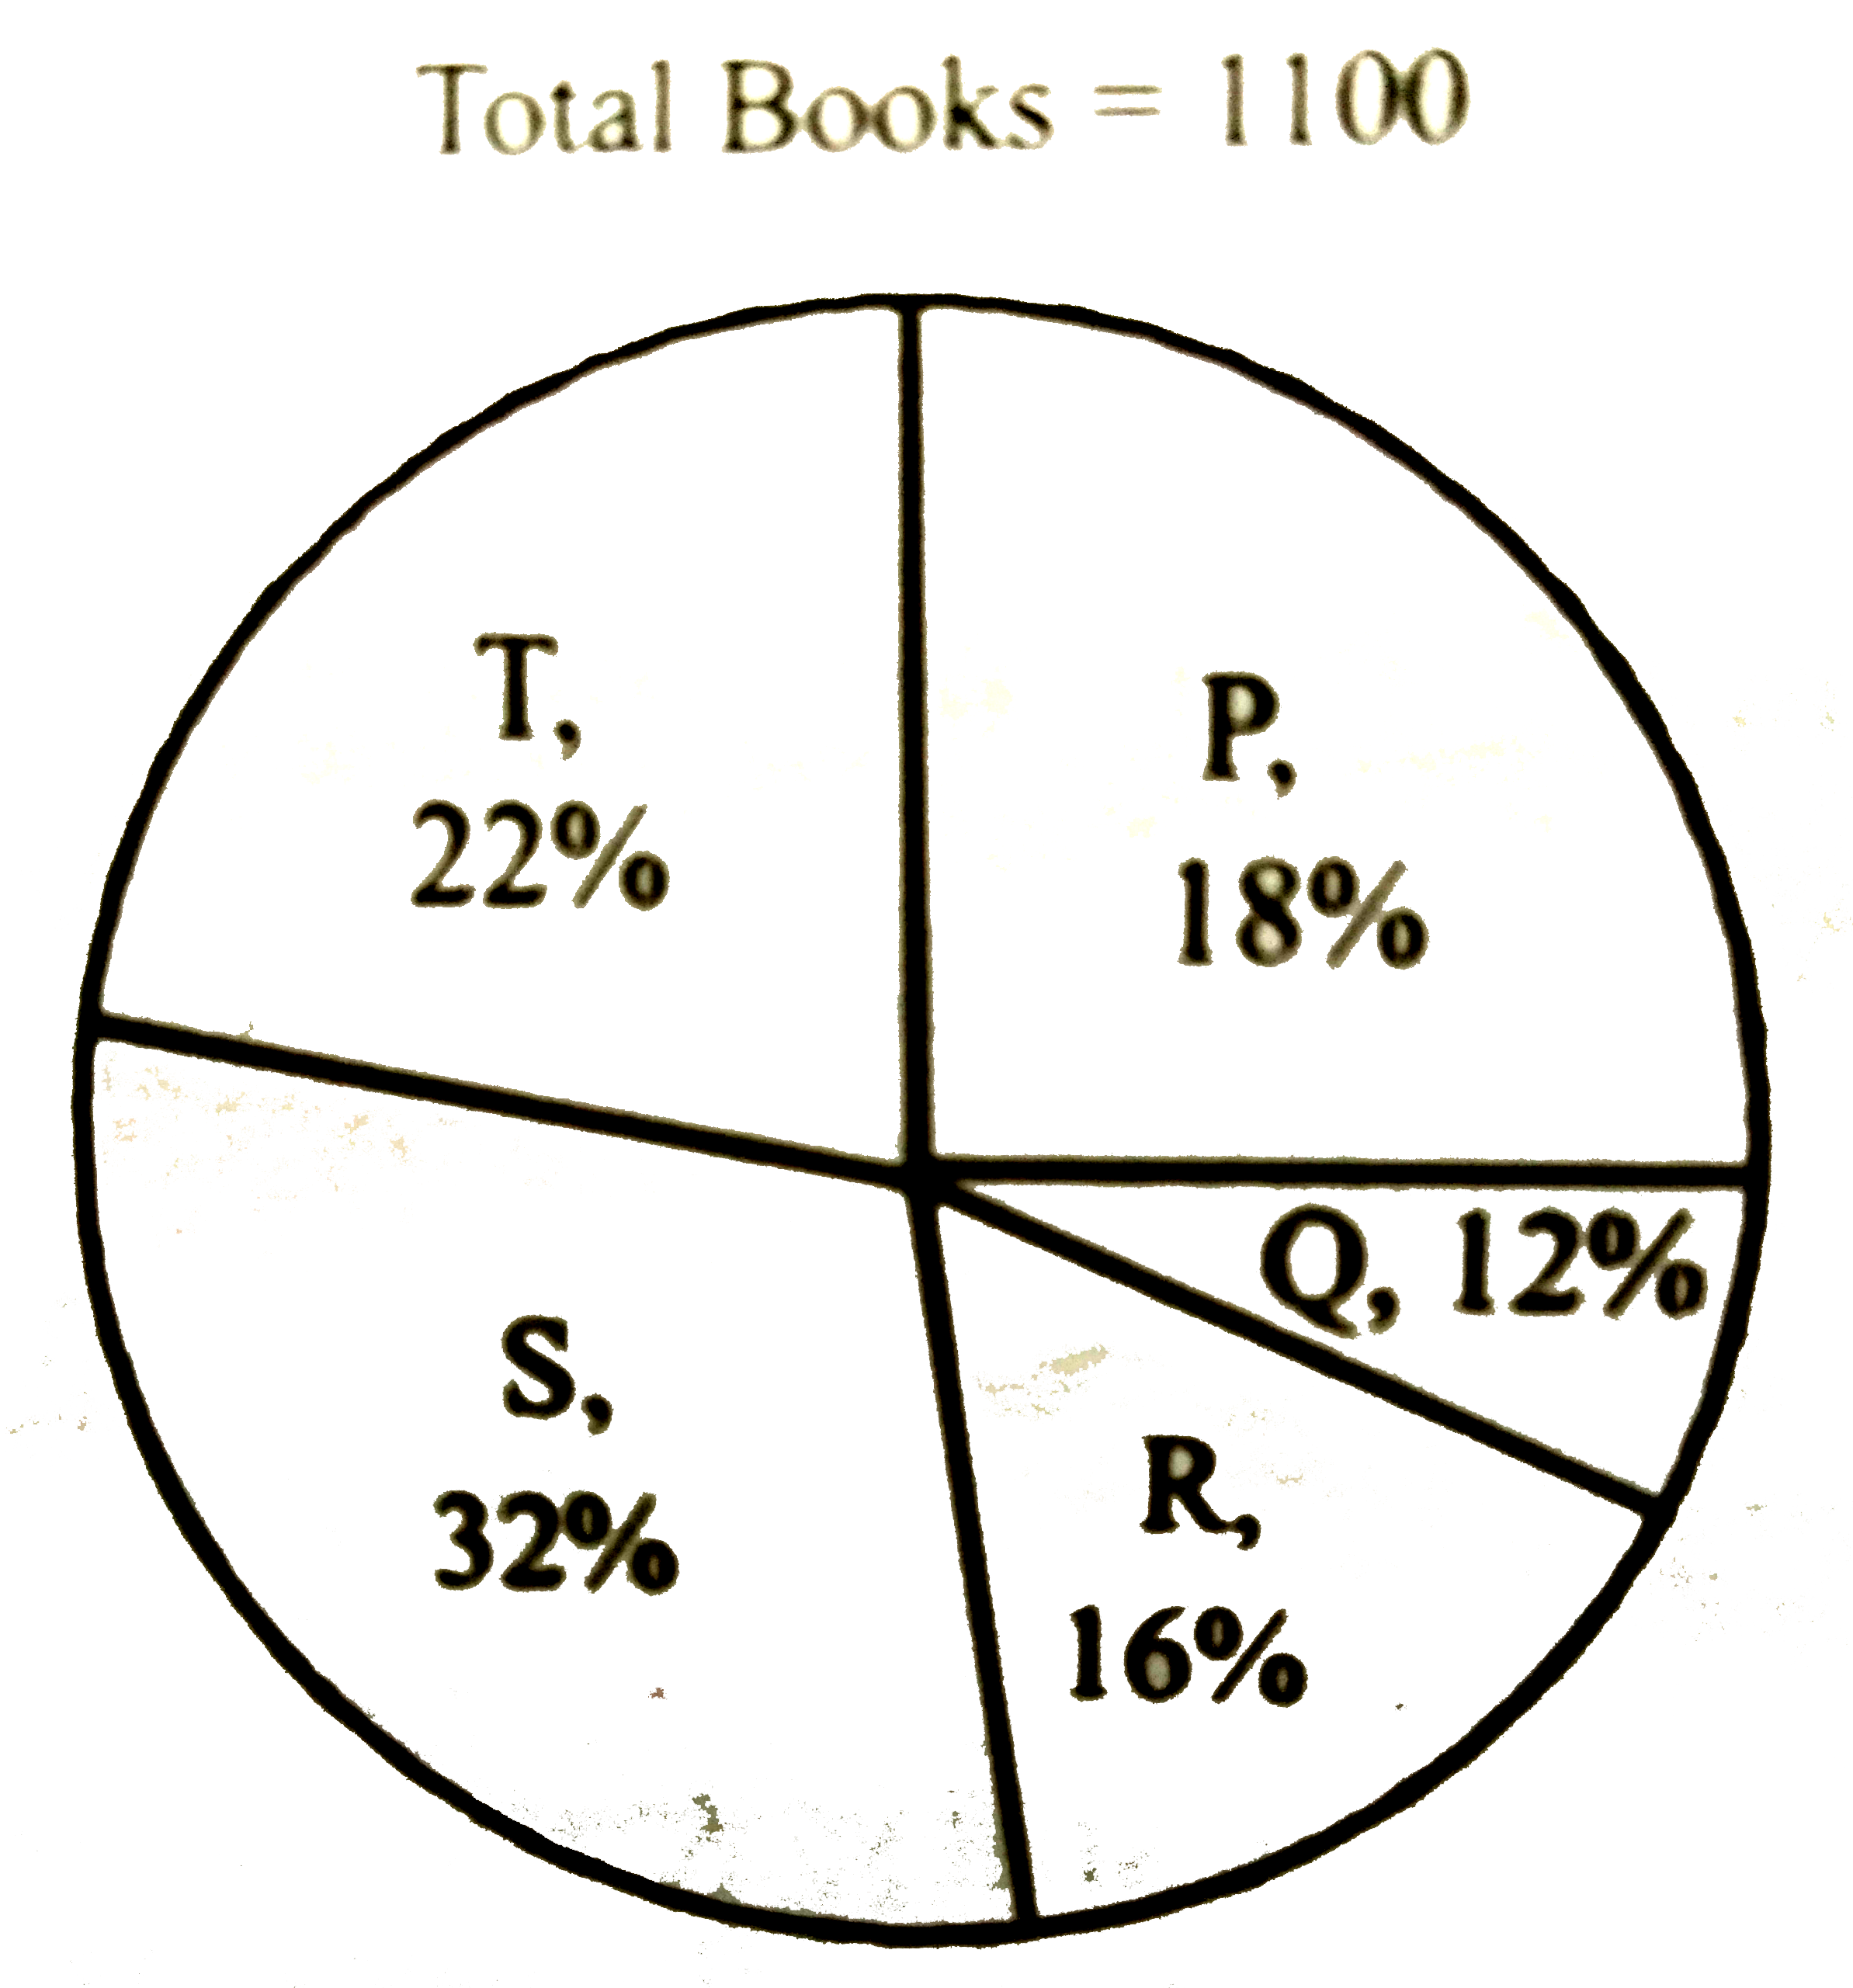
What is the ratio of total books sold by store P and R together to the total books sold by store S and T togetherView Solution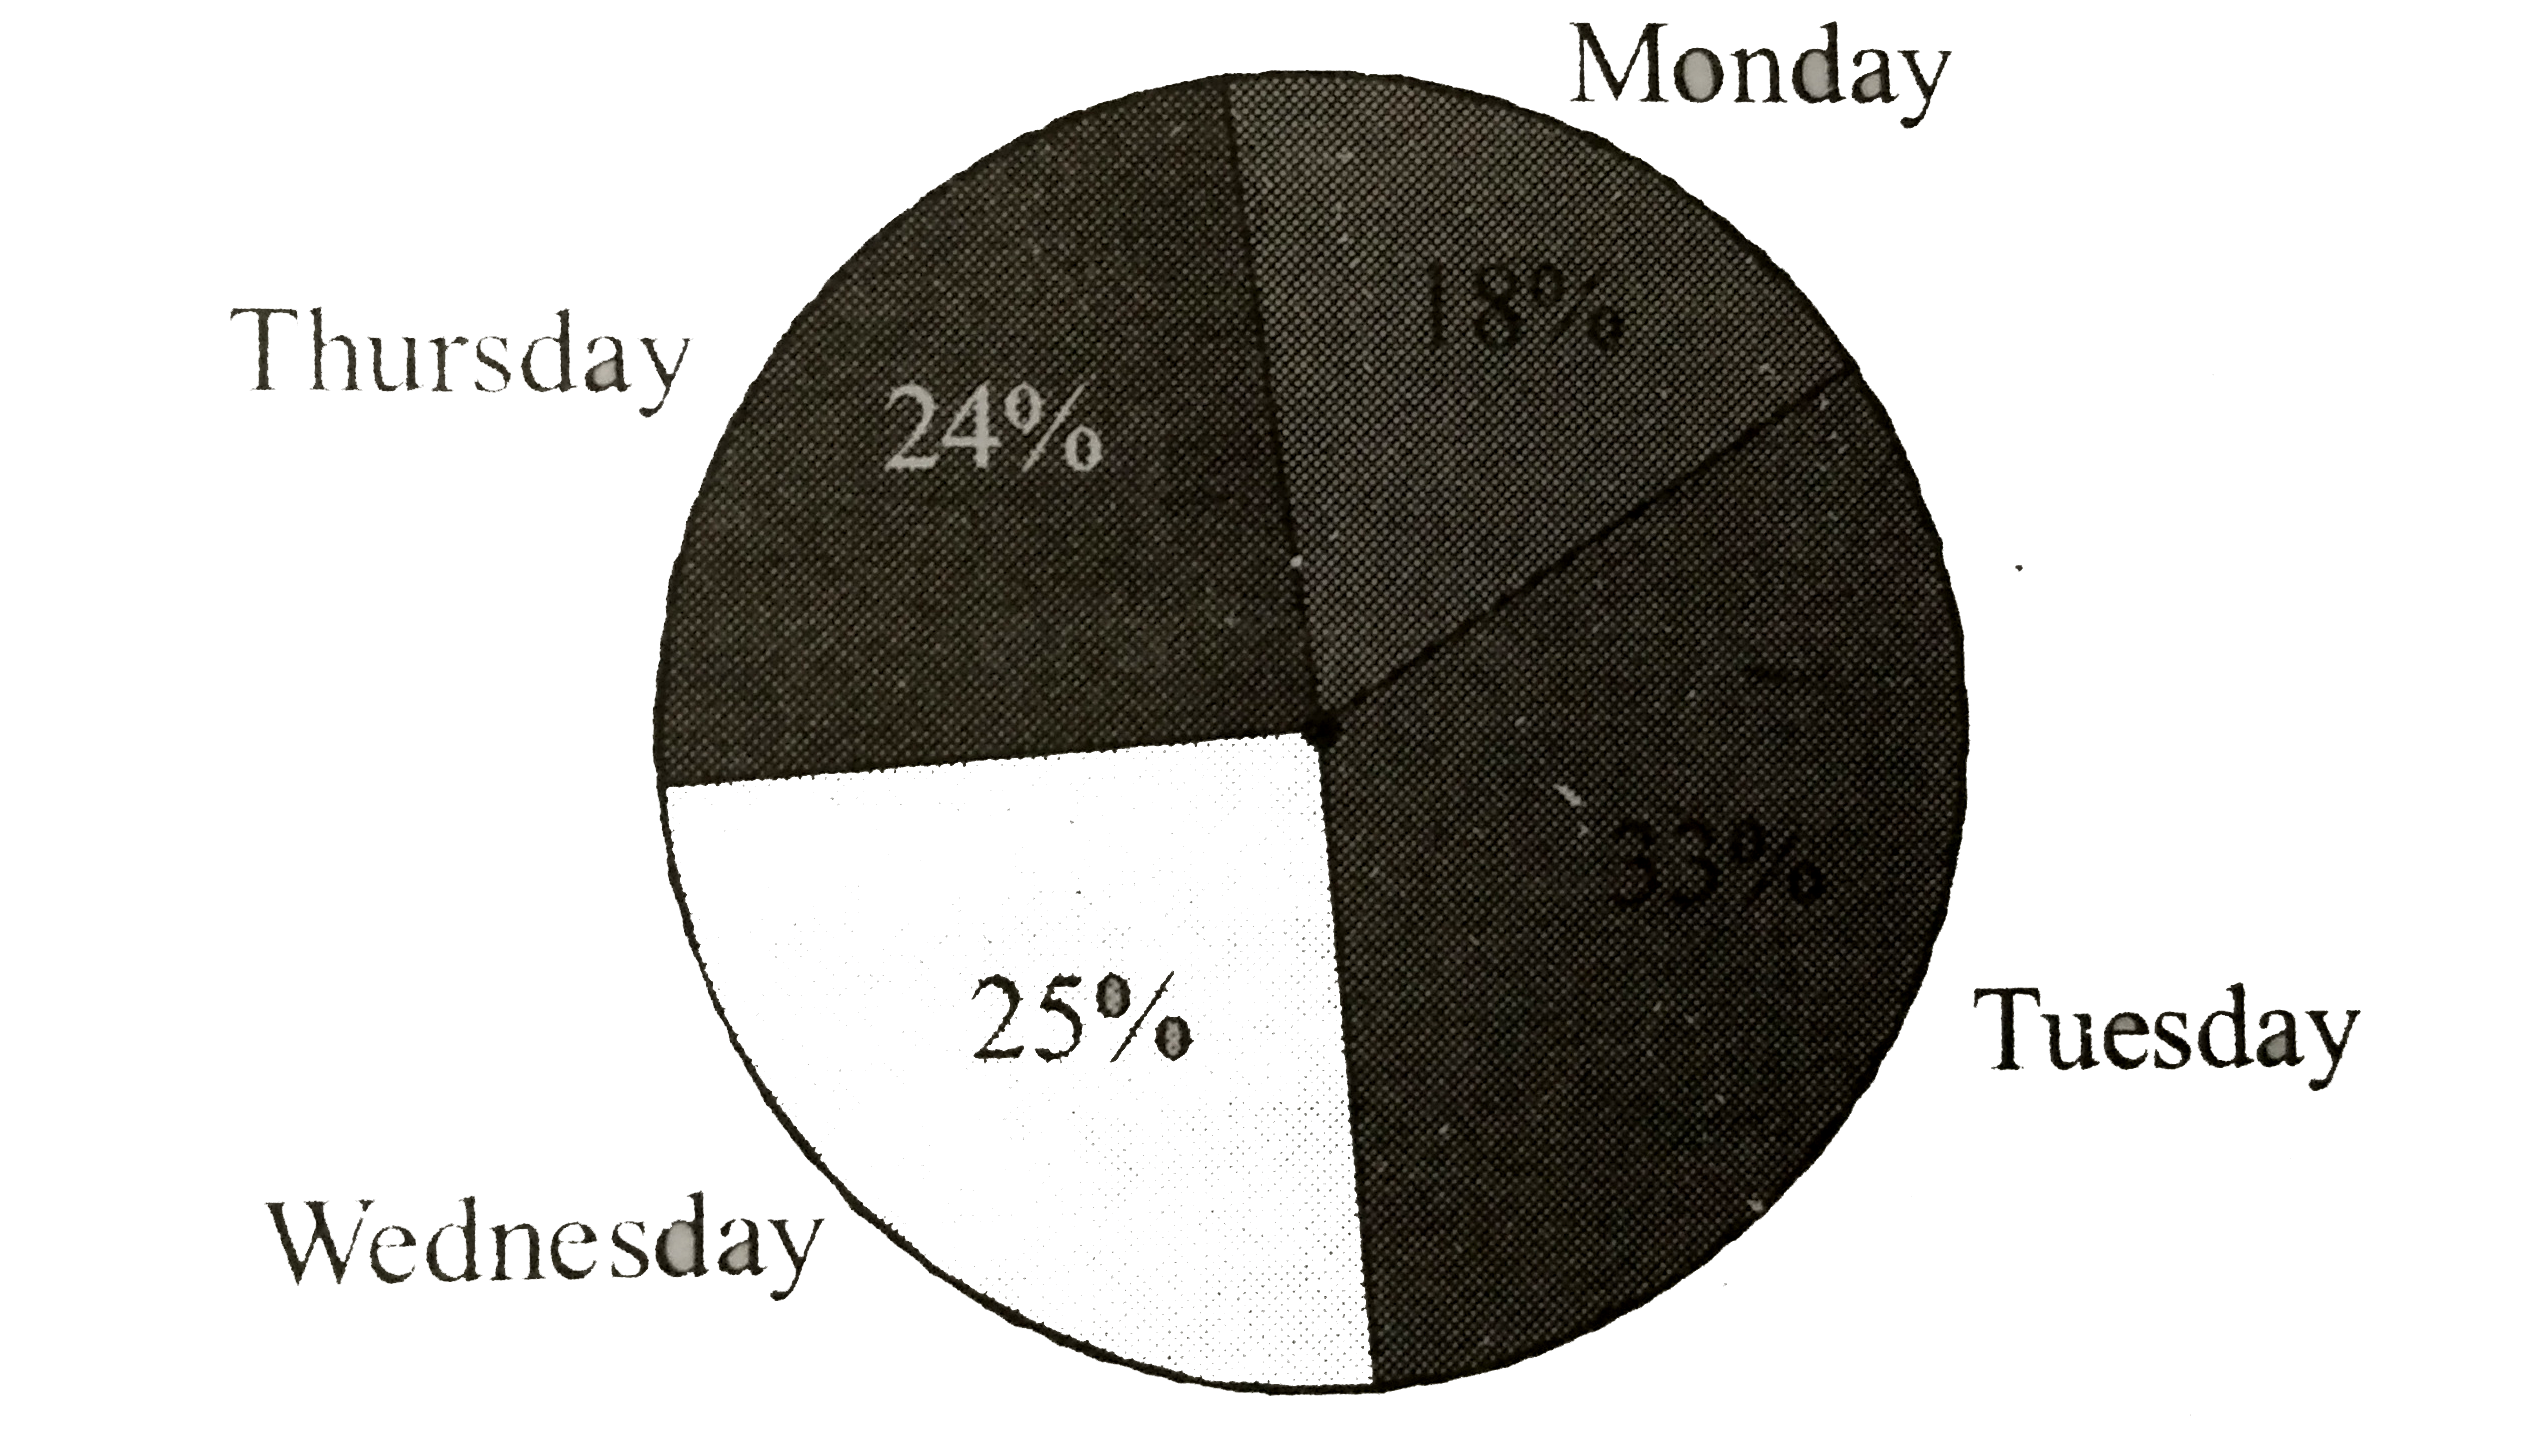
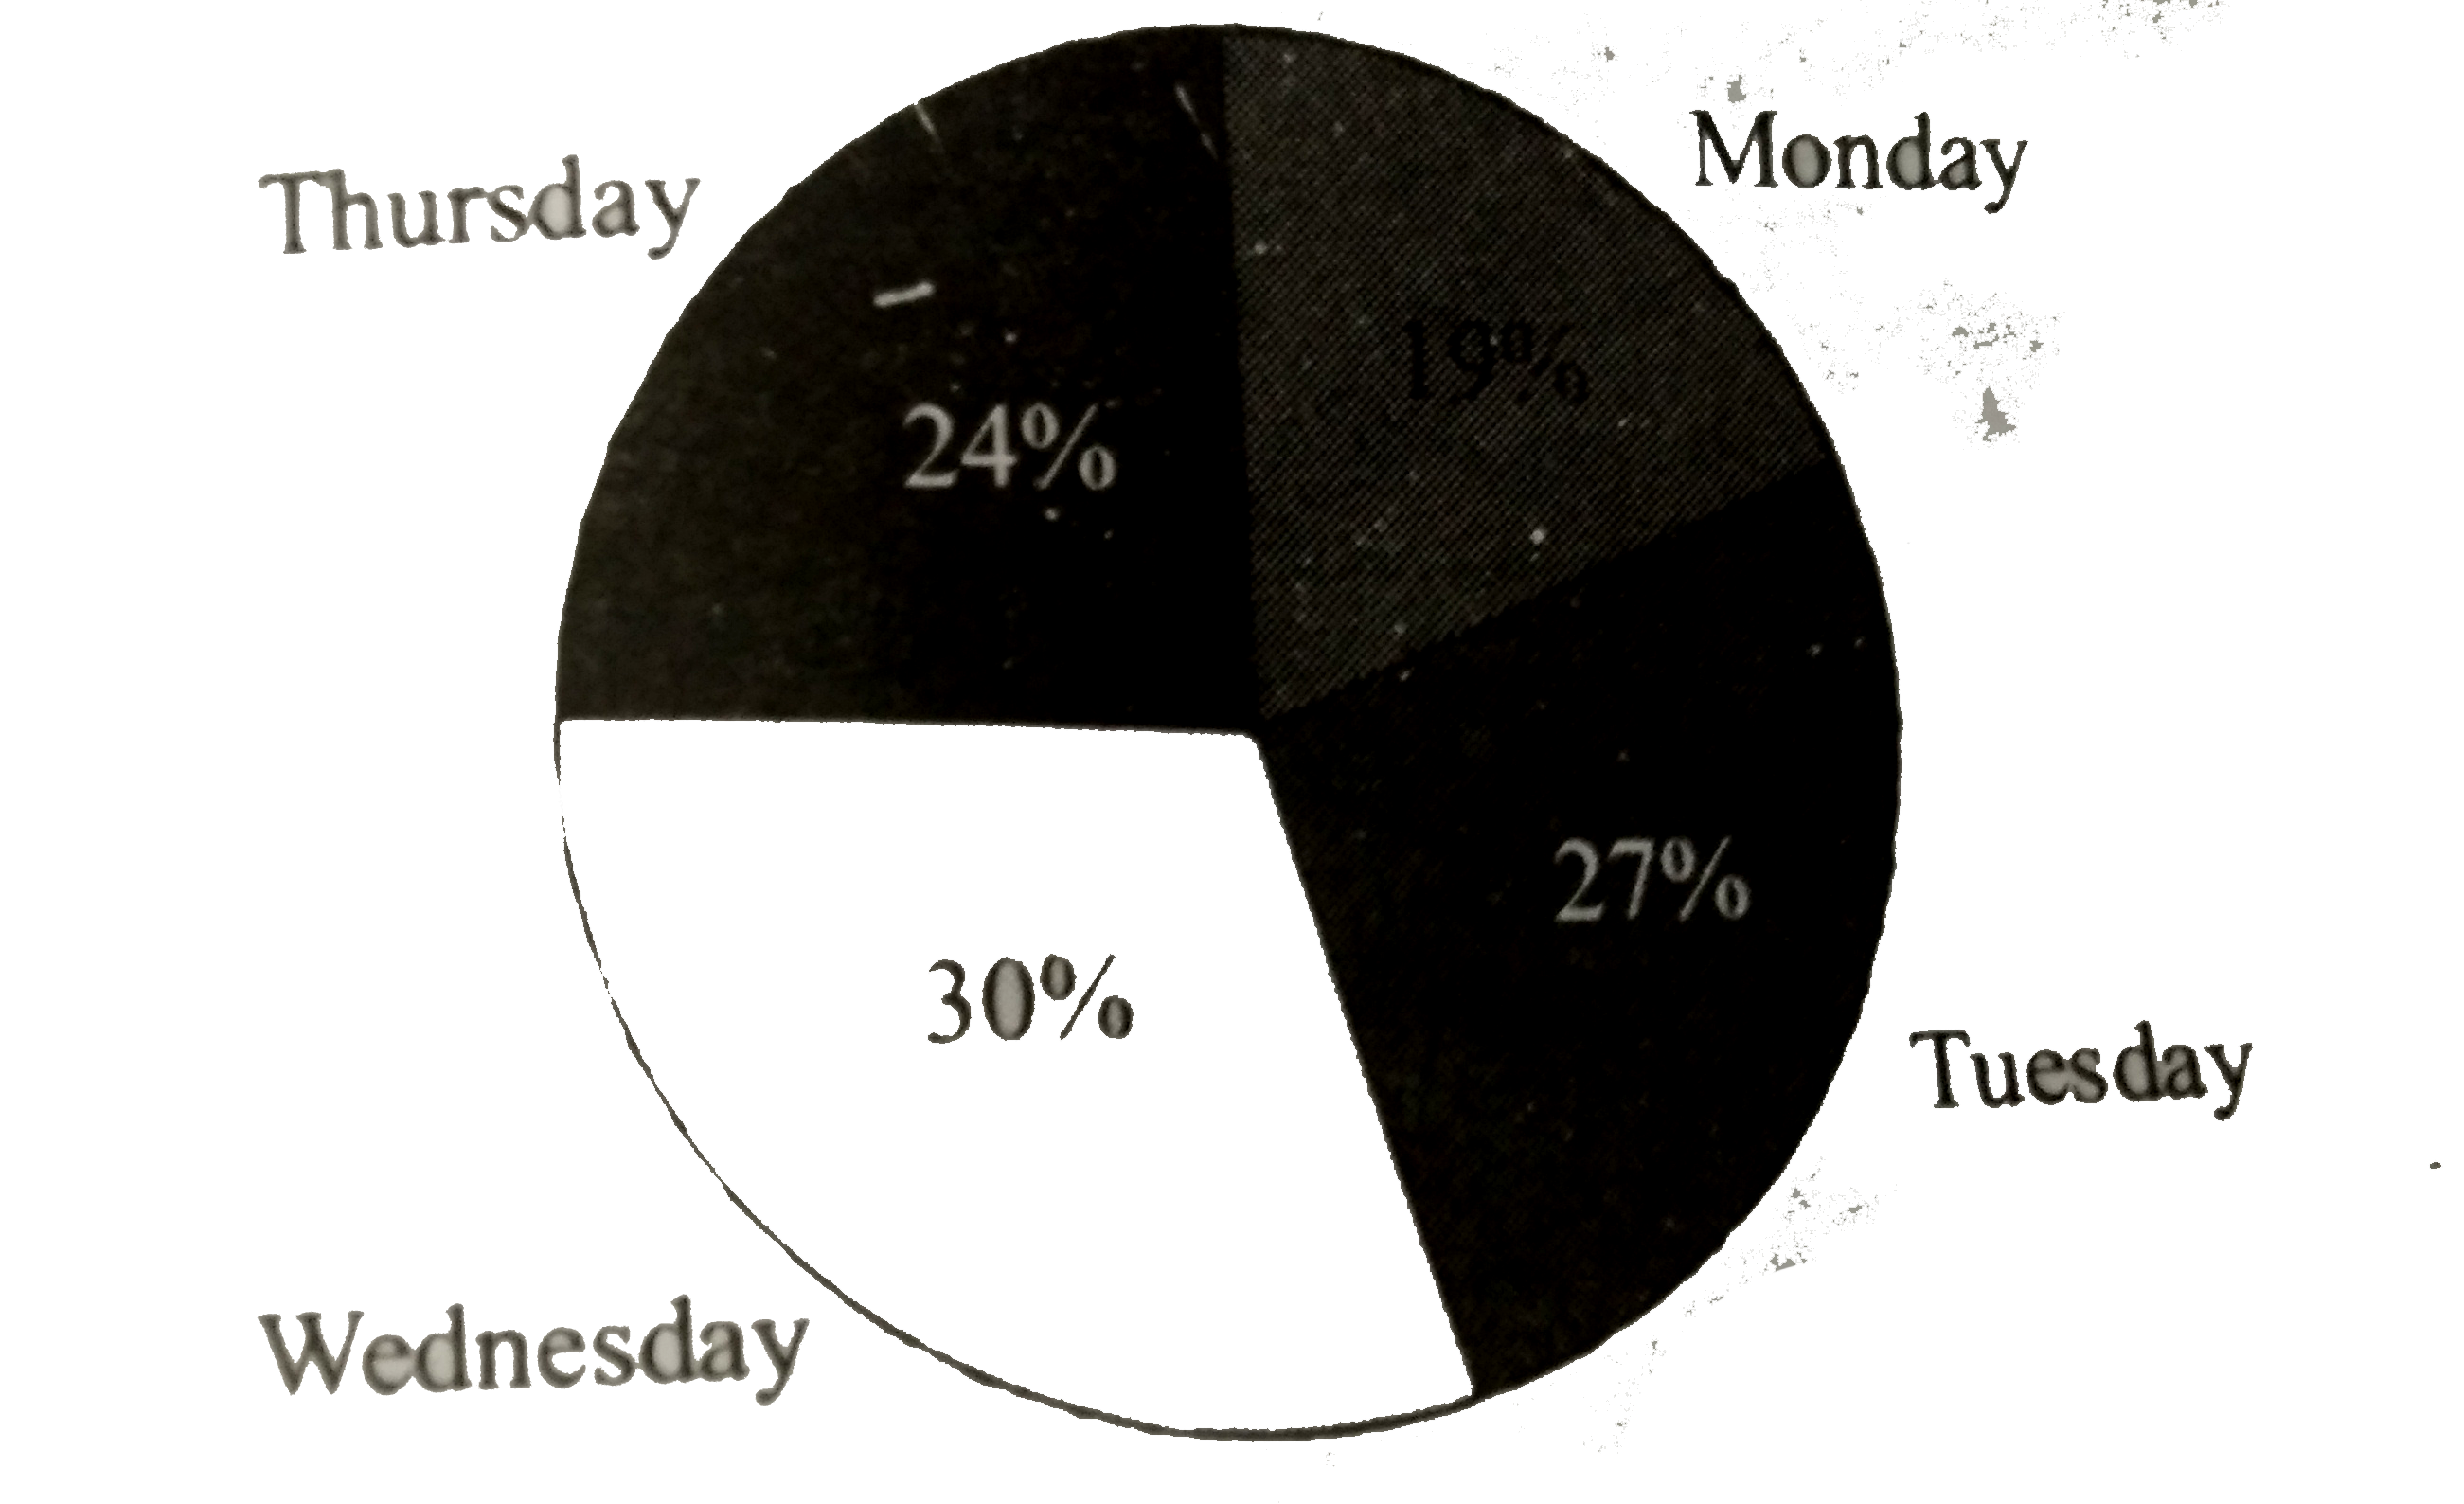
Find the ratio of (Books + Magazines ) sold on Tuesday to that of the Magazines sold on Thursdays ?View SolutionThe given table represents the sale (in thousands) of cars by four companies A,B,C and D in six years. Study the table and answer the questions that follow:
दी गयी तालिका चार कंपनियों - A, B, C और D के द्वारा छः वर्षों में की गयी कारों की बिक्री ( हज़ार में ) दर्शाती है | इस तालिका का अध्ययन करें तथा फिर पूछे गए प्रश्नों के उत्तर दें |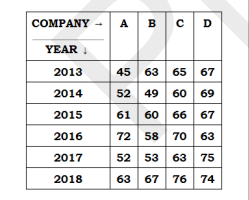 What is the ratio of total number of cars sold by companies A,B and D in 2017 to the total number
of cars sold by all companies in 2018?
कंपनी A, B और D के द्वारा 2017 में बेची गयी कारों की कुल संख्या तथा 2018 में सभी कंपनियों के द्वारा बेची गयी कारों की कुल संख्या के बीच क्या अनुपात है ?View SolutionWhat is the respective ratio of total number of N and L type products together sold by store D and the same products sold by store A?
View Solution


