Study the below mentioned charts carefully and answer the following questions.
Pie chart shows the percentage distribution of students of a school playing different sports and table chart shows the ratio of boys and girls who are playing these sports.
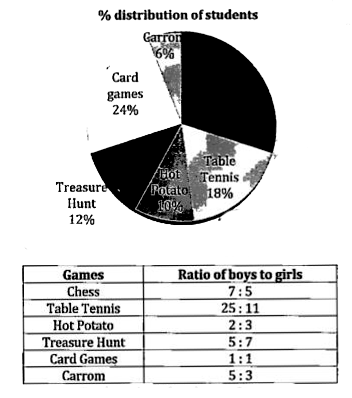
Find the central angle (in degrees), enclosed by boys playing Treasure Hunt.
18
8.5
9.75
10
The correct Answer is:A
Step by step video, text & image solution for Study the below mentioned charts carefully and answer the following questions. Pie chart shows the percentage distribution of students of a school playing different sports and table chart shows the ratio of boys and girls who are playing these sports. Find the central angle (in degrees), enclosed by boys playing Treasure Hunt. by Maths experts to help you in doubts & scoring excellent marks in Class 14 exams.
Updated on:21/07/2023Topper's Solved these Questions
- DATA INTERPRETATIONBOOK - ADDA247CHAPTER - DATA INTERPRETATIONEXERCISE - Mains Questions
33 Videos
- DATA INTERPRETATIONBOOK - ADDA247CHAPTER - DATA INTERPRETATIONEXERCISE - Previous Year Questions
56 Videos
- DATA INTERPRETATIONBOOK - ADDA247CHAPTER - DATA INTERPRETATIONEXERCISE - Prelims Questions (Level-1)
54 Videos
- BOAT AND STREAM BOOK - ADDA247CHAPTER - BOAT AND STREAM EXERCISE - Previous Year Question
22 Videos
- DATA SUFFICIENCY BOOK - ADDA247CHAPTER - DATA SUFFICIENCY EXERCISE - PREVIOUS YEAR QUESTIONS
25 Videos
Similar Questions
Following pie chart shows the degree wise distribution of the students of a school using different transport while going to school. Read the chart answer the questions carefully.
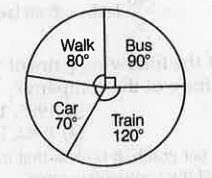
Total number of students = 2160
Find the ratio of number of students who come to school by bus and that of by car.
View SolutionFollowing pie chart shows the degree wise distribution of the students of a school using different transport while going to school. Read the chart answer the questions carefully.
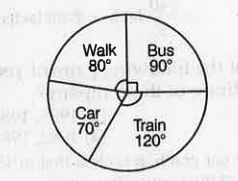
Total number of students = 2160
The number of students who come to school by car, is
View Solution
Knowledge Check
Study the Pie chart carefully and answer the questions.
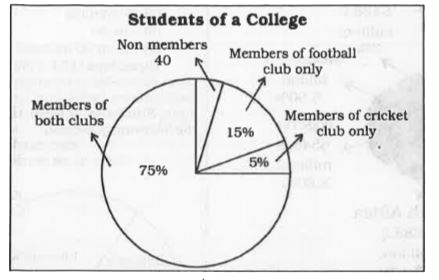
Percentage of students who are not members of any club is :A5%B8%C10%D6%Study the Pie chart carefully and answer the questions.
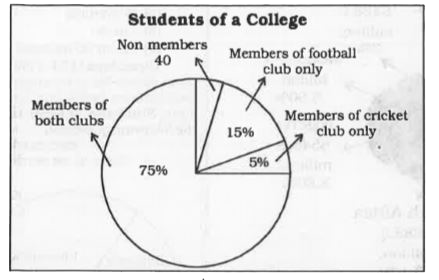
The number of students who are members of both the club is :A500B650C550D600Study the Pie chart carefully and answer the questions.
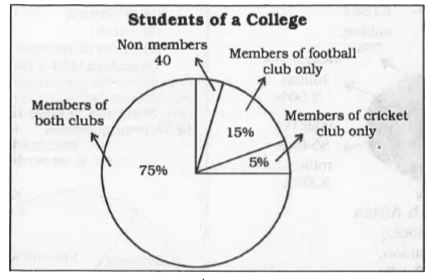
Number of students who are members of cricket club only :A35B40C42D41
Direction: Read the following table carefully and answer the questions given below:- The given the table is showing the number of students in different school:-
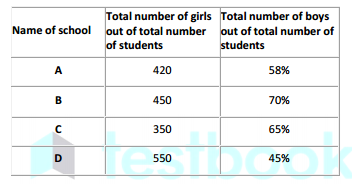
Find the ratio between the total number of boys in school D and the total number of girls in school A.
View SolutionStudy the following pie chart carefully and answer the questions. The pie chart represents the percentage of people involved in various occupations.

The ratio of the people involved in service to that in industry is
View SolutionStudy the following Pie-Chart carefully to answer the questions given below.
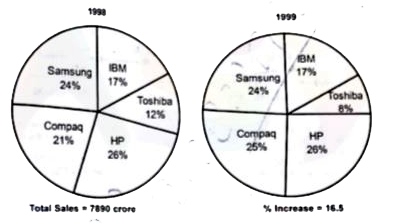
The percentage increase/decrease in the sales of Toshiba in 1999 is approximately-
View SolutionStudy the following pie chart carefully and answer the questions. The pie chart represents the percentage of people involved in various occupations.

The angle made by the people involved in service in the given pie-chart is
View SolutionThe following pie-chart shows the percentage distribution of the expenditure incurred in publishing a book. Study the pie-chart and answer the questions based on it.

Royalty on the book is less than the paper cost by :
View Solution
