Study the below mentioned line chart carefully and answer the following questions.
Linę chart shows the units produced (in units) and units sold (in %) by 5 different companies in a given year.
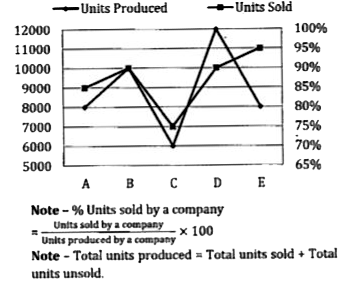
Find unsold units of company.A & C together is what percent of sold units of company-D?
20%
10%
30%
25%
The correct Answer is:D
Step by step video, text & image solution for Study the below mentioned line chart carefully and answer the following questions. Linę chart shows the units produced (in units) and units sold (in %) by 5 different companies in a given year. Find unsold units of company.A & C together is what percent of sold units of company-D? by Maths experts to help you in doubts & scoring excellent marks in Class 14 exams.
Topper's Solved these Questions
- BOOK - ADDA247CHAPTER - DATA INTERPRETATIONEXERCISE - Mains Questions33videos
DATA INTERPRETATION
- BOOK - ADDA247CHAPTER - DATA INTERPRETATIONEXERCISE - Previous Year Questions56videos
DATA INTERPRETATION
- BOOK - ADDA247CHAPTER - DATA INTERPRETATIONEXERCISE - Prelims Questions (Level-1)54videos
DATA INTERPRETATION
- BOOK - ADDA247CHAPTER - BOAT AND STREAM EXERCISE - Previous Year Question22videos
BOAT AND STREAM
- BOOK - ADDA247CHAPTER - DATA SUFFICIENCY EXERCISE - PREVIOUS YEAR QUESTIONS25videos
DATA SUFFICIENCY
Similar Questions
Study the following graph carefully to answer the questions given below. Expenditure in lakhs) of three different Companies in Five Different Years
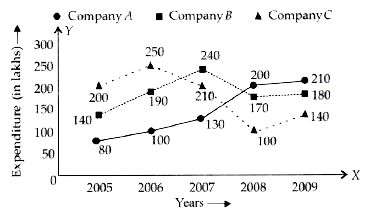
Total expenditure of all the three companies together in the year 2006 was what Percentage of the total expenditure of Company A over all the years together?View SolutionDirections: Study the Pie chart and answer the following question. The pie chart is showing the percentage of different types of shirts sold by five different stores namely A, B, C, D and E.
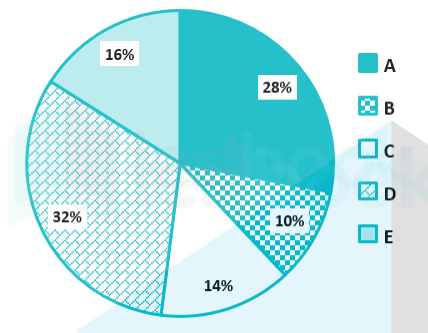
Find the average of shirt sold by store D and E, if the shirt sold by E is 256View Solution
Knowledge Check
- Question 1 - Select One
Study the following graph carefully to answer the questions given below.
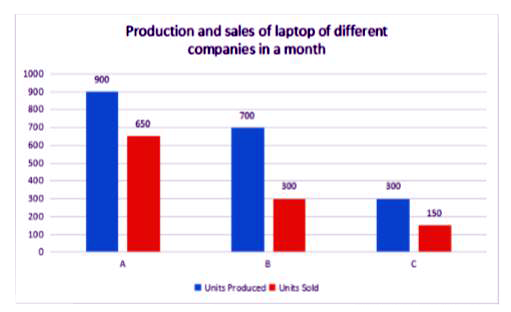
What is the average number of Units produced by all the Companies together?A62513B63313C63323D62313 - Question 2 - Select One
Study the bar chart given below and answer the following questions :
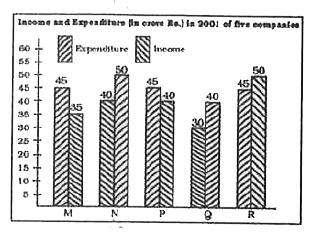
The company earning the maximum percentage of profit in the year 2001 is :AQBMCNDP - Question 3 - Select One
Study the table carefully to answer the following questions ----
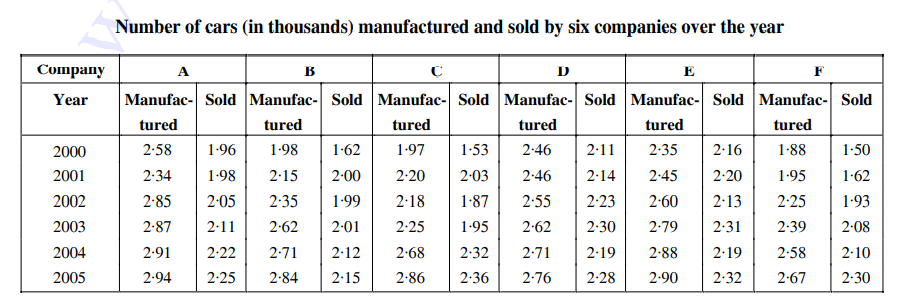
What is the approximate percent increase in the number of cars sold by company F in the year 2004 from the previous year ?A13B19C0.96D8
Study the following table chart carefully and answer the questions below:
The chart shows the number of employees in various departments in 5 companies.

Find the average number of employees from the technical department hired by all companies taken together.View SolutionStudy the bar chart given below and answer the following questions :
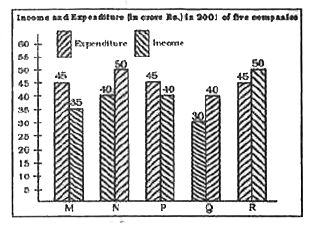
The companies M and N together had a percentage of profit/loss of :View SolutionStudy the table carefully to answer the questions that follow-
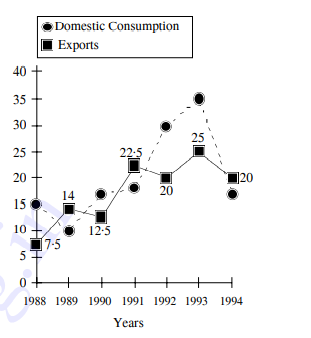
What is the approximate average number of units sold in the year 1999?View SolutionRead the following graph carefully and answer the questions given below.
Production of sugar in three different factories over years (in thousand tonnes)
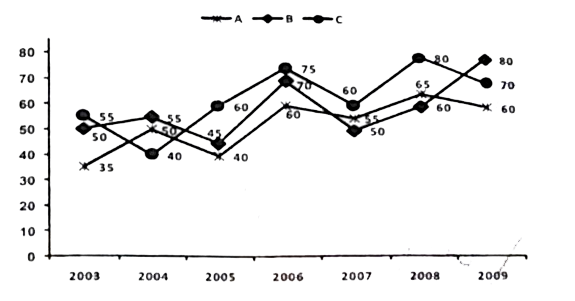
The average production of company A is approximately what percent of average production of company C ?View SolutionStudy the following graph carefully to answer the questions given below.
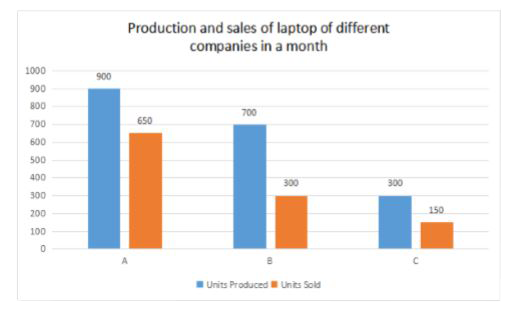
What is the average number of Units of laptop sold by all the Companies together?View Solution

