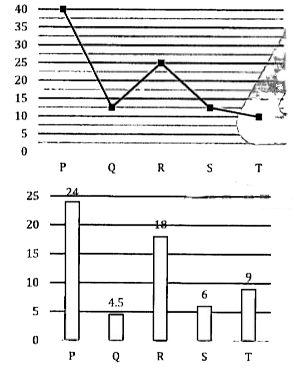
Line graph given below shows percentage of a tank filled by each pipe and bar graph shows hours taken by each pipe to do fill that part of tank.

Pipe Pand pipe T Start filling the tank together and fill it for 't' hours after that both pipes replaced by R and S, who fill for next (t + 2) hours and 509% of total tank still unfilled. If pipe A can fill with the efficiency of (t + 2) unit/hours, then find the time taken by pipe A to fill tank alone?
36 hours
24 hours
30 hours
45 hours
The correct Answer is:D
Topper's Solved these Questions
- DATA INTERPRETATIONBOOK - ADDA247CHAPTER - DATA INTERPRETATIONEXERCISE - Previous Year Questions
56 Videos
- DATA INTERPRETATIONBOOK - ADDA247CHAPTER - DATA INTERPRETATIONEXERCISE - Prelims Questions (Level-2)
59 Videos
- BOAT AND STREAM BOOK - ADDA247CHAPTER - BOAT AND STREAM EXERCISE - Previous Year Question
22 Videos
- DATA SUFFICIENCY BOOK - ADDA247CHAPTER - DATA SUFFICIENCY EXERCISE - PREVIOUS YEAR QUESTIONS
25 Videos
Similar Questions
Knowledge Check
If one pipe A can fill a tank in 20 minutes, then 5 pipes, each of 20% efficiency of A, can fill the tank in :
A80 minB100 minC20 minD25 minA pipe can fill a tank in 'x hours and another pipe can empty it in 'y' (y>x) hours. If both the pipes are open, in how many hours will the tank be filled ?
Axyy−x hoursBx-y hoursCy-x hoursDxyx−y hoursPipe X can fill a tank in 12 hours and pipe Y can fill the same tank in 36 hours. In how manyhours both pipe X and pipe Y together can fill one-third part of the tank?
A9 hoursB3 hoursC15 hoursD27 hours
A pipe Can fill a tanke in 10 hours. The other pipe can fill a tank in 15 hours. How much time will they take to fill that tank together.
View SolutionPipe A fills a tank at 50m3/hour. Pipe B takes 4 hours to fill the tank. When opened together, they fill the tank in 2 hours. What is the volume of the tank ?
View SolutionPipes A and B can together fill a tank in 20 hours and pipe C can empty 40% of the tank in 20 hours. Find the time taken by all the 3 pipes together to fill 60% of the tank.
View Solutionif one pipe A can fill a tank in 20 minutes, then 5 pipes, each of 20% efficiency of A, can fill the tank.in .
View SolutionTwo pipes A and B can fill a tank 45 minutes. If pipe A can fill an empty tank in 1 hour, how long will it take pipe B to fill the empty tank?
दो पाइप A तथा B किसी टंकी को 45 मिनट में भर सकते हैं | यदि पाइप A खाली टंकी को 1 घंटे में भर सकता है, तो इस खाली टंकी को भरने में पाइप B को कितना समय लगेगा ?
View Solution
