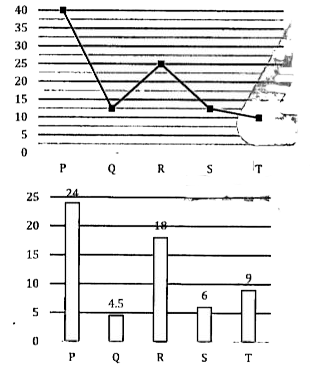
Line graph given below shows percentage of a tank filled by each pipe and bar graph shows hours taken by each pipe to do fill that part of tank.

If for first 15 hours pipe P start filling with its 25% less efficiency and pipe S fill the tank with 33% more its efficiency together and remaining tank filled by another pipe B in 57 hours. Find in how much time pipe B can fill the tank alone?
102 hours
128 hours
108 hours
144 hours
The correct Answer is:D
Topper's Solved these Questions
- DATA INTERPRETATIONBOOK - ADDA247CHAPTER - DATA INTERPRETATIONEXERCISE - Previous Year Questions
56 Videos
- DATA INTERPRETATIONBOOK - ADDA247CHAPTER - DATA INTERPRETATIONEXERCISE - Prelims Questions (Level-2)
59 Videos
- BOAT AND STREAM BOOK - ADDA247CHAPTER - BOAT AND STREAM EXERCISE - Previous Year Question
22 Videos
- DATA SUFFICIENCY BOOK - ADDA247CHAPTER - DATA SUFFICIENCY EXERCISE - PREVIOUS YEAR QUESTIONS
25 Videos
Similar Questions
Knowledge Check
6 Pipes can fill a tank in 1 hour 24 minutes, pipes can fill the same tank in :
A60 minutesB66 minutesC72 minutesD78 minutesPipe C can fill a tank in 12 hours and pipe D can fill the same tank in 40 hours. In how many hours both pipe C and D together can fill the same tank?
AA) 607 hoursBB) 6011 hoursCC) 12013 hoursDD) 12011 hoursIf one pipe A can fill a tank in 20 minutes, then 5 pipes, each of 20% efficiency of A, can fill the tank in :
A80 minB100 minC20 minD25 min
If a pipe can fill a tank in x hours: then part filled in 1 hour.
View SolutionA pipe Can fill a tanke in 10 hours. The other pipe can fill a tank in 15 hours. How much time will they take to fill that tank together.
View SolutionPipe X can fill a tank in 12 hours and pipe Y can fill the same tank in 36 hours. In how manyhours both pipe X and pipe Y together can fill one-third part of the tank?
View SolutionA pipe can fill an empty tank in 8 h. After it is kept open for 2 h, another pipe which can fill the tank in 6 h is opened. In how many more hours will the tank be filled?
View SolutionA pipe can fill an empty tank in 8 h. After it is kept open for 2 h, another pipe which can fill the tank in 6 h is opened. In how many more hours will the tank be filled?
View Solution
