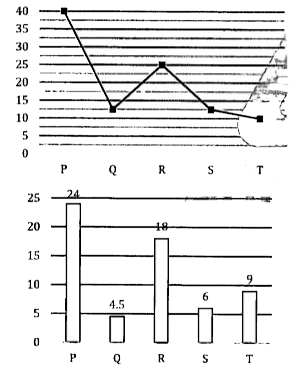
Line graph given below shows percentage of a tank filled by each pipe and bar graph shows hours taken by each pipe to do fill that part of tank.

Pipe Q and T start filling tank alternatively starting with pipe Q and fill the tank for 25 hours, after that both pipe are replaced by pipe P and R and both pipe start filling alternatively starting with pipe R. Find in how much time remaining tank will be filled?
2816 hours
3316 hours
4613 hours
3816 hours
The correct Answer is:B
Topper's Solved these Questions
- DATA INTERPRETATIONBOOK - ADDA247CHAPTER - DATA INTERPRETATIONEXERCISE - Previous Year Questions
56 Videos
- DATA INTERPRETATIONBOOK - ADDA247CHAPTER - DATA INTERPRETATIONEXERCISE - Prelims Questions (Level-2)
59 Videos
- BOAT AND STREAM BOOK - ADDA247CHAPTER - BOAT AND STREAM EXERCISE - Previous Year Question
22 Videos
- DATA SUFFICIENCY BOOK - ADDA247CHAPTER - DATA SUFFICIENCY EXERCISE - PREVIOUS YEAR QUESTIONS
25 Videos
Similar Questions
Knowledge Check
Two pipes A and B can fill an empty tank in 8 hours and 12 hours respectively they are opened alternately for 1 hour each starting with pipe A first in how many hours will the empty tank will be filled?
A(9)1/4B9C(9)1/3D(9)1/2Two pipes A and B can fill an empty tank in 10 hours and 16 hours respectively. They are opened alternately for 1 hour 30 each, starting with pipe A first. In how many hours, the empty tank will be filled?
A1213B1218C1214D1216Pipe A can fill a tank in 12 hours and Pipe B can fill the tank in 18 hours. If both the pipes are opened on alternate hours and if pipe B is opened first, then in how much time (in hours) the tank will be full?
A1413B1713C1412D1612
Two pipes A and B can fill an empty tank in 10 hours and 16 hours respectively. They are opened alternatively for 1 hour each, starting with pipe A first. In how many hours, the empty tank will be filled?
दो पाइप A और B किसी खाली टंकी को क्रमशः 10 घंटे एवं 16 घंटे में भर सकते हैं | A से शुरुआत करते हुए उन्हें एक-एक करके हर बार 1 घंटे के लिए खोला जाता है | कितने घंटों में खाली टंकी भर जायेगी ?
View SolutionTwo pipes can fill a tank in 10 hours and 12 hours respectively. While a third pipe empted the full tank in 20 hours. If all the three pipes operate simultaneously, in how much time the tank will be filled ?
View SolutionTwo pipes A and B can fill a tank in 16 hours and 20 hours respectively. They are opened alternatively for 1 hour each, starting with pipe A first. In how many hours with the empty tank be filled ?
दो पाइप A और B किसी टंकी को क्रमशः 16 और 20 घंटे में भर सकते हैं | पाइप A से शुरुआत करते हुए उन्हें 1 घंटे के लिए एक के बाद एक करके खोला जाता है | खाली टंकी कितने घंटों में भर जायेगी ?
View SolutionPipe X can fill a tank in 20 hours and Plpe Y can fill the tank in 35 hours. Both the pipes are opened on alternate hours. Plpe Y is opened first, then in how much time (in hours) the tank will be full?
View SolutionPipe X can fill a tank in 12 hours and pipe Y can fill the same tank in 36 hours. In how manyhours both pipe X and pipe Y together can fill one-third part of the tank?
View Solution
