Table given below shows number of orders received by three (P, Q & R) companies of their three (A, B &C) items. Read the data carefully and answer the questions.

Find ratio of total orders of item A & B received by P to total orders of item B & C received by Q?
7:9
8:7
4:7
7:8
The correct Answer is:D
Step by step video & image solution for Table given below shows number of orders received by three (P, Q & R) companies of their three (A, B &C) items. Read the data carefully and answer the questions. Find ratio of total orders of item A & B received by P to total orders of item B & C received by Q? by Maths experts to help you in doubts & scoring excellent marks in Class 14 exams.
Updated on:21/07/2023Topper's Solved these Questions
Similar Questions
The line graph given below shows the number of text messages received by Keerthi during a week. Study The graph carefully and answer the questions that follow.
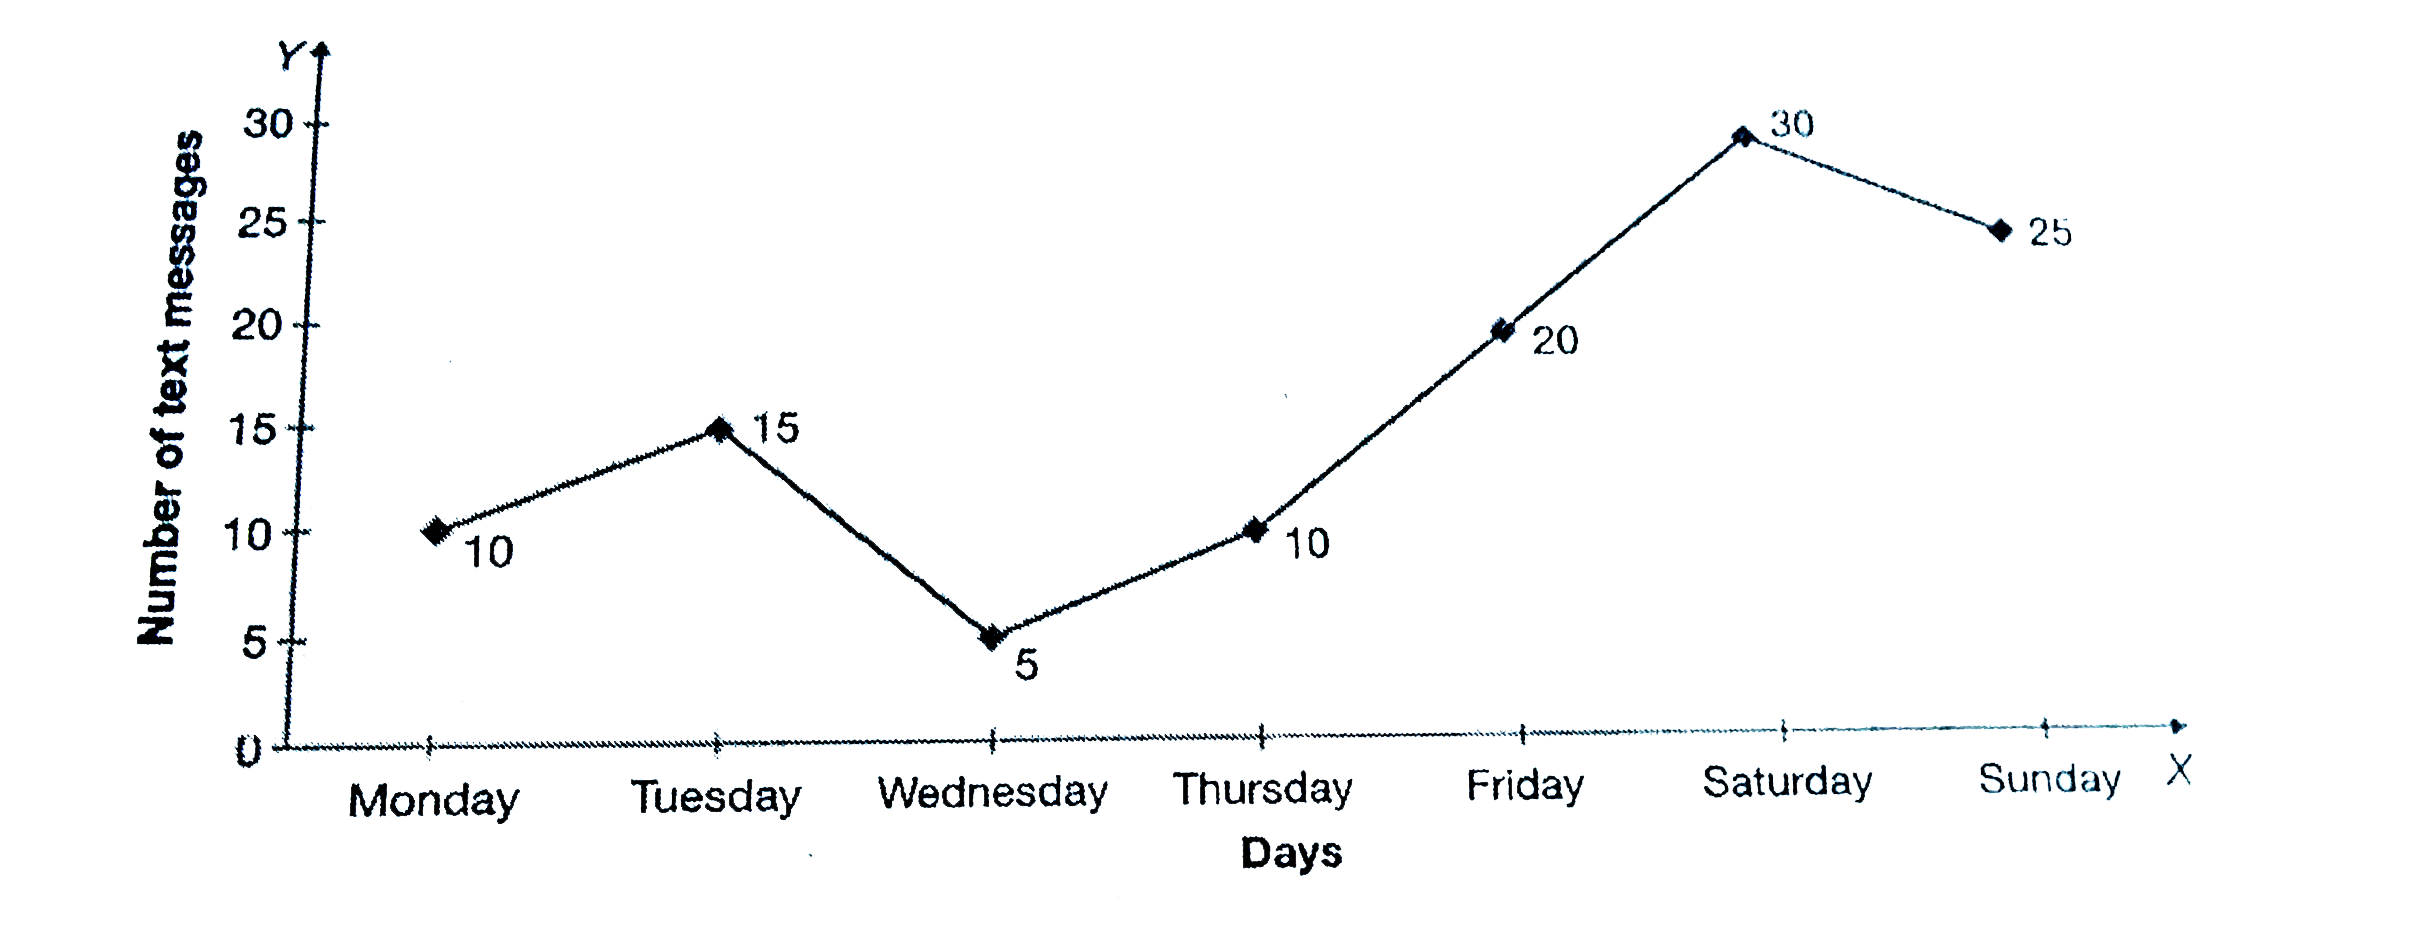
(i) On which day did Keerthi receive exactly 20 text message ?
(iii) Find the total number of text messages received by Keerthi in week.
View SolutionPie chart given below shows total number of workers in three different companies. Table given below shows ratio between officers and workers working in these companies. Study the data carefully and answer the following questions
Total workers =900
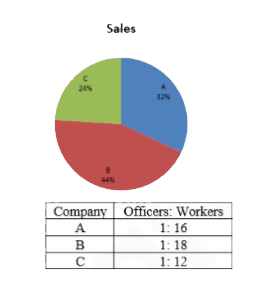
Note: total employees = officers + workers
Find the difference between total number of workers in company ‘A’ and total number of workers in company ‘B’ and ‘C’ together?
View Solution
Knowledge Check
Study the following graph carefully to answer these questions-
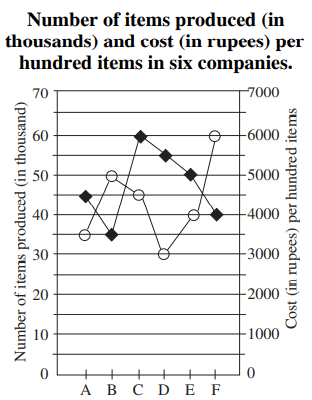
What is the total cost of items produced by companies A and B together?ARs. 17⋅50 lakhBRs. 33⋅25 lakhCRs. 15⋅70 lakhDRs. 32⋅75 lakhDirection: The given table represents the number of engineers recruited by four companies A, B, C and D over the years. Study the table carefully and answer the question that follows.
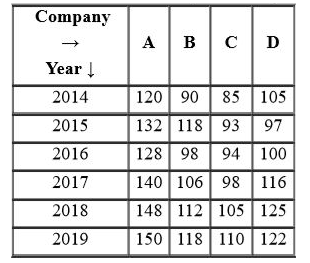
The ratio of the total number of engineers recruited by companies A and B in 2015 and 2018 to the total number of engineers recruited by C and D in 2014 and 2018, is:A17:14B13:21C9:14D28:19Study the following graph carefully to answer these questions-
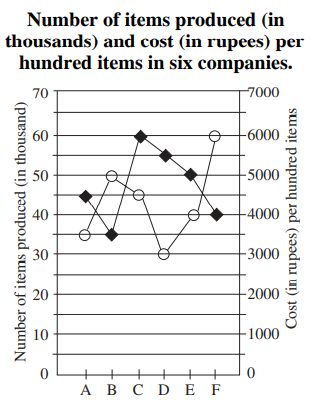
If the number of items produced by company ‘D’ increases by 30%. What will be the total cost of items produced?ARs. 21⋅45 lakhsBRs. 22⋅45 lakhsCRs. 24⋅25 lakhsDRs. 22⋅25 lakhs
Pie chart given below shows total number of workers in three different companies. Table given below shows ratio between officers and workers working in these companies. Study the data carefully and answer the following questions
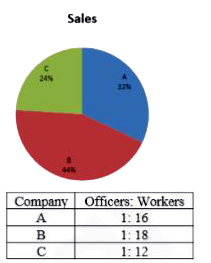
Note: total employees = officers + workers
Find the ratio between total number of workers in company A and C together to total number of officers in company A and C together?
View SolutionPie chart given below shows total number of workers in three different companies. Table given below shows ratio between officers and workers working in these companies. Study the data carefully and answer the following questions . total workers = 900
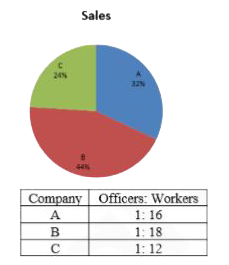
Note: total employees = officers + workers
Total number of employees in company ‘B’ is how much more than total number of employees in company ‘C’.
View SolutionPie chart given below shows total number of workers in three different companies. Table given below shows ratio between officers and workers working in these companies. Study the data carefully and answer the following questions
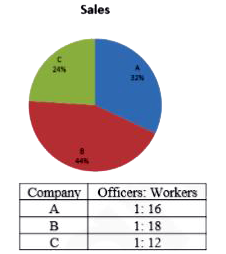
Note: total employees = officers + workers
Total number of officers in company ‘A’ is how much less than total number of officers in company ‘B’?
View SolutionThe following table show the total number of mails received in inbox by different users and the percentage o mails read by the users and the ttoal number of spam reveived in month.
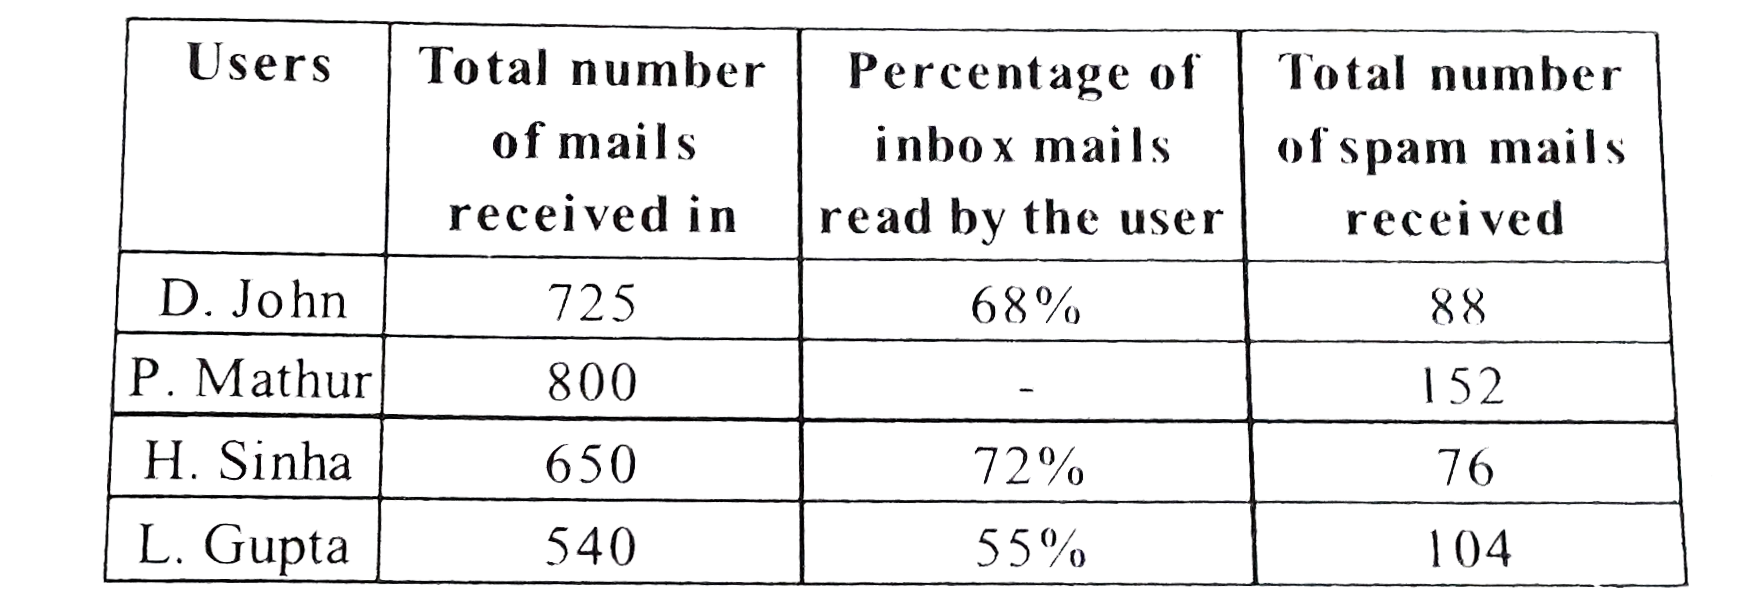
Note : The spam mails didn't read by the users.
The total number of mails recevied in Inbox +Total number of spam mails received. ''-'' indicates thaty you have to find the answer accroding to the question they asked.
Find the ratio between the total number of mails didn't read by H. Sinha to that of total number of spam mails received by L. Gupta ?
View SolutionThe following diagram show the expenditure of a family on various Items A ,B,C, D and E .
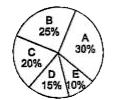
Study the diagram carefully and answer the following questions .
If the income of the family is Rs 3000 per month then expenditure on item C will be
View Solution
