Given below is the line graph which shows the numbers of wooden toys and plastics toys sold in 5 different days of the week. Read the given information carefully and answer the following questions.
Total toys= Wooden toys + Plastic toys
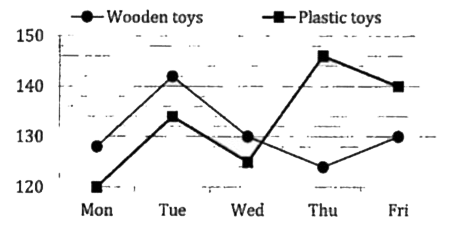
What is the average of Plastic toys sold on Tuesday, Wednesday and Friday?
131
133
132
130
The correct Answer is:B
Step by step video & image solution for Given below is the line graph which shows the numbers of wooden toys and plastics toys sold in 5 different days of the week. Read the given information carefully and answer the following questions. Total toys= Wooden toys + Plastic toys What is the average of Plastic toys sold on Tuesday, Wednesday and Friday? by Maths experts to help you in doubts & scoring excellent marks in Class 14 exams.
Topper's Solved these Questions
Similar Questions
The sales of rings on different days of the week is shown below. Based on the information given in pictograph, answer the following questions.
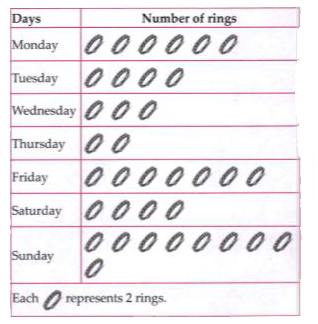
How many rings were sold on Tuesday ?View SolutionThe sales of rings on different days of the week is shown below. Based on the information given in pictograph, answer the following questions.
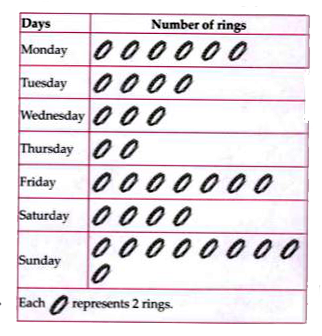
On which day, the maximum number of rings were sold ?View SolutionThe sale of number of dolls on different days of a week in a shopping mall is shown below :
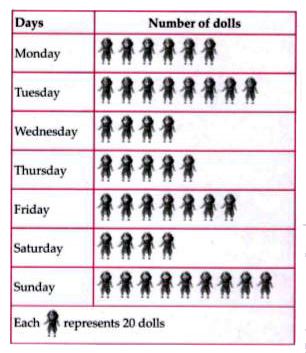
Observe the pictograph and answer the following questions.
How many dolls were sold on Tuesday ?View Solutionthe given bar graph shows the numbers of puspils who participated in the fitness test in different days of the week .
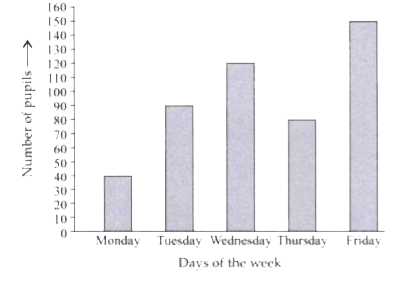
what percentage of the total number of puipil had their test on Wednesday ?View SolutionBar graph given below shows pens sold by a retailor on five different days. Study the data carefully and answer the following questions.
Pen sold on different days
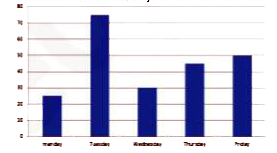
Find the difference between total number of pens sold on Monday and Tuesday together to total number of pens sold on Thursday and Friday together?View SolutionGiven below is a graph showing the number of electric bulbs sold in a shop during a week
Read the bar graph carefully and answer the following questions
(i) On which day of the week was the sale minimum?
(ii) On which day of the week was the sale maximum
(iiI) What was the total sale during the week
(lv) What is the ratio between the minimum sale and the maximum sale
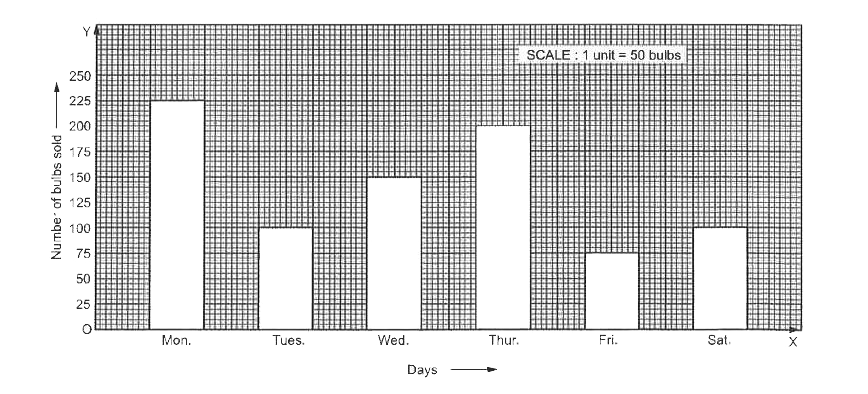 View Solution
Directions: The following table shows the number of bananas sold by 5 fruit sellers and the relation of apples with bananas in 3rd column. Read the table carefully and answer the following question.

The total fruits sold by B is approximately what percent of the total fruits sold by D?View SolutionRead the following graph carefully and answer the questions given below:
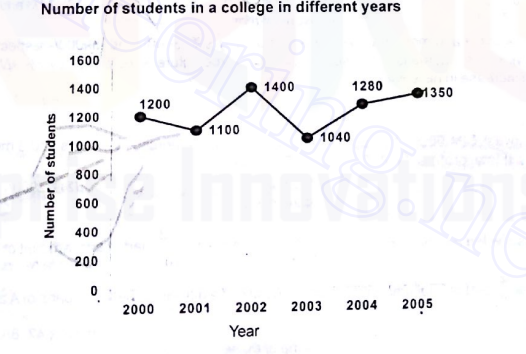
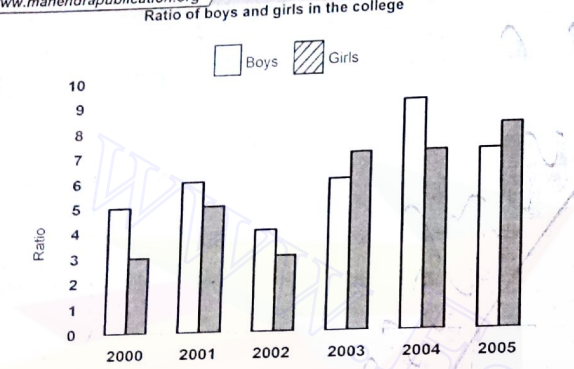
In which two years the number of girls is equal ?View SolutionRead the following information carefully and answer the questions given below.
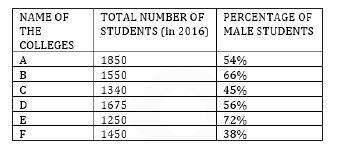
Find the average of the number of female in all the colleges except college C and E?View SolutionBar graph given below shows pens sold by a retailor on five different days. Study the data carefully and answer the following questions.
Pen sold on different days
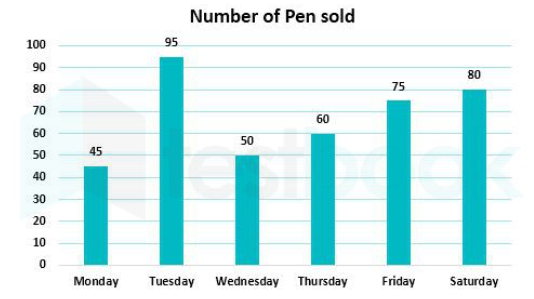
what is the average number of pens sold during a week if total number of pens sold on saturday is 25% more than total number of pens sold on Sunday .View Solution

