Table given below shows number of orders received by three (P, Q & R) companies of their three (A, B &C) items. Read the data carefully and answer the questions.

Find average number of orders of item B received by Q & R is what percent of total orders of item A received by P?
10414%
10614%
10814%
10214%
The correct Answer is:B
Step by step video & image solution for Table given below shows number of orders received by three (P, Q & R) companies of their three (A, B &C) items. Read the data carefully and answer the questions. Find average number of orders of item B received by Q & R is what percent of total orders of item A received by P? by Maths experts to help you in doubts & scoring excellent marks in Class 14 exams.
Topper's Solved these Questions
Similar Questions
The line graph given below shows the number of text messages received by Keerthi during a week. Study The graph carefully and answer the questions that follow.
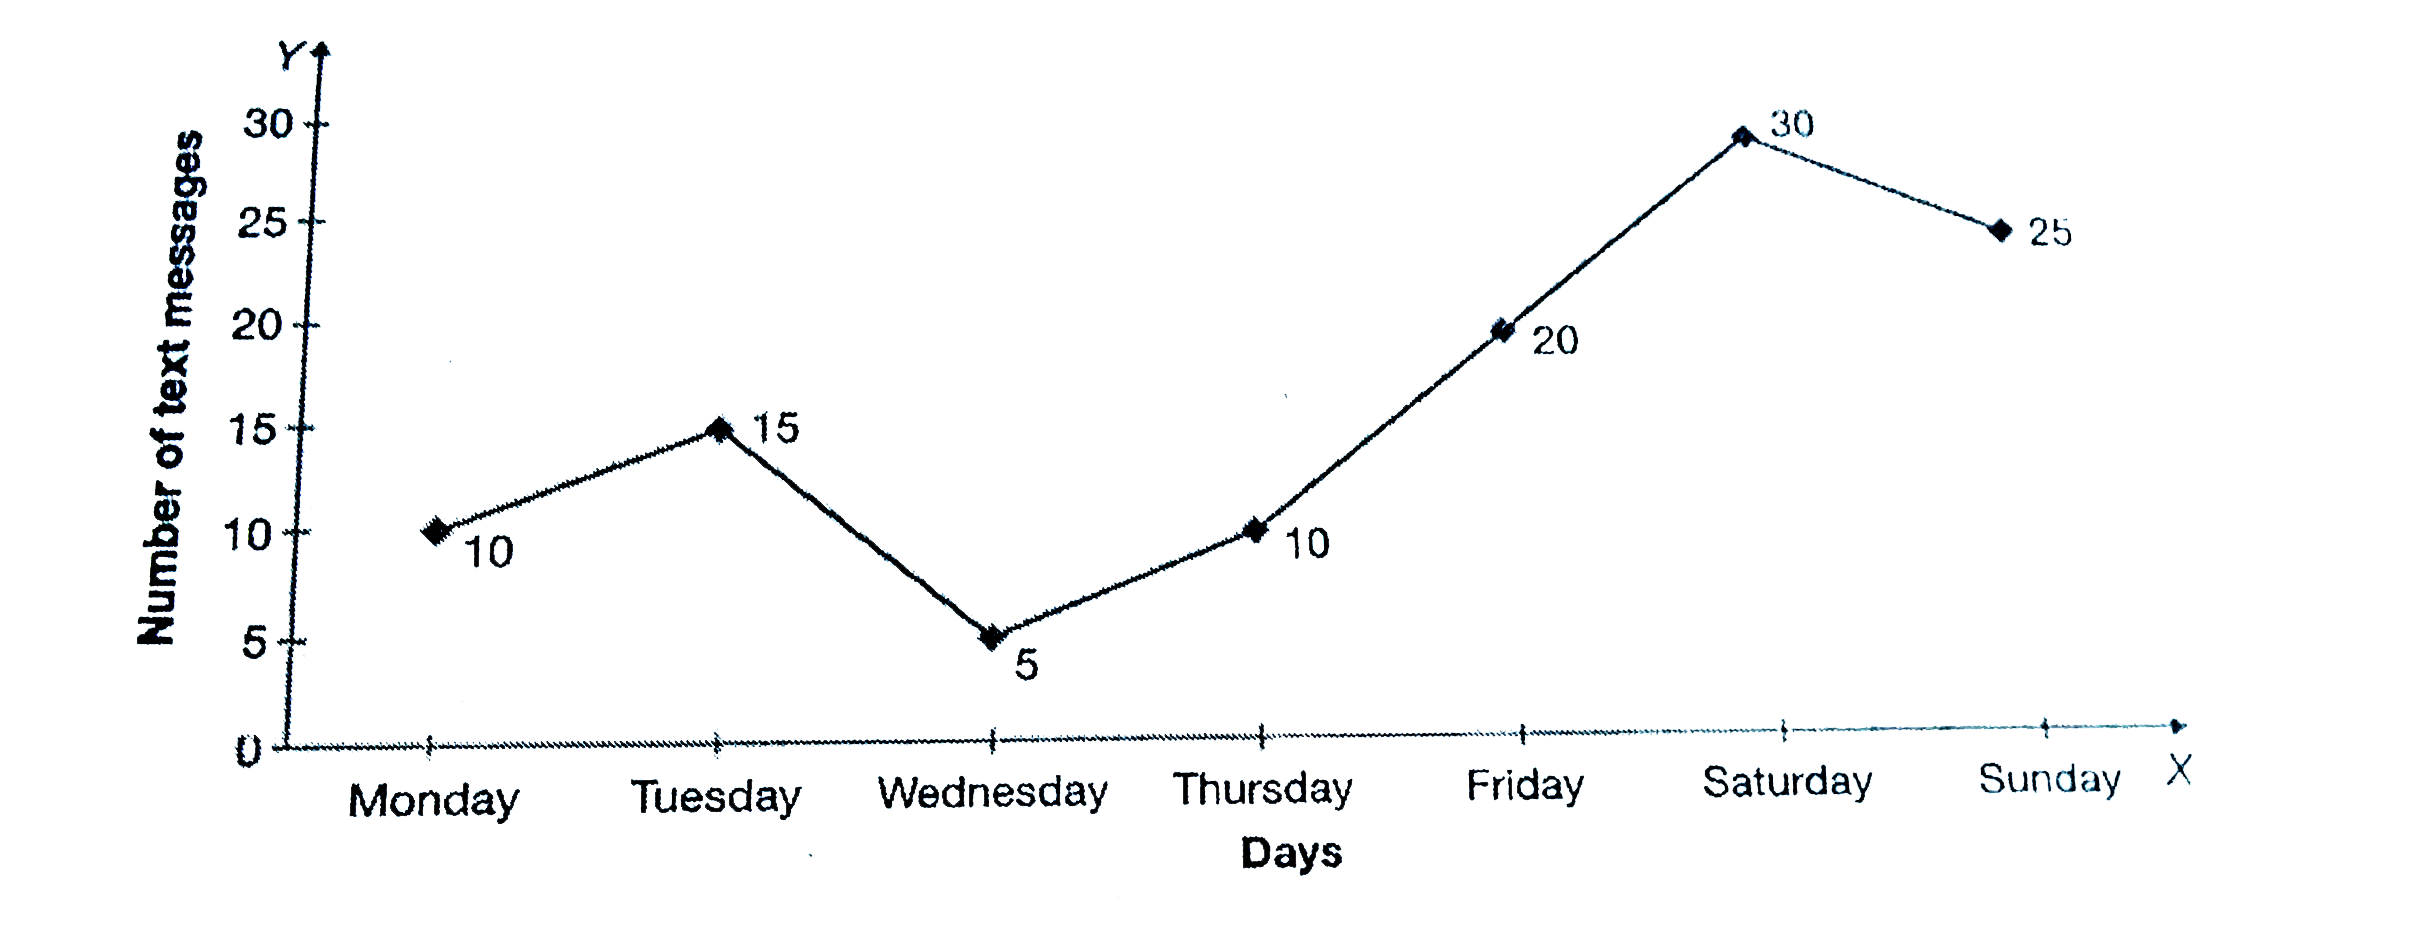
(i) On which day did Keerthi receive exactly 20 text message ?
(iii) Find the total number of text messages received by Keerthi in week.View SolutionPie chart given below shows total number of workers in three different companies. Table given below shows ratio between officers and workers working in these companies. Study the data carefully and answer the following questions
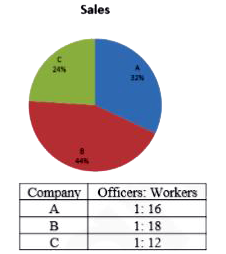
Note: total employees = officers + workers
Total number of officers in company ‘A’ is how much less than total number of officers in company ‘B’?View Solution
Knowledge Check
- Question 1 - Select One
Study the following graph carefully to answer these questions-
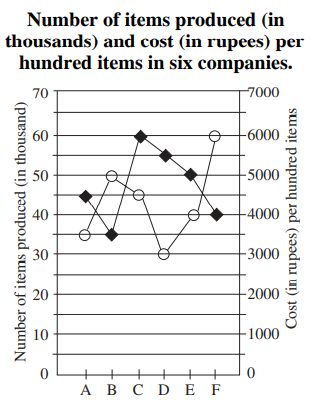
If the number of items produced by company ‘D’ increases by 30%. What will be the total cost of items produced?ARs. 21⋅45 lakhsBRs. 22⋅45 lakhsCRs. 24⋅25 lakhsDRs. 22⋅25 lakhs - Question 2 - Select One
Study the following graph carefully to answer these questions-
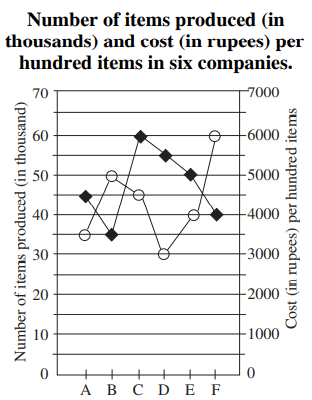
What is the total cost of items produced by companies A and B together?ARs. 17⋅50 lakhBRs. 33⋅25 lakhCRs. 15⋅70 lakhDRs. 32⋅75 lakh
Pie chart given below shows total number of workers in three different companies. Table given below shows ratio between officers and workers working in these companies. Study the data carefully and answer the following questions
Total workers =900
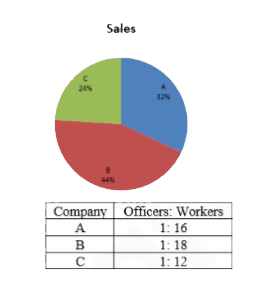
Note: total employees = officers + workers
Find the difference between total number of workers in company ‘A’ and total number of workers in company ‘B’ and ‘C’ together?View SolutionPie chart given below shows total number of workers in three different companies. Table given below shows ratio between officers and workers working in these companies. Study the data carefully and answer the following questions
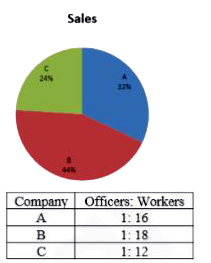
Note: total employees = officers + workers
Find the ratio between total number of workers in company A and C together to total number of officers in company A and C together?View SolutionFor the following data answer the questions :
Reaction : A+B → P
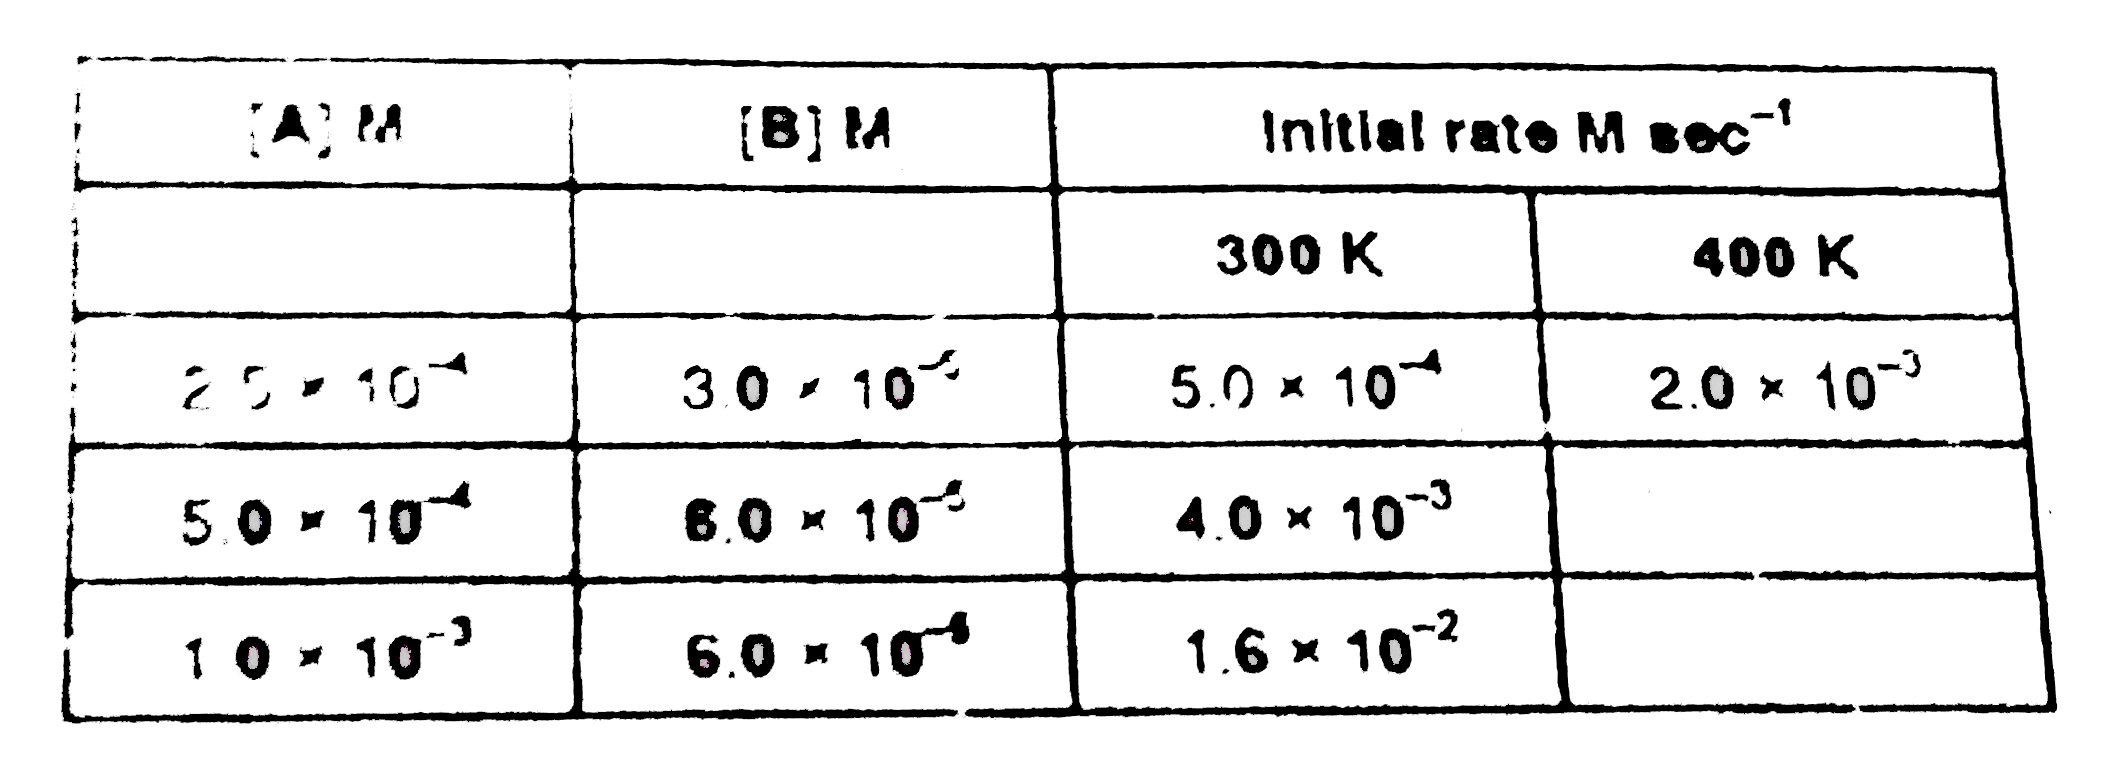
The order w.r.t A is :View SolutionStudy the line graph given below to answer the following questions.
The line graph given below shows the percentage of orders delivered from Monday to Saturday of week III out of the orders received on Sunday of Week II and it also shows the number of orders returned on any given day as a percentage of total number of orders delivered till previous day.
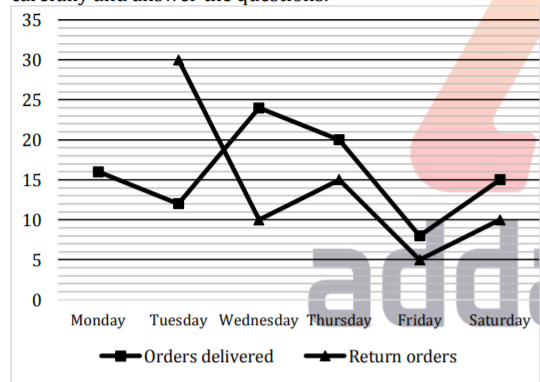
Note: • Number of orders which were yet to be delivered after Saturday of week III were 25.
• Orders cannot be returned on the same day of delivery. It has to be returned on next day of delivery and no order was returned on Sunday of Week III.
Find the average number of orders delivered on Monday, Tuesday and Thursday of week III.View SolutionPie chart given below shows total number of workers in three different companies. Table given below shows ratio between officers and workers working in these companies. Study the data carefully and answer the following questions . total workers = 900
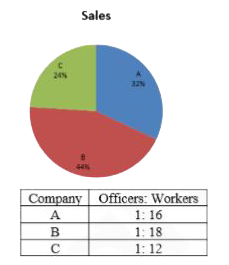
Note: total employees = officers + workers
Total number of employees in company ‘B’ is how much more than total number of employees in company ‘C’.View SolutionStudy the line graph given below to answer the following questions.
The line graph given below shows the percentage of orders delivered from Monday to Saturday of week III out of the orders received on Sunday of Week II and it also shows the number of orders returned on any given day as a percentage of total number of orders delivered till previous day.
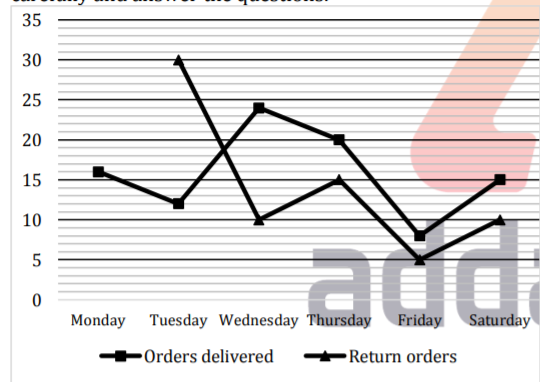
Note: • Number of orders which were yet to be delivered after Saturday of week III were 25.
• Orders cannot be returned on the same day of delivery. It has to be returned on next day of delivery and no order was returned on Sunday of Week III.
What is the ratio between the number of orders returned on Wednesday to that returned on Friday?View Solution

