The distance-time graph of the motion of a toy car is shown in the figure. Which of the following statements is false for the toy car?
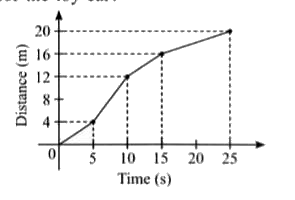
Car is moving fastest during the time interval 5 s to 10 s.
Average speed of the car is 0.8 m/s.
Car is moving with three different speeds during whole journey.
Speed of the car at 8s is 0.8 m/s.
The correct Answer is:D
Rate of change of distance is greatest during the erval 5 s to 10 s. So the car moves fastest during this time interval.
For 5 s to 10 s : v=12−410−5=1.6m/s
Average speed, v=Total distance travelledTotal time taken
⇒v=20−025=0.8m/s
Topper's Solved these Questions
Similar Questions
Knowledge Check
- Question 1 - Select One
The displecement-time graph of a particle execting SHM is shown in figure. Which of the following statements is false?
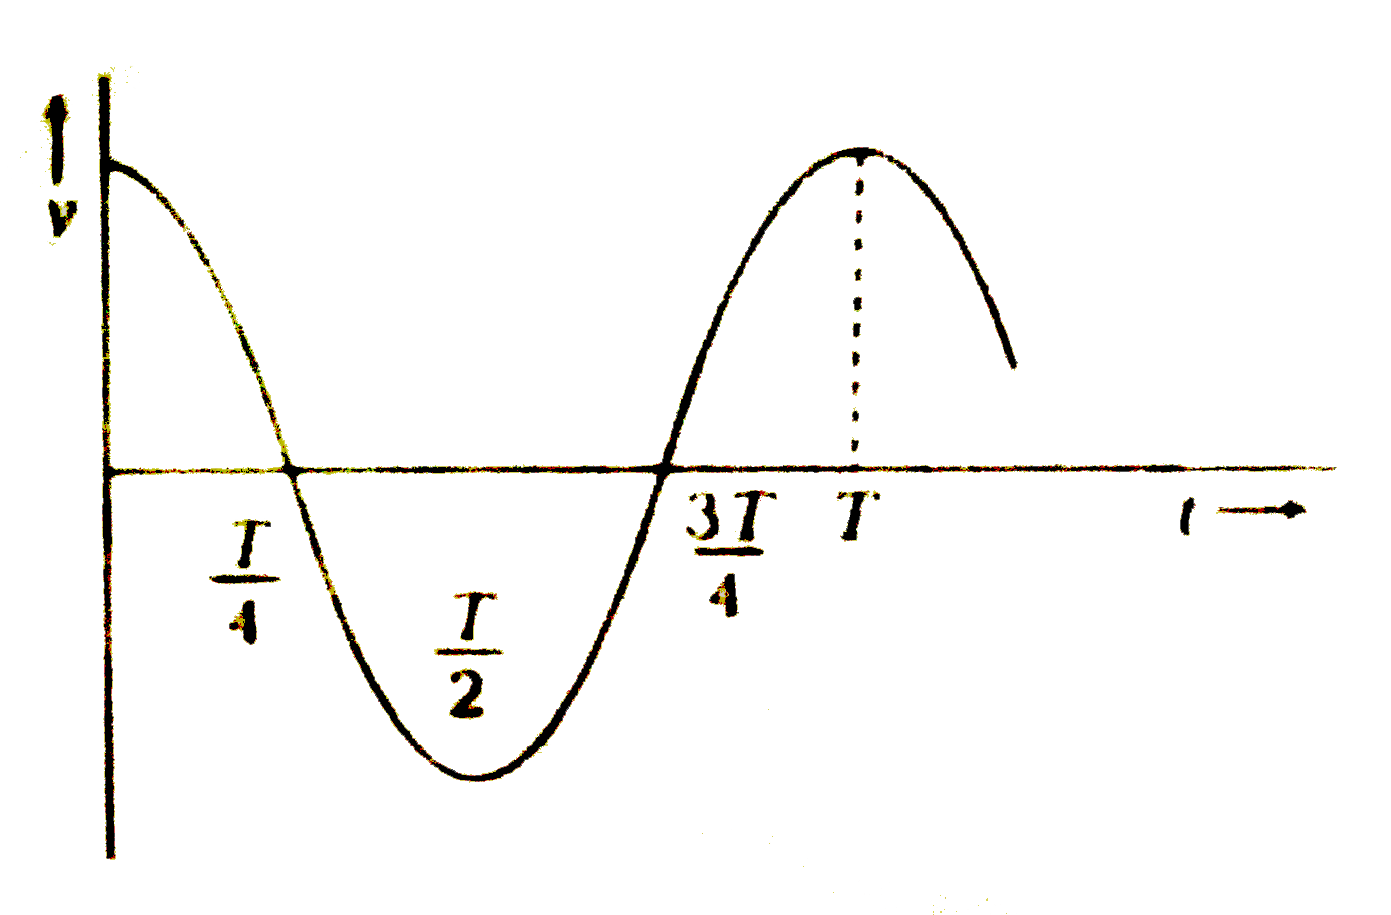 AThe acceleration is maximuym at t=TBTh force is zero at t=3T4CThe potential energy equals the total oscillation energy at t=T2DNone of the above
 - Question 2 - Select One or More
The velocity time graph of the motion of a car is given here.
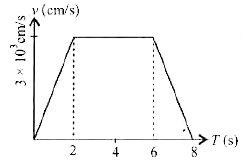 AThe distance travelled by the car in the first six seconds is 150 m.BThe deceleration of the car during the last two seconds are −15ms2.CThe distance travelled by the car in the first six second is 220 m.DThe deceleration of the car during the last two second is −20ms2
 - Question 3 - Select One
Velocity-time graph for a car is semicircle as shown here. Which of the following is correct:
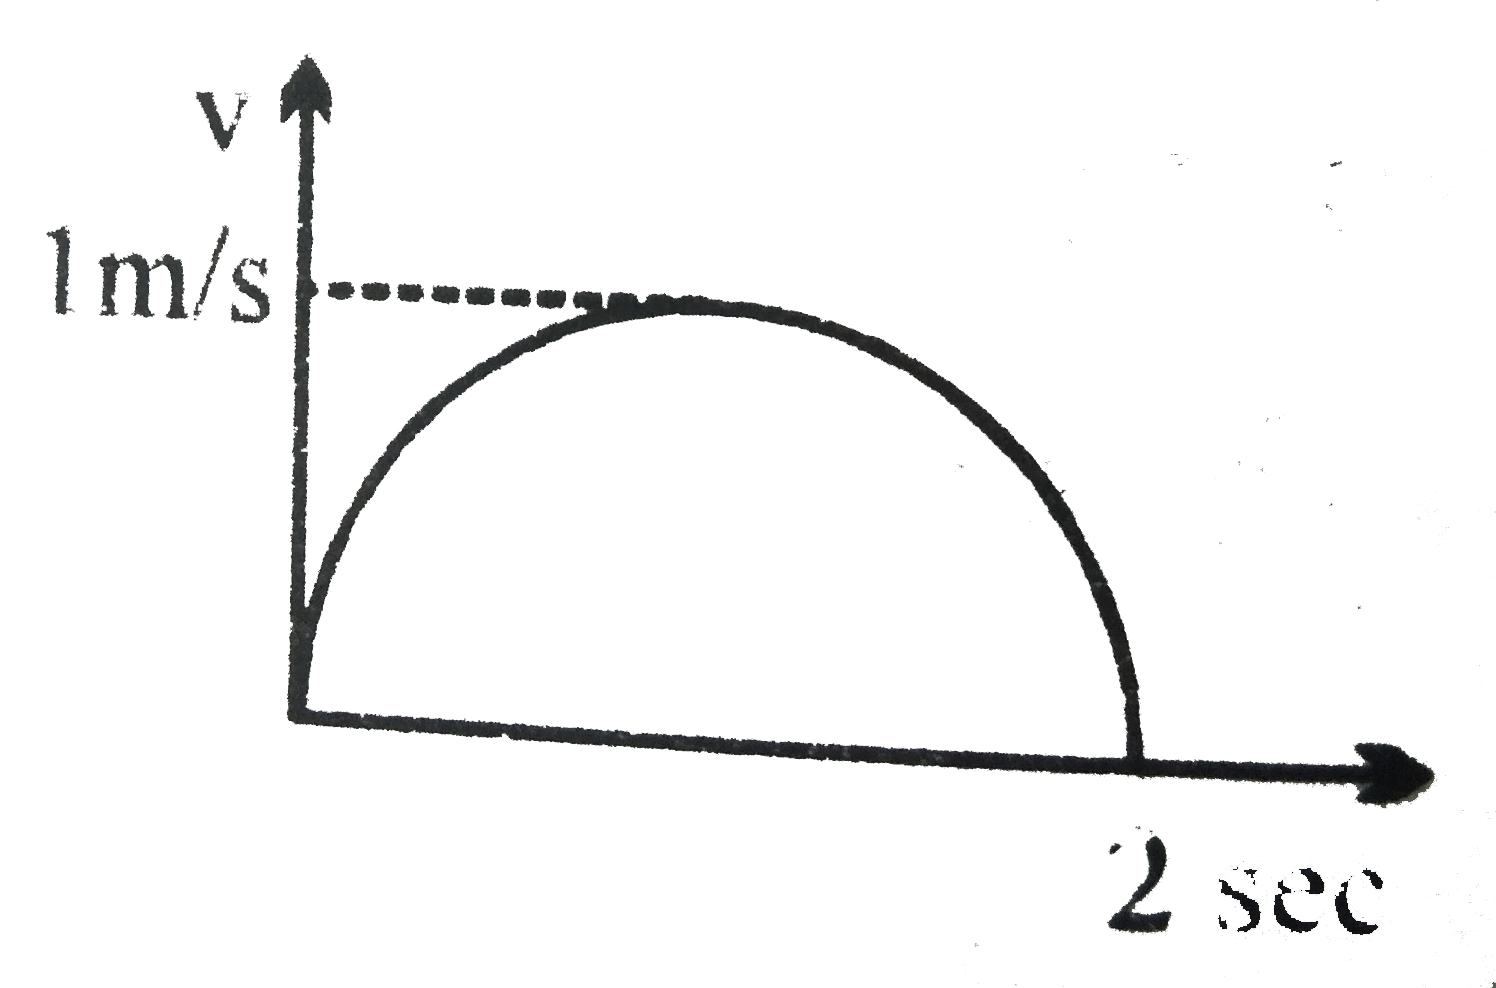 ACar must move in circular path.BAcceleration of car is never zero.CMean spped of the aprticel is π/4m/s.DThe car makes a turn once during its motion.
Figure shows the distance-time graph for the motion of two vehicles A and B. Which one of them is moving faster?
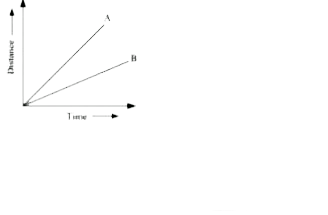
Distance-time graph for the motion of two carsView SolutionDraw a distance-time graph to show the motion of a car moving with a speed which is not constant (non-uniform speed).
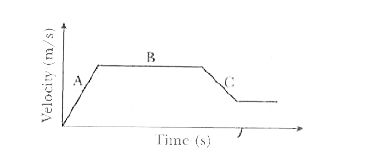
View SolutionThe given figure shows the velocity versus time curve for a car traveling along a straight line. Which of the following statements is false ?
 View Solution
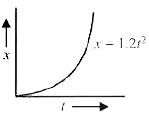
Given figure shows the distance-time graph of the motion of a car. It follows from the,| graph that the car is
 View Solution
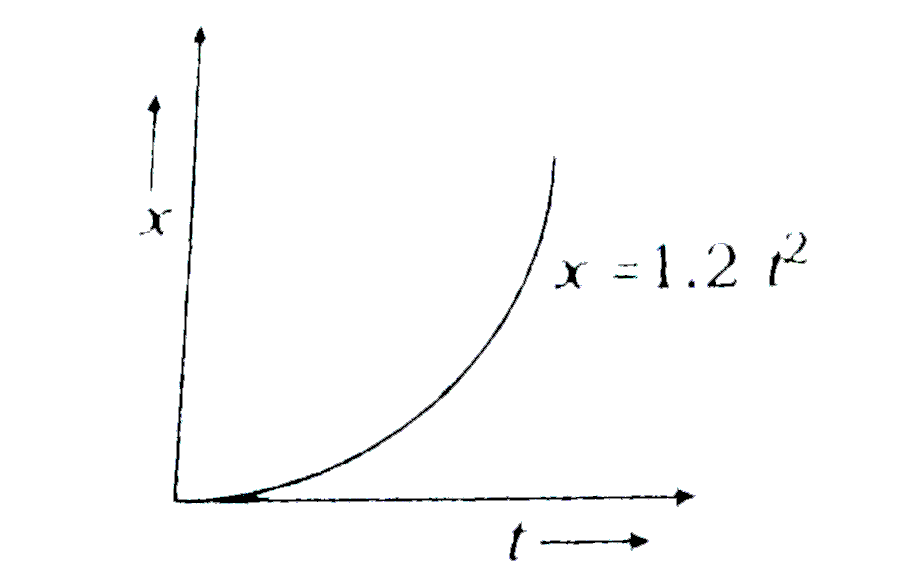
Figure given shows the distance - time graph of the motion of a car. It follows from the graph that the car is
 View Solution


