While demonstrating acid-base reactions, Ms. Prabha, a science teacher added sodium oxide to HCl until it was in excess. Which of the following graphs correctly represents the change in pH?


The correct Answer is:A
To solve the question about the change in pH when sodium oxide is added to hydrochloric acid (HCl), we can follow these steps:
Step 1: Understand the Reaction
Sodium oxide (Na2O) is a basic oxide and will react with hydrochloric acid (HCl) to form sodium chloride (NaCl) and water (H2O). The reaction can be represented as:
Na2O+2HCl→2NaCl+H2O
Step 2: Initial pH of HCl
Hydrochloric acid is a strong acid, and its pH is typically less than 7. The exact pH depends on the concentration of HCl, but we can assume it starts at a low value (e.g., around 1-3).
Step 3: Adding Sodium Oxide
As sodium oxide is added to the HCl solution, it will start to neutralize the acid. Initially, the pH will begin to rise slowly as the acid is neutralized.
Step 4: Reaching Neutralization Point
At a certain point, all the HCl will be neutralized by the sodium oxide, and the pH will reach around 7, which is neutral. This is the point of neutralization.
Step 5: Excess Sodium Oxide
Once all the HCl is neutralized, any additional sodium oxide will cause the pH to increase further, as the solution will now be basic. The pH will continue to rise but at a slower rate until it stabilizes at a higher value (greater than 7).
Step 6: Graph Interpretation
The graph that represents this scenario would show:
- A gradual increase in pH as sodium oxide is added.
- A sharp increase at the neutralization point.
- A plateau or constant increase after the neutralization point due to the excess sodium oxide.
Based on these observations, the correct graph would be the one that shows a gradual increase in pH followed by a plateau, indicating that after the neutralization point, the pH stabilizes with excess sodium oxide.
Conclusion
The correct graph that represents the change in pH when sodium oxide is added to hydrochloric acid until it is in excess is Graph 1.
---
Sodium oxide (Na2O) is a basic oxide and will react with hydrochloric acid (HCl) to form sodium chloride (NaCl) and water (H2O). The reaction can be represented as:
Na2O+2HCl→2NaCl+H2O
Hydrochloric acid is a strong acid, and its pH is typically less than 7. The exact pH depends on the concentration of HCl, but we can assume it starts at a low value (e.g., around 1-3).
As sodium oxide is added to the HCl solution, it will start to neutralize the acid. Initially, the pH will begin to rise slowly as the acid is neutralized.
At a certain point, all the HCl will be neutralized by the sodium oxide, and the pH will reach around 7, which is neutral. This is the point of neutralization.
Once all the HCl is neutralized, any additional sodium oxide will cause the pH to increase further, as the solution will now be basic. The pH will continue to rise but at a slower rate until it stabilizes at a higher value (greater than 7).
The graph that represents this scenario would show:
- A gradual increase in pH as sodium oxide is added.
- A sharp increase at the neutralization point.
- A plateau or constant increase after the neutralization point due to the excess sodium oxide.
The correct graph that represents the change in pH when sodium oxide is added to hydrochloric acid until it is in excess is Graph 1.
Topper's Solved these Questions
Similar Questions
100 mL of 0.1 HCl is taken in a beaker and to it 100 mL of 0.1 M NaOH is added in steps of 2ml and the pH is continuously measured . Which of the following graphs correctly depicts the change in pH
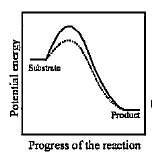
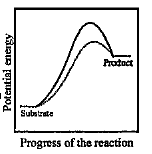
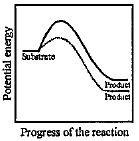
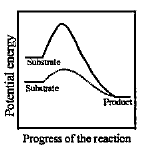
View SolutionThe following graphs with the solid and dotted lines correspond to the reactions without and with enzyme,respectively.Which of the following graph(s) correctly represents the concept of activation energy?
 View Solution
Knowledge Check
- Question 1 - Select One
Which of the following sequence correctly represents the decreasing acid nature of oxides?
ALi2O>BeO>B2O3>CO2>N2O3BN2O3>CO2>B2O3>BeO>Li2OCCO2>N2O3>B2O3>BeO>Li2ODB2O3>CO2>N2O3>Li2O>BeO - Question 2 - Select One
Which of the following sequence correctly represents the decreasing acidic nature of oxides?
ANO2 > CO2 >B2O3 >BeO > Li2OBCO2> NO2 g>B2O3 > BeO > Li2OCLi2O>BeO >B2O3 >CO2 > NO2DB2O3 > CO2 > NO2>Li2O>BeO - Question 3 - Select One
Which of the following sequence correctly represents the decreasing acidic nature of oxides?
ALi2O>BeO>B2O3>CO2>N2O3BN2O3>CO2>B2O3>BeO>Li2OCCO2>N2O3>B2O3>BeO>Li2ODB2O3>CO2>N2O3>Li2O>BeO
In an acid base titration, 0.1 M HCI solution was added to the NaOH solution of unknown strength. Which of the following correctly shows the change of pH of the titration mixture in this experiment?
 View Solution
Which of the following sequence correctly represents the decreasing acidic nature of oxides ?
View SolutionWhich of the following graph correctly represent for equilibrium reaction whose Kp>1?
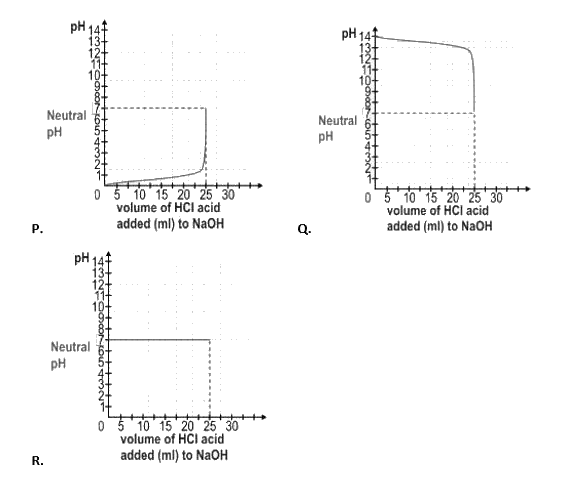
View SolutionAditi adds dropwise 25 ml of concentrated HCl to 25 ml of concentrated NaOH and continuously monitors the pH in the mixture. She finds that the pH of the mixture at the end of the experiment is 7.
Which of the following graph correctly demonstrates the change in pH in the mixture during the experiment?
 View Solution
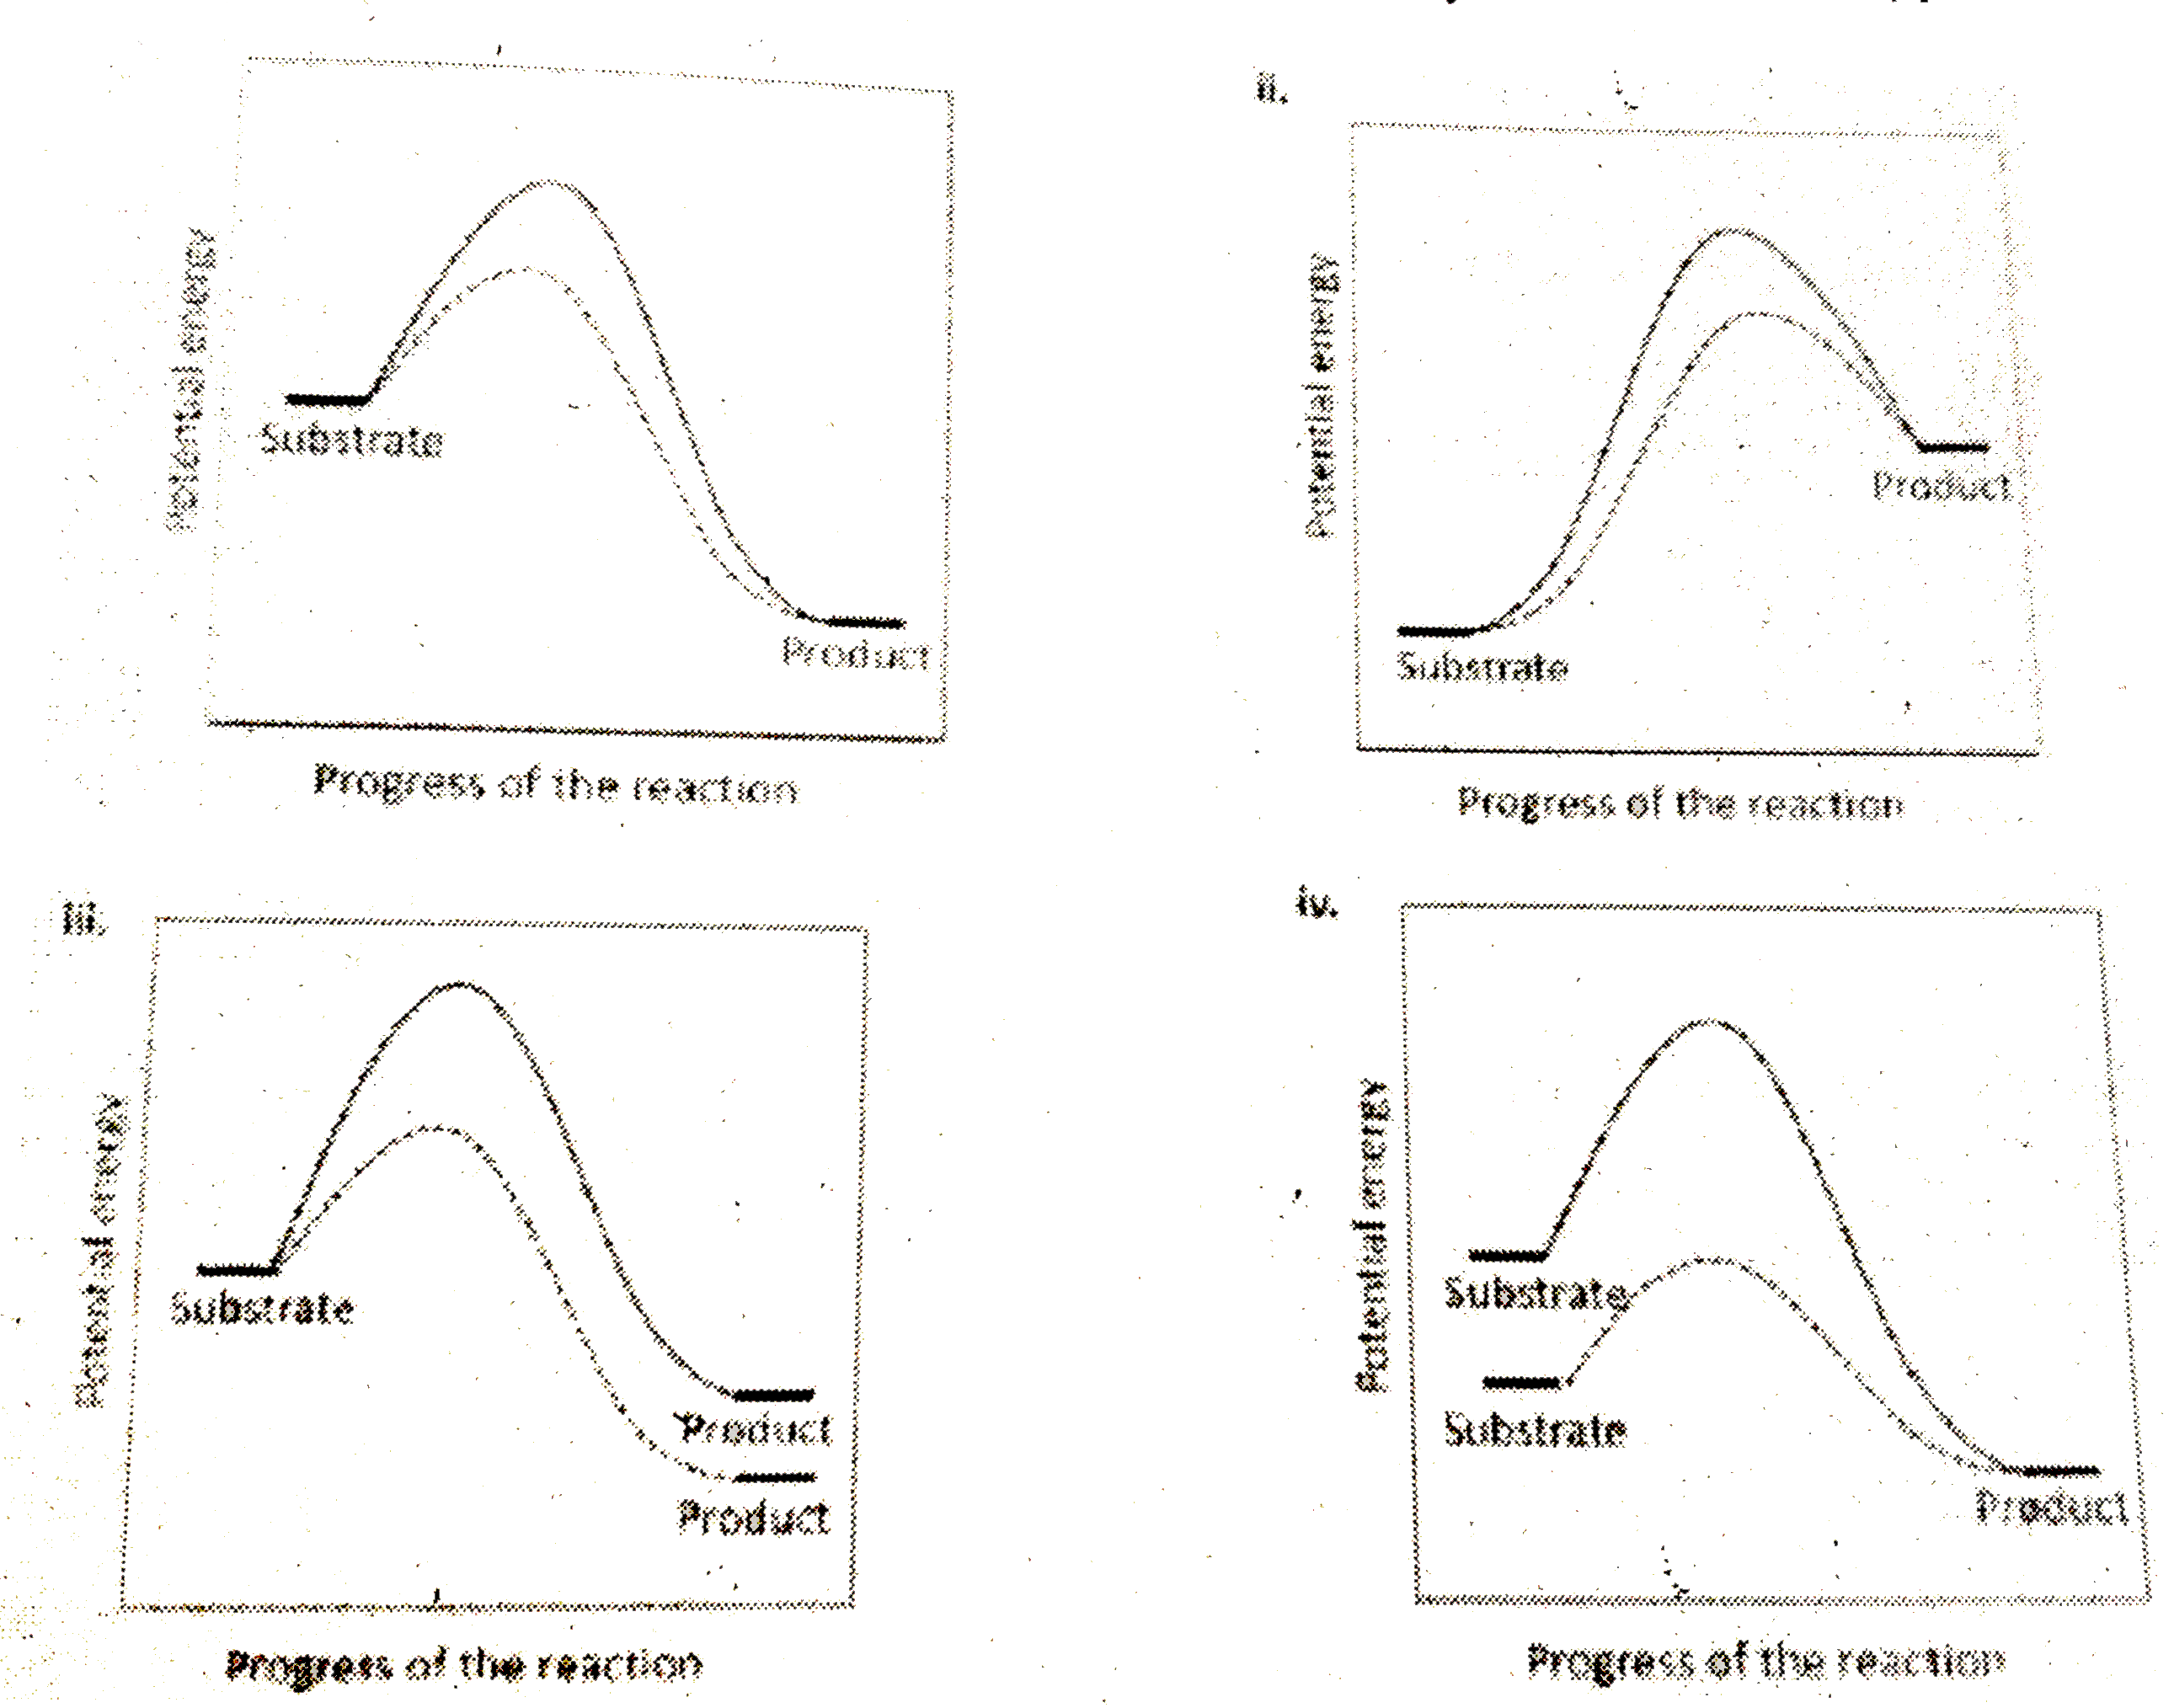
The following graphs with the solid and dotted lines correspond to the reactions without and with enzyme , respectively . Which of the following graph(s) correctly represent the concept of activation energy ?
 View Solution

