Following equation gives variation of equilibrium constant k with temperature T
logk=logA−ΔH2.303RT
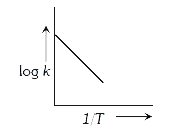
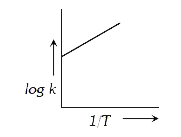
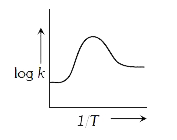
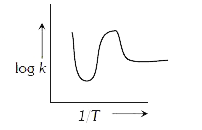
Graphically this variation is represented as
The correct Answer is:A
To solve the problem regarding the variation of the equilibrium constant k with temperature T, we start from the given equation:
logk=logA−ΔH2.303RT
Step 1: Identify the Variables
In the equation, we can identify:
- logk as the dependent variable (Y-axis)
- 1T as the independent variable (X-axis)
- logA as the y-intercept
- −ΔH2.303R as the slope of the line
Step 2: Rearranging the Equation
We can rearrange the equation in the form of Y=mx+c:
logk=−ΔH2.303R⋅(1T)+logA
Here, Y=logk, x=1T, m=−ΔH2.303R, and c=logA.
Step 3: Analyzing the Slope
The slope m is negative, which indicates that as 1T increases (meaning temperature T decreases), logk decreases. This suggests an inverse relationship between k and T.
Step 4: Graphical Representation
When we plot logk on the Y-axis against 1T on the X-axis, we will get a straight line with a negative slope. The line will intercept the Y-axis at logA.
Conclusion
The graphical representation of the variation of the equilibrium constant k with temperature T is a straight line with a negative slope.
---
In the equation, we can identify:
- logk as the dependent variable (Y-axis)
- 1T as the independent variable (X-axis)
- logA as the y-intercept
- −ΔH2.303R as the slope of the line
We can rearrange the equation in the form of Y=mx+c:
logk=−ΔH2.303R⋅(1T)+logA
Here, Y=logk, x=1T, m=−ΔH2.303R, and c=logA.
The slope m is negative, which indicates that as 1T increases (meaning temperature T decreases), logk decreases. This suggests an inverse relationship between k and T.
When we plot logk on the Y-axis against 1T on the X-axis, we will get a straight line with a negative slope. The line will intercept the Y-axis at logA.
The graphical representation of the variation of the equilibrium constant k with temperature T is a straight line with a negative slope.
Topper's Solved these Questions
- BOOK - ERRORLESSCHAPTER - CHEMICAL KINETICSEXERCISE - PAST YEARS QUESTIONS51videos
CHEMICAL KINETICS
- BOOK - ERRORLESSCHAPTER - CHEMICAL KINETICSEXERCISE - Assertion & Reason6videos
CHEMICAL KINETICS
- BOOK - ERRORLESSCHAPTER - CHEMICAL KINETICSEXERCISE - NCERT BASED QUESTIONS (Photochemical Reaction)4videos
CHEMICAL KINETICS
- BOOK - ERRORLESSCHAPTER - CARBOXYLIC ACIDSEXERCISE - Assertion & Reason5videos
CARBOXYLIC ACIDS
- BOOK - ERRORLESSCHAPTER - CHEMISTRY IN EVERYDAY LIFE EXERCISE - Assertion & Reason4videos
CHEMISTRY IN EVERYDAY LIFE
Similar Questions
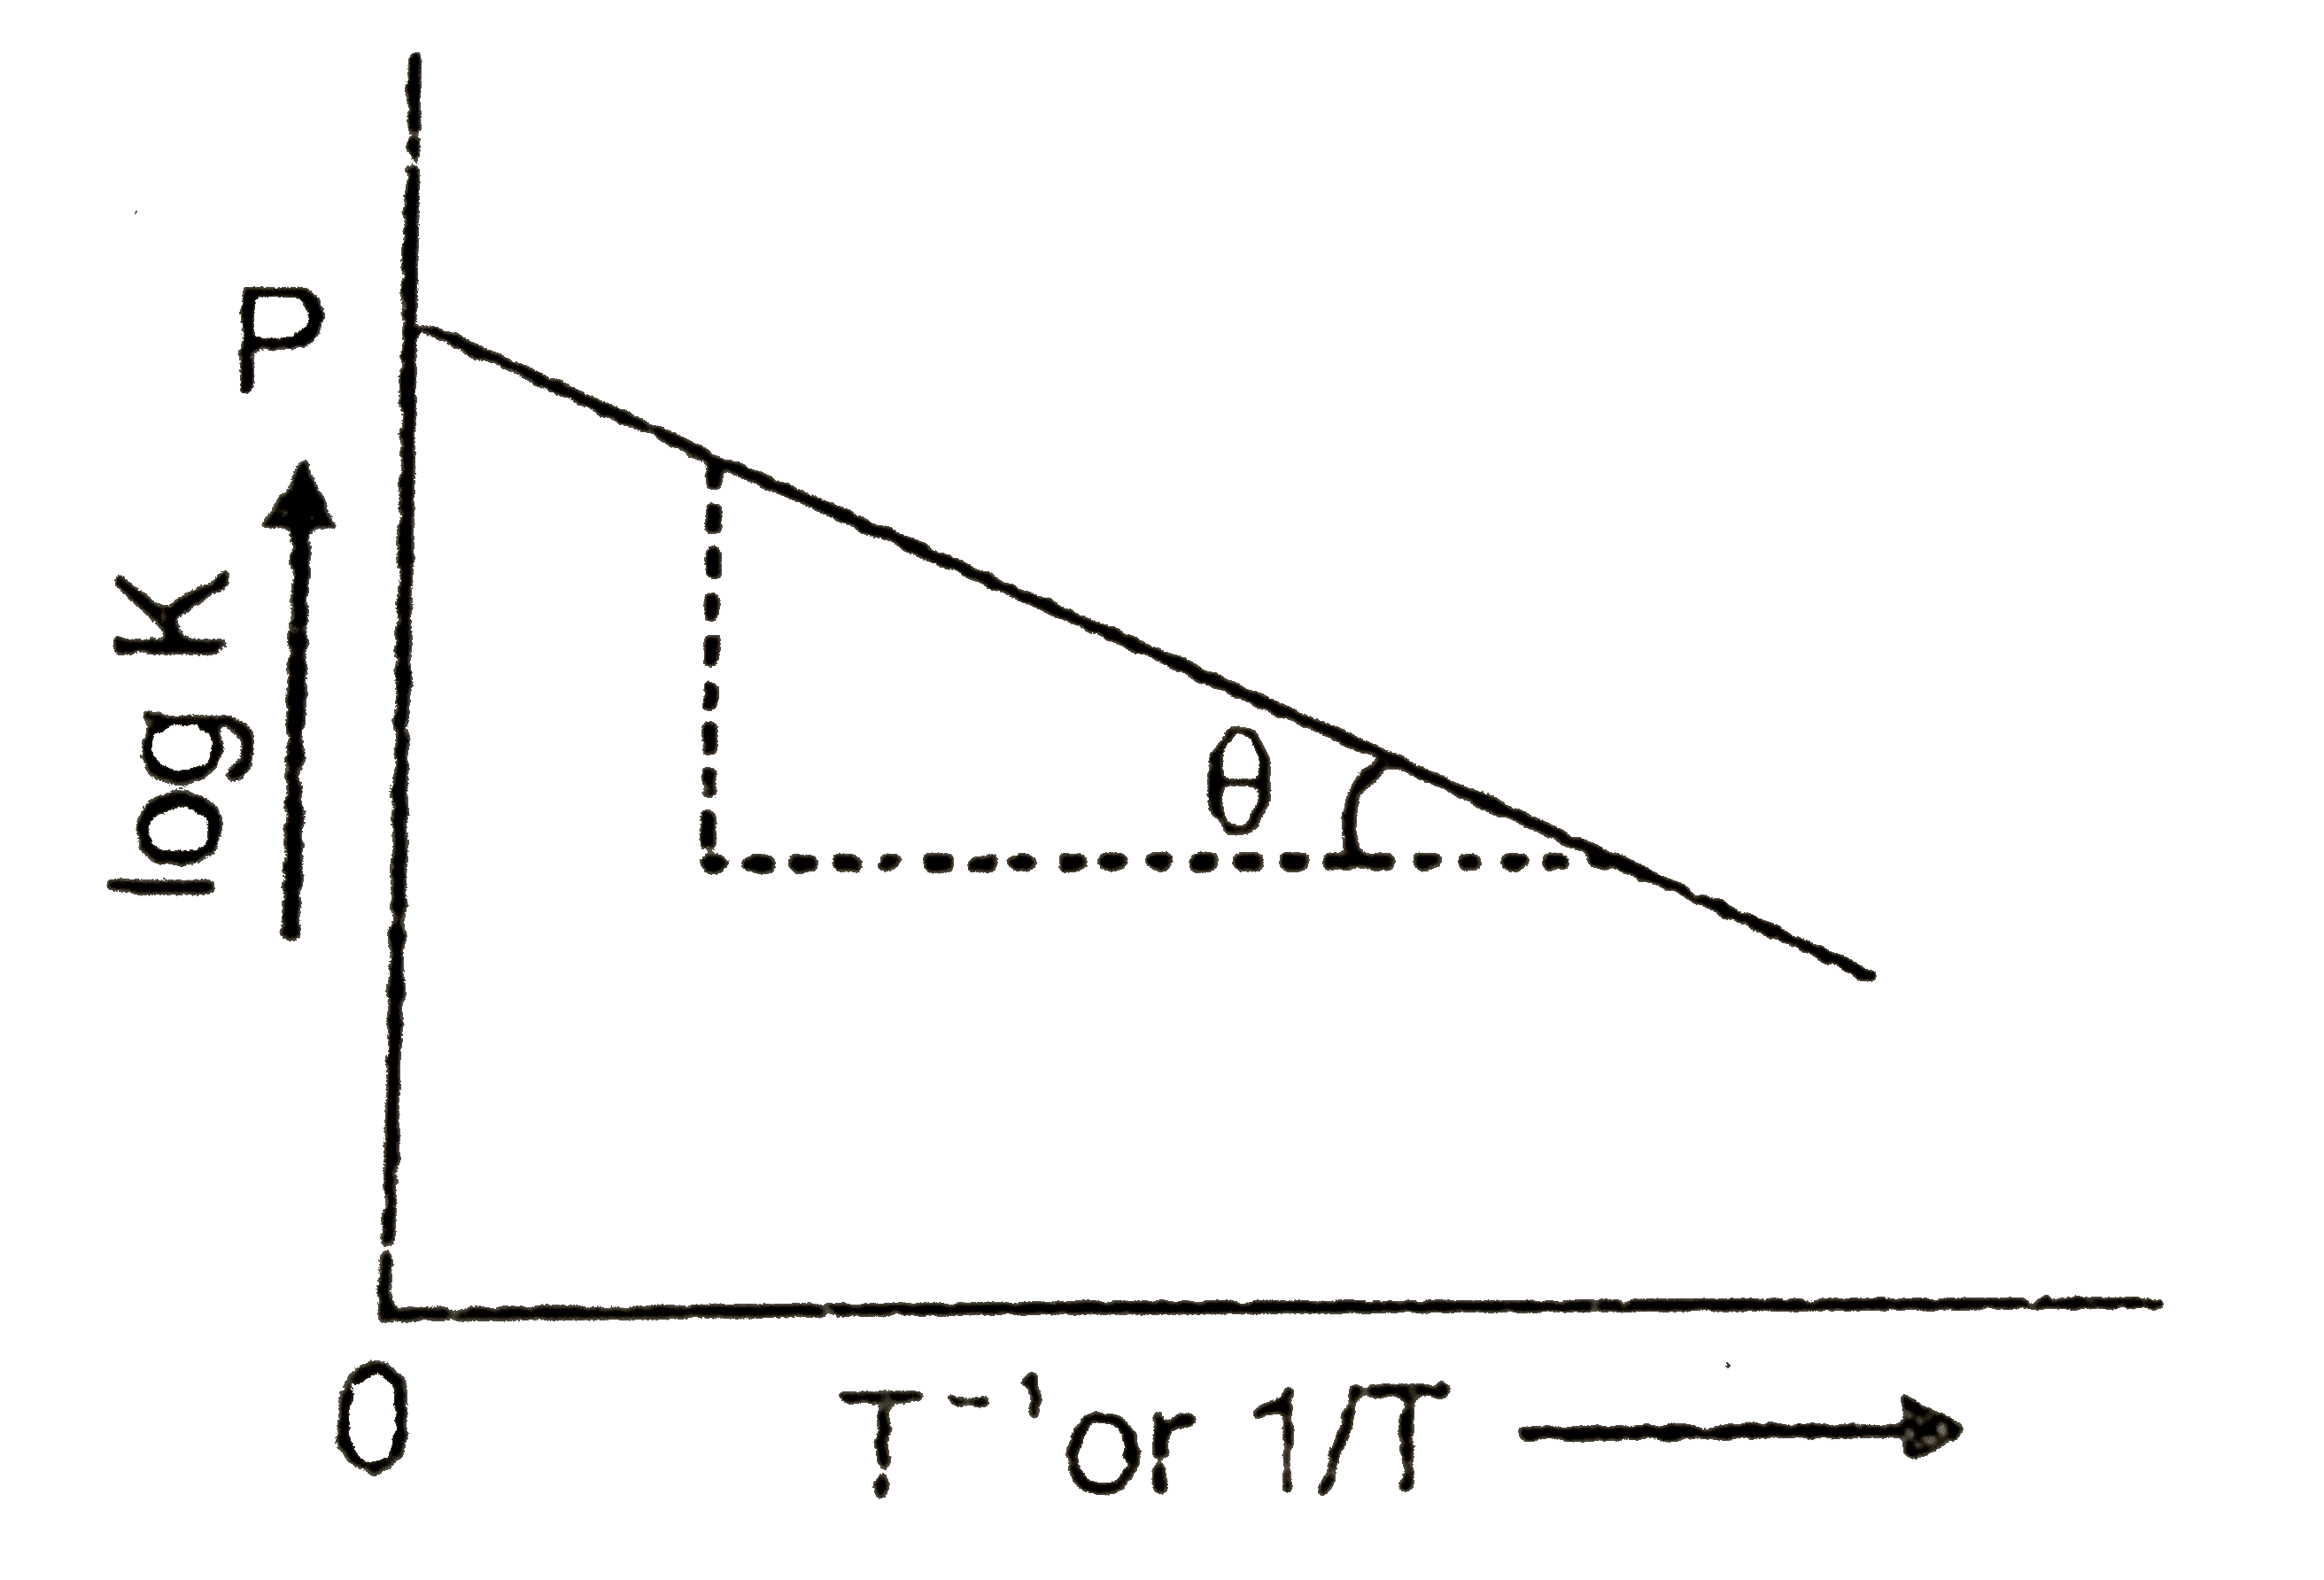
Variation of equiibrium constant K with temperature T is given by van 't Holf equation,
logK=logA−ΔH∘2.303RT
A graph between log K and T−1 was a straight line as shown in the figure and having θ=tan−1(0.5)andOP=10. Calculate:
(a) ΔH∘ (standard heat of reaction)when T=300K,
(b) A (pre-exponetial factor),
(c) Equilibrium constant K at 300K,
(d) Kat900KifΔH∘ is independent of temperature.
 View Solution
Collision Theory || Arrhenius Equation and Variation OF Rate Constant With Temperature
View Solution
Knowledge Check
- Question 1 - Select One
Plots showing the variation of the rate constant (k) with temperature (T) are given below. The plot that follows the Arrhenius equation is
A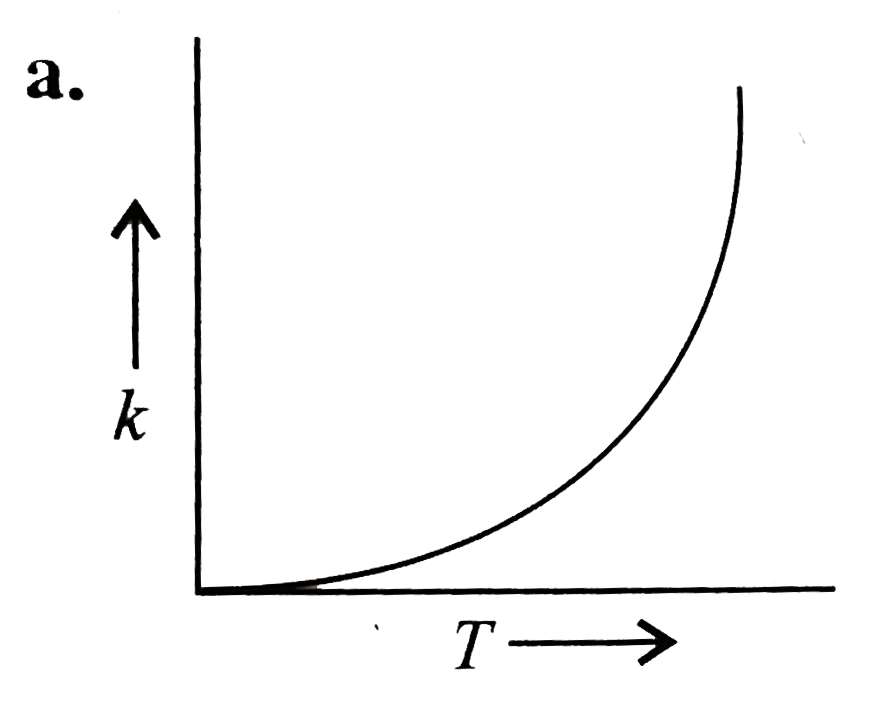 B
B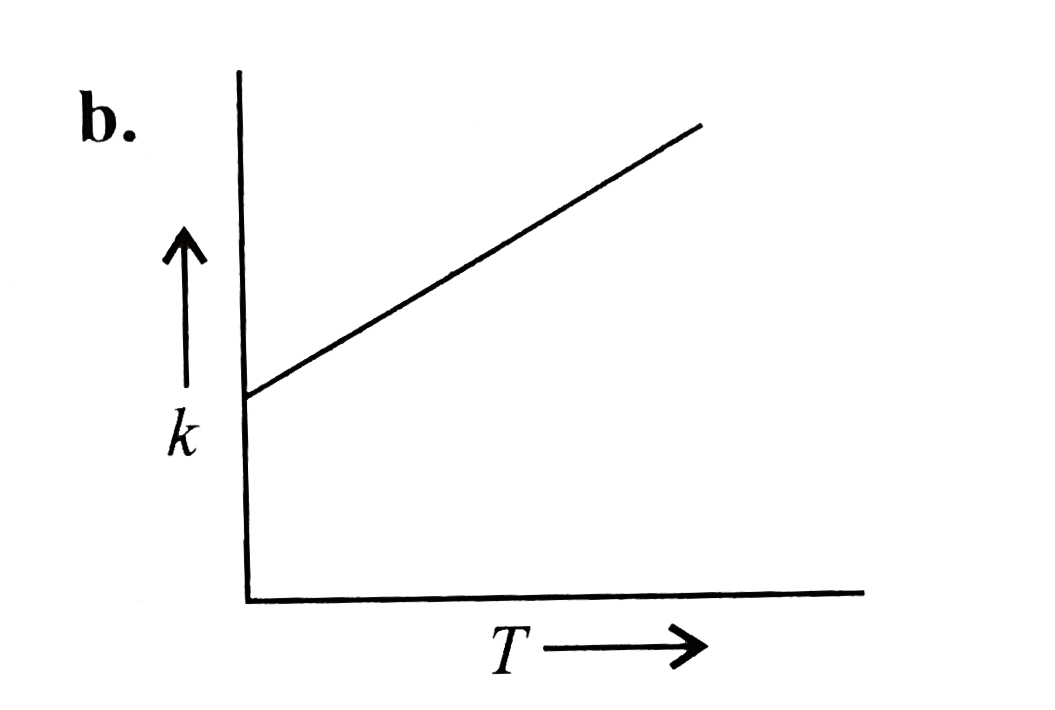 C
C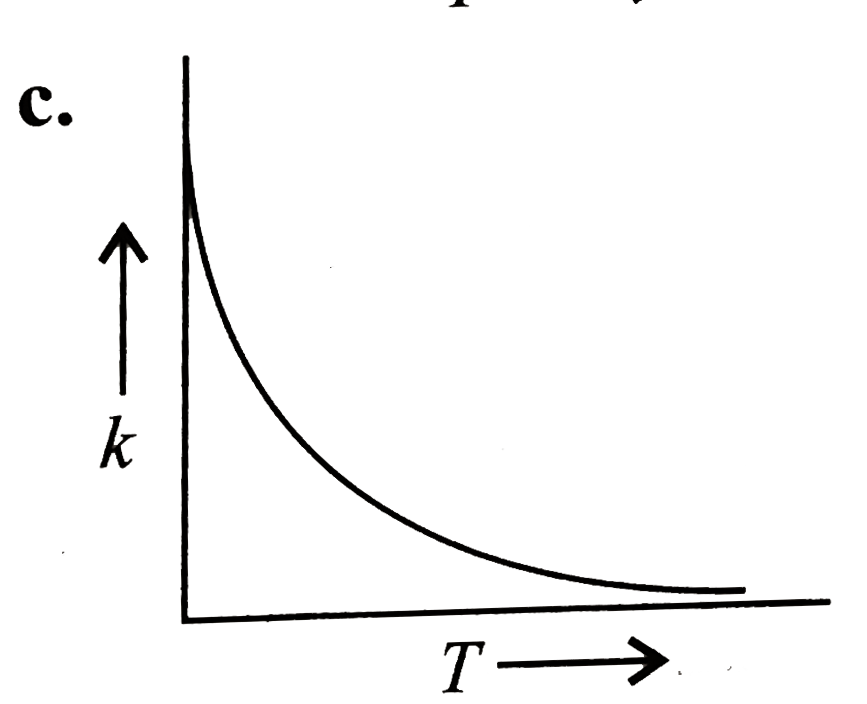 D
D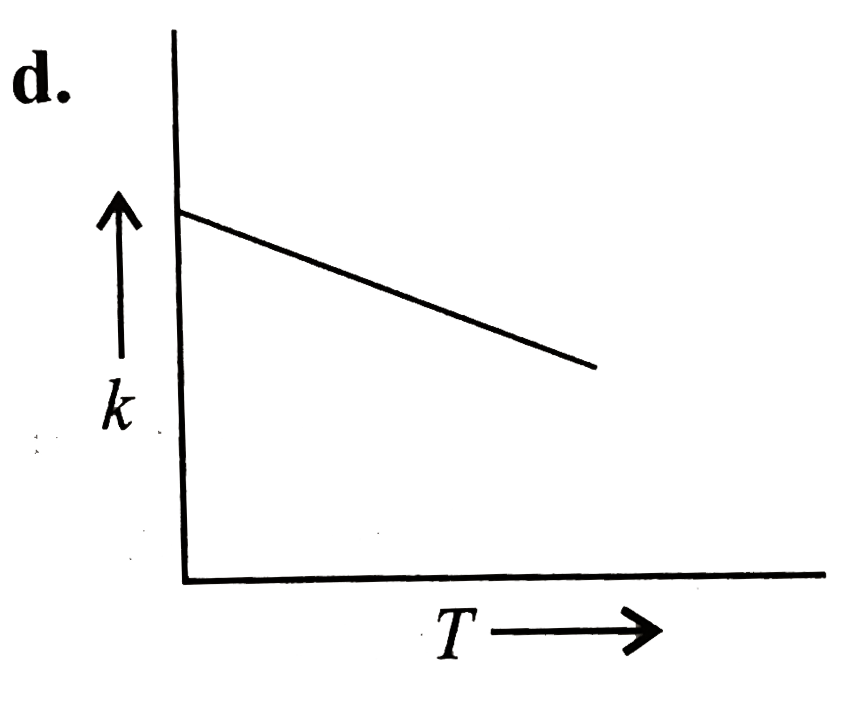
- Question 2 - Select One
Plots showing the variation of the rate constant (k) with temperature (T) are given below. The plot that follows the Arrhenius equation is
A B
B C
C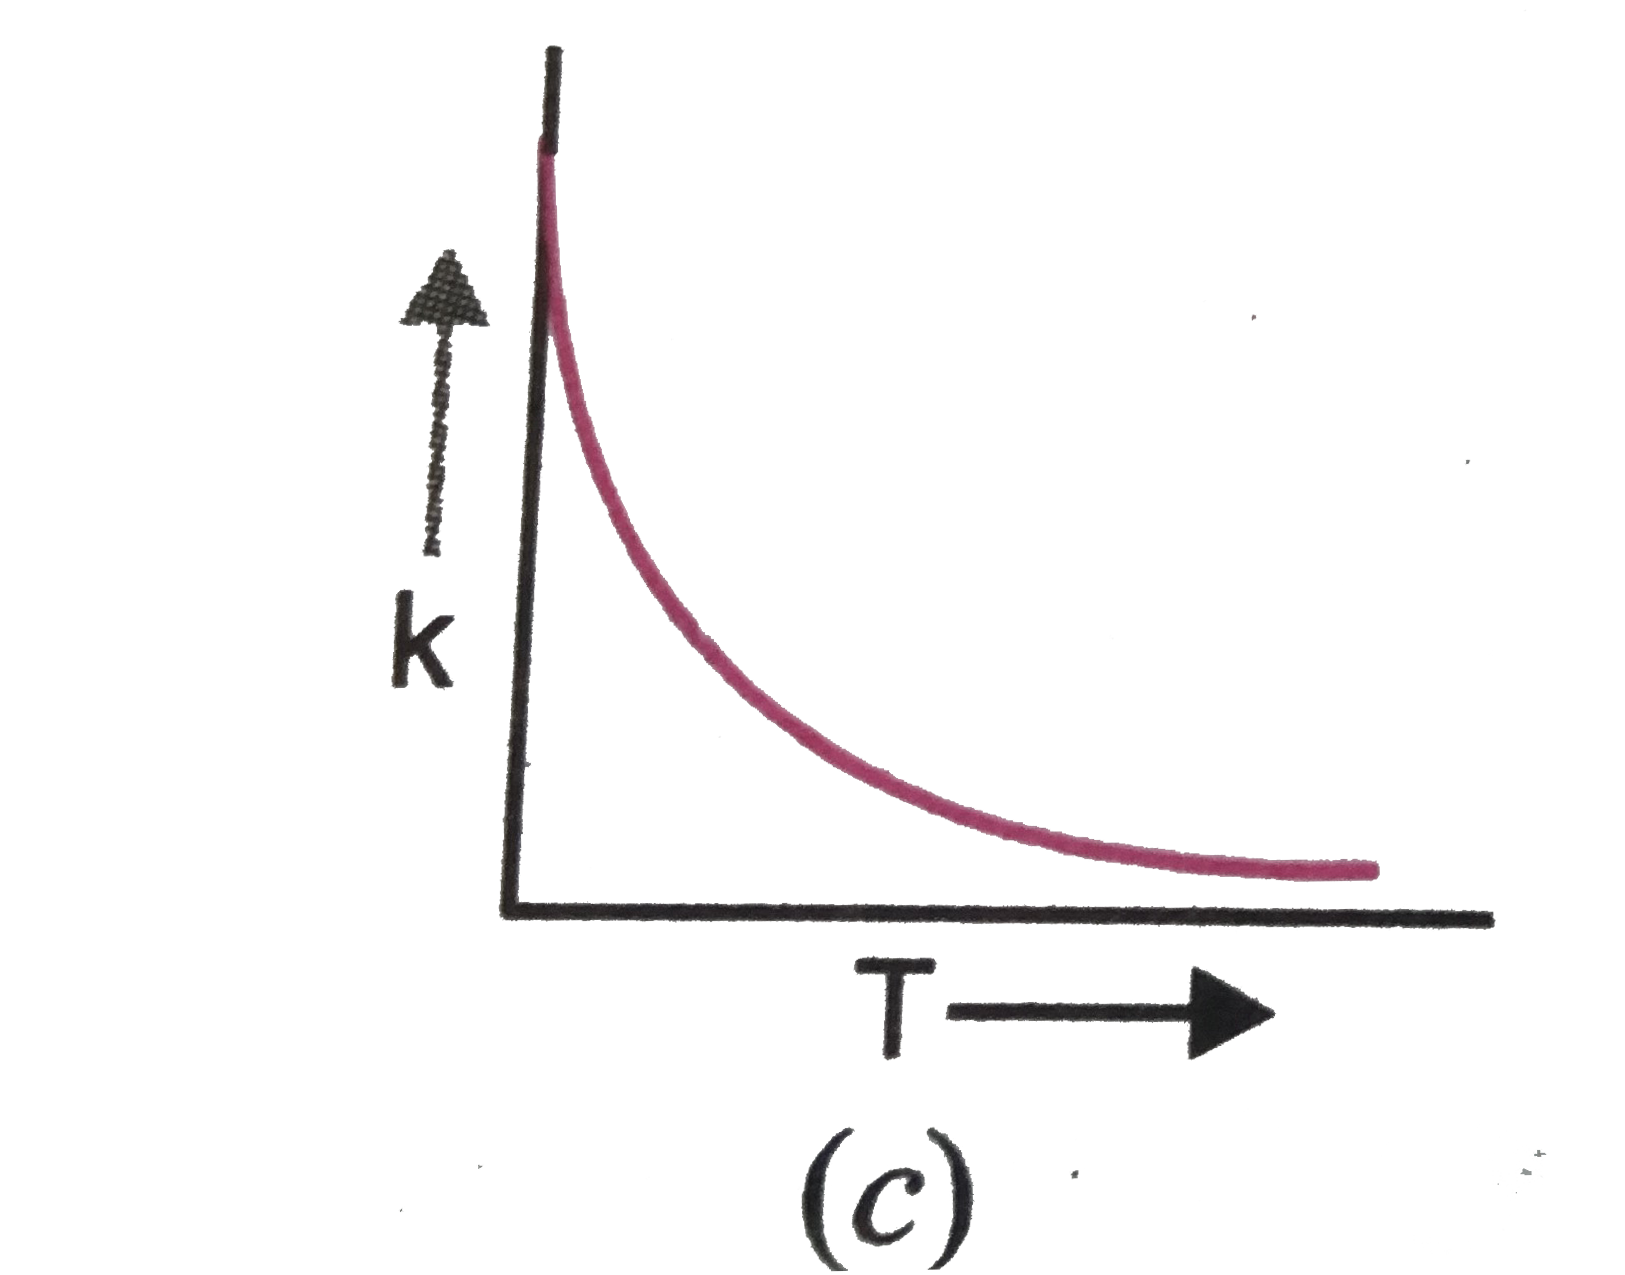 D
D
- Question 3 - Select One
Plots showing the variation of the rate constant (k) with temperature (T) are given below. The plot that follows Arrhenius equations is
A B
B C
C D
D
Which one of the following given graphs represents the variation of rate constant (k) with temperature (t) for an endothermic reaction ?
View SolutionTemperature Coefficient || Variation OF Equilibrium Constant with Temperature || Factors Affecting Rate OF Reaction
View SolutionPlots showing the variation of the rate constant (k) with temperature (T) are given below. The plot that follows the Arrhenius equation is
View SolutionWhich of the following curve represent variation of density of water with temperature best-
View SolutionThe variation of K and kfKb with temperature shows the following effects:
View Solution

