Diagrams W, X and Y show how the particles of a substance are packed at different temperatures.

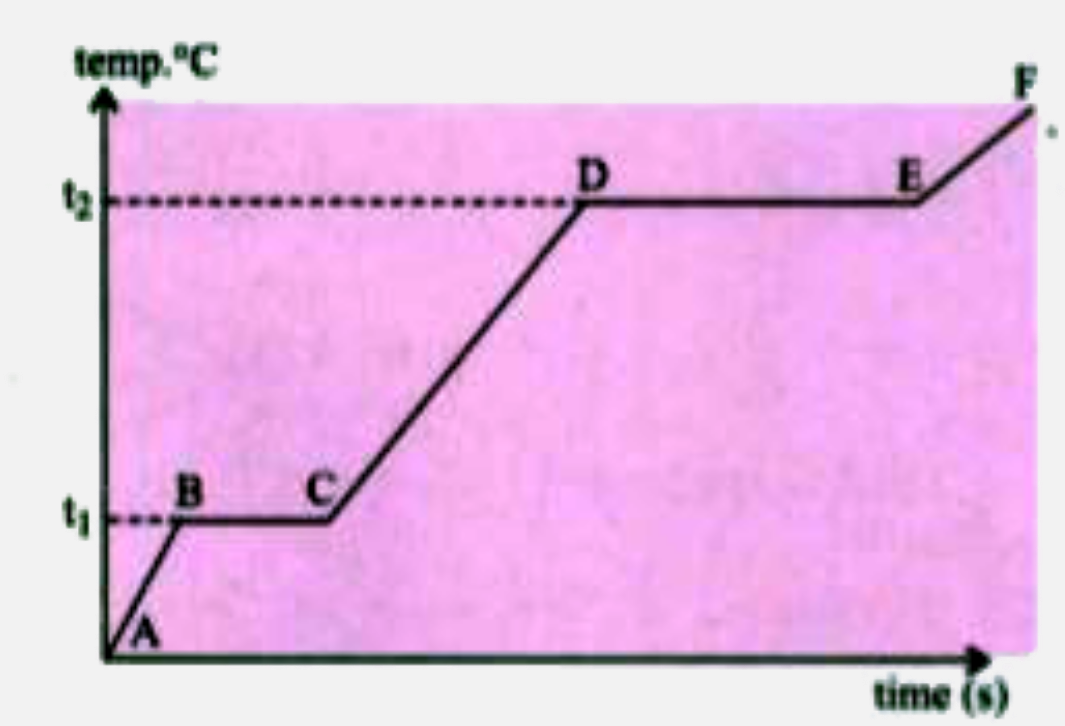
The given graph shows changes in the state of a substance on heating. In which region of the graph would all the particles be packed as in Y?
I
II
III
IV
The correct Answer is:C
The given graph represents heating curve in which state of a substance changes from solid to liquid to gas.

In the given diagrams, W is a gas, X is a solid and Y is a liquid. Thus, in the region III, all the particles would be packed as in Y.
Topper's Solved these Questions
- MATTER IN OUR SURROUNDINGS BOOK - MTG IIT JEE FOUNDATIONCHAPTER - MATTER IN OUR SURROUNDINGS EXERCISE - EXERCISE (INTEGER/NUMERICAL VALUE) LEVEL - 2
5 Videos
- IS MATTER AROUND US PURE ?BOOK - MTG IIT JEE FOUNDATIONCHAPTER - IS MATTER AROUND US PURE ?EXERCISE - OLYMPIAD/ HOTS CORNER
20 Videos
- PERIODIC CLASSIFICATION OF ELEMENTS BOOK - MTG IIT JEE FOUNDATIONCHAPTER - PERIODIC CLASSIFICATION OF ELEMENTS EXERCISE - EXERCISE (INTEGER/NUMERICAL VALUE)
4 Videos
Similar Questions
The diagram below shows the change of phases of a substance on a temperature vs time graph on heating the substance at a constant rate.

What is the boiling and melting point of the substance ?
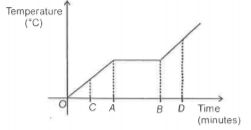
View SolutionFor the following temperature-time graph, in which region the state of material changes

View Solution
Knowledge Check
Which of the graph shows that the particle is at rest .
A B
B C
C D
D
The given figures show arrangement of particles of a substance X at different temperatures.

Which of the following statements is correct?AThe boiling point of the substance X is between 75∘C and 125∘C.BThe melting point of the substance X is below 75∘C.CParticles of substance X at 125∘C have more kinetic energy than at 75∘C.DAll of theseWhich of the graph shows a particle with retardation?
A B
B C
C D
D
The diagram below shows the change of phases of a substance on a temperature vs time graph on heating the substance at a constant rate.

Why is the slope of CD less than slope of AB ?
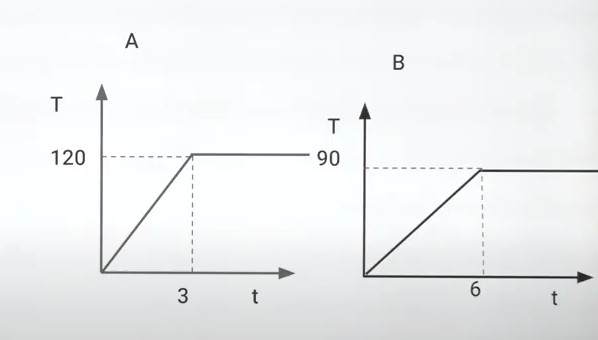
View SolutionTemperature vs. time graphs are given below for 2 substances. Compare specific heat capacity

View SolutionHeat changes the arrangement of particles in a substance when there is a change of state.
View SolutionFor the following temperature-time graph, in which region the state of material changes

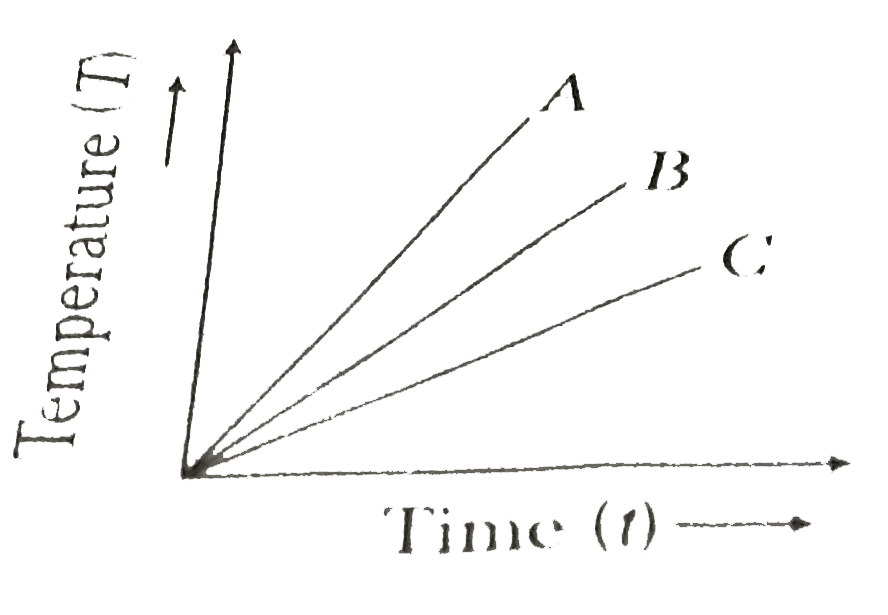
View SolutionThe temperatures versus time graph is shown in figure. Which of the substance A,B and C has the lowest heat capacity if heat is supplied to all of them at equal rates.

View Solution
