Which of the given graphs correctly represents the variation of g on earth?
A
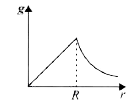
B
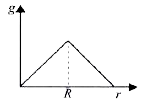
C
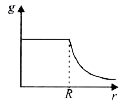
D
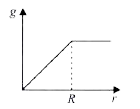
Text Solution
The correct Answer is:A
Below the surface of the earth g∝r above the surface of the earth, g∝1r2.Therefore, the graph (a) is correct.
|
Topper's Solved these Questions
- GRAVITATION Book:MTG IIT JEE FOUNDATIONChapter:GRAVITATION Exercise:Exercise (Multiple Choice Questions) (LEVEL - 2)
Explore 20 Videos
- GRAVITATION Book:MTG IIT JEE FOUNDATIONChapter:GRAVITATION Exercise:Exercise (Match the following)
Explore 4 Videos
- GRAVITATION Book:MTG IIT JEE FOUNDATIONChapter:GRAVITATION Exercise:NCERT Section
Explore 23 Videos
- FORCE AND LAWS OF MOTIONBook:MTG IIT JEE FOUNDATIONChapter:FORCE AND LAWS OF MOTIONExercise:OLYMPIAD /HOTS CORNER
Explore 20 Videos
- MOTIONBook:MTG IIT JEE FOUNDATIONChapter:MOTIONExercise:Olympiad/HOTS Corner
Explore 21 Videos
Similar Questions
Knowledge Check
Which of the following graphs correctly represents the variation of particle momentum with associated de Broglie wavelength?
A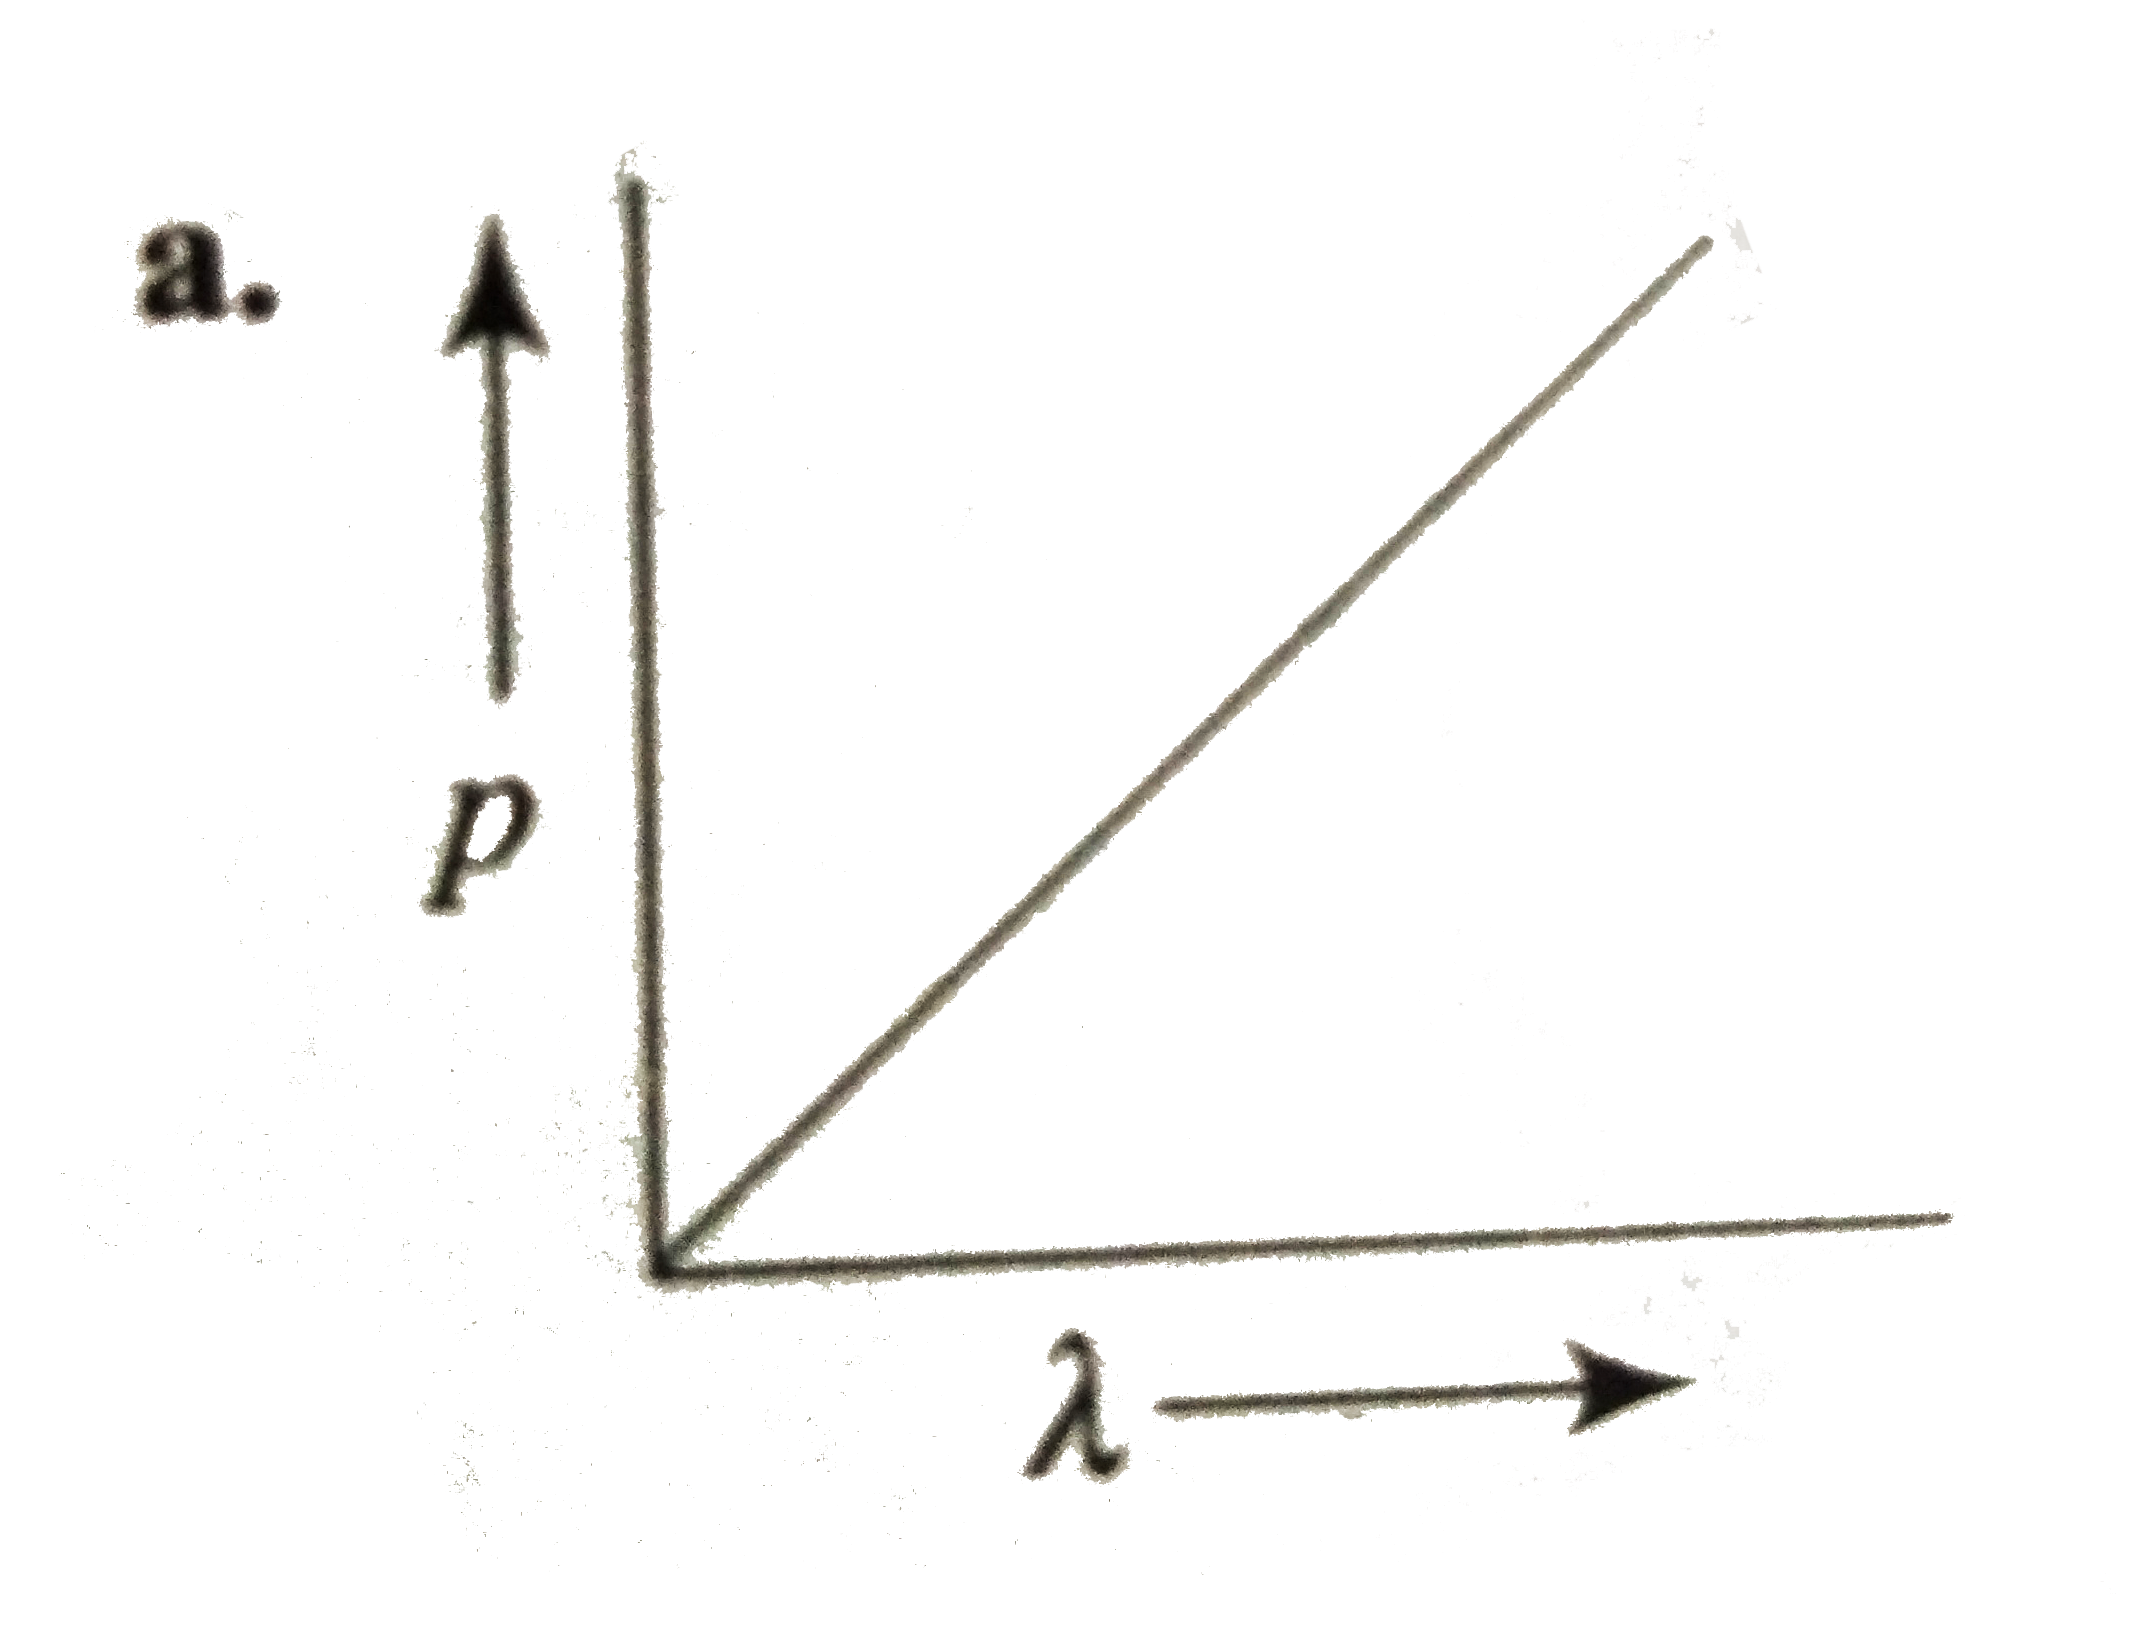 B
B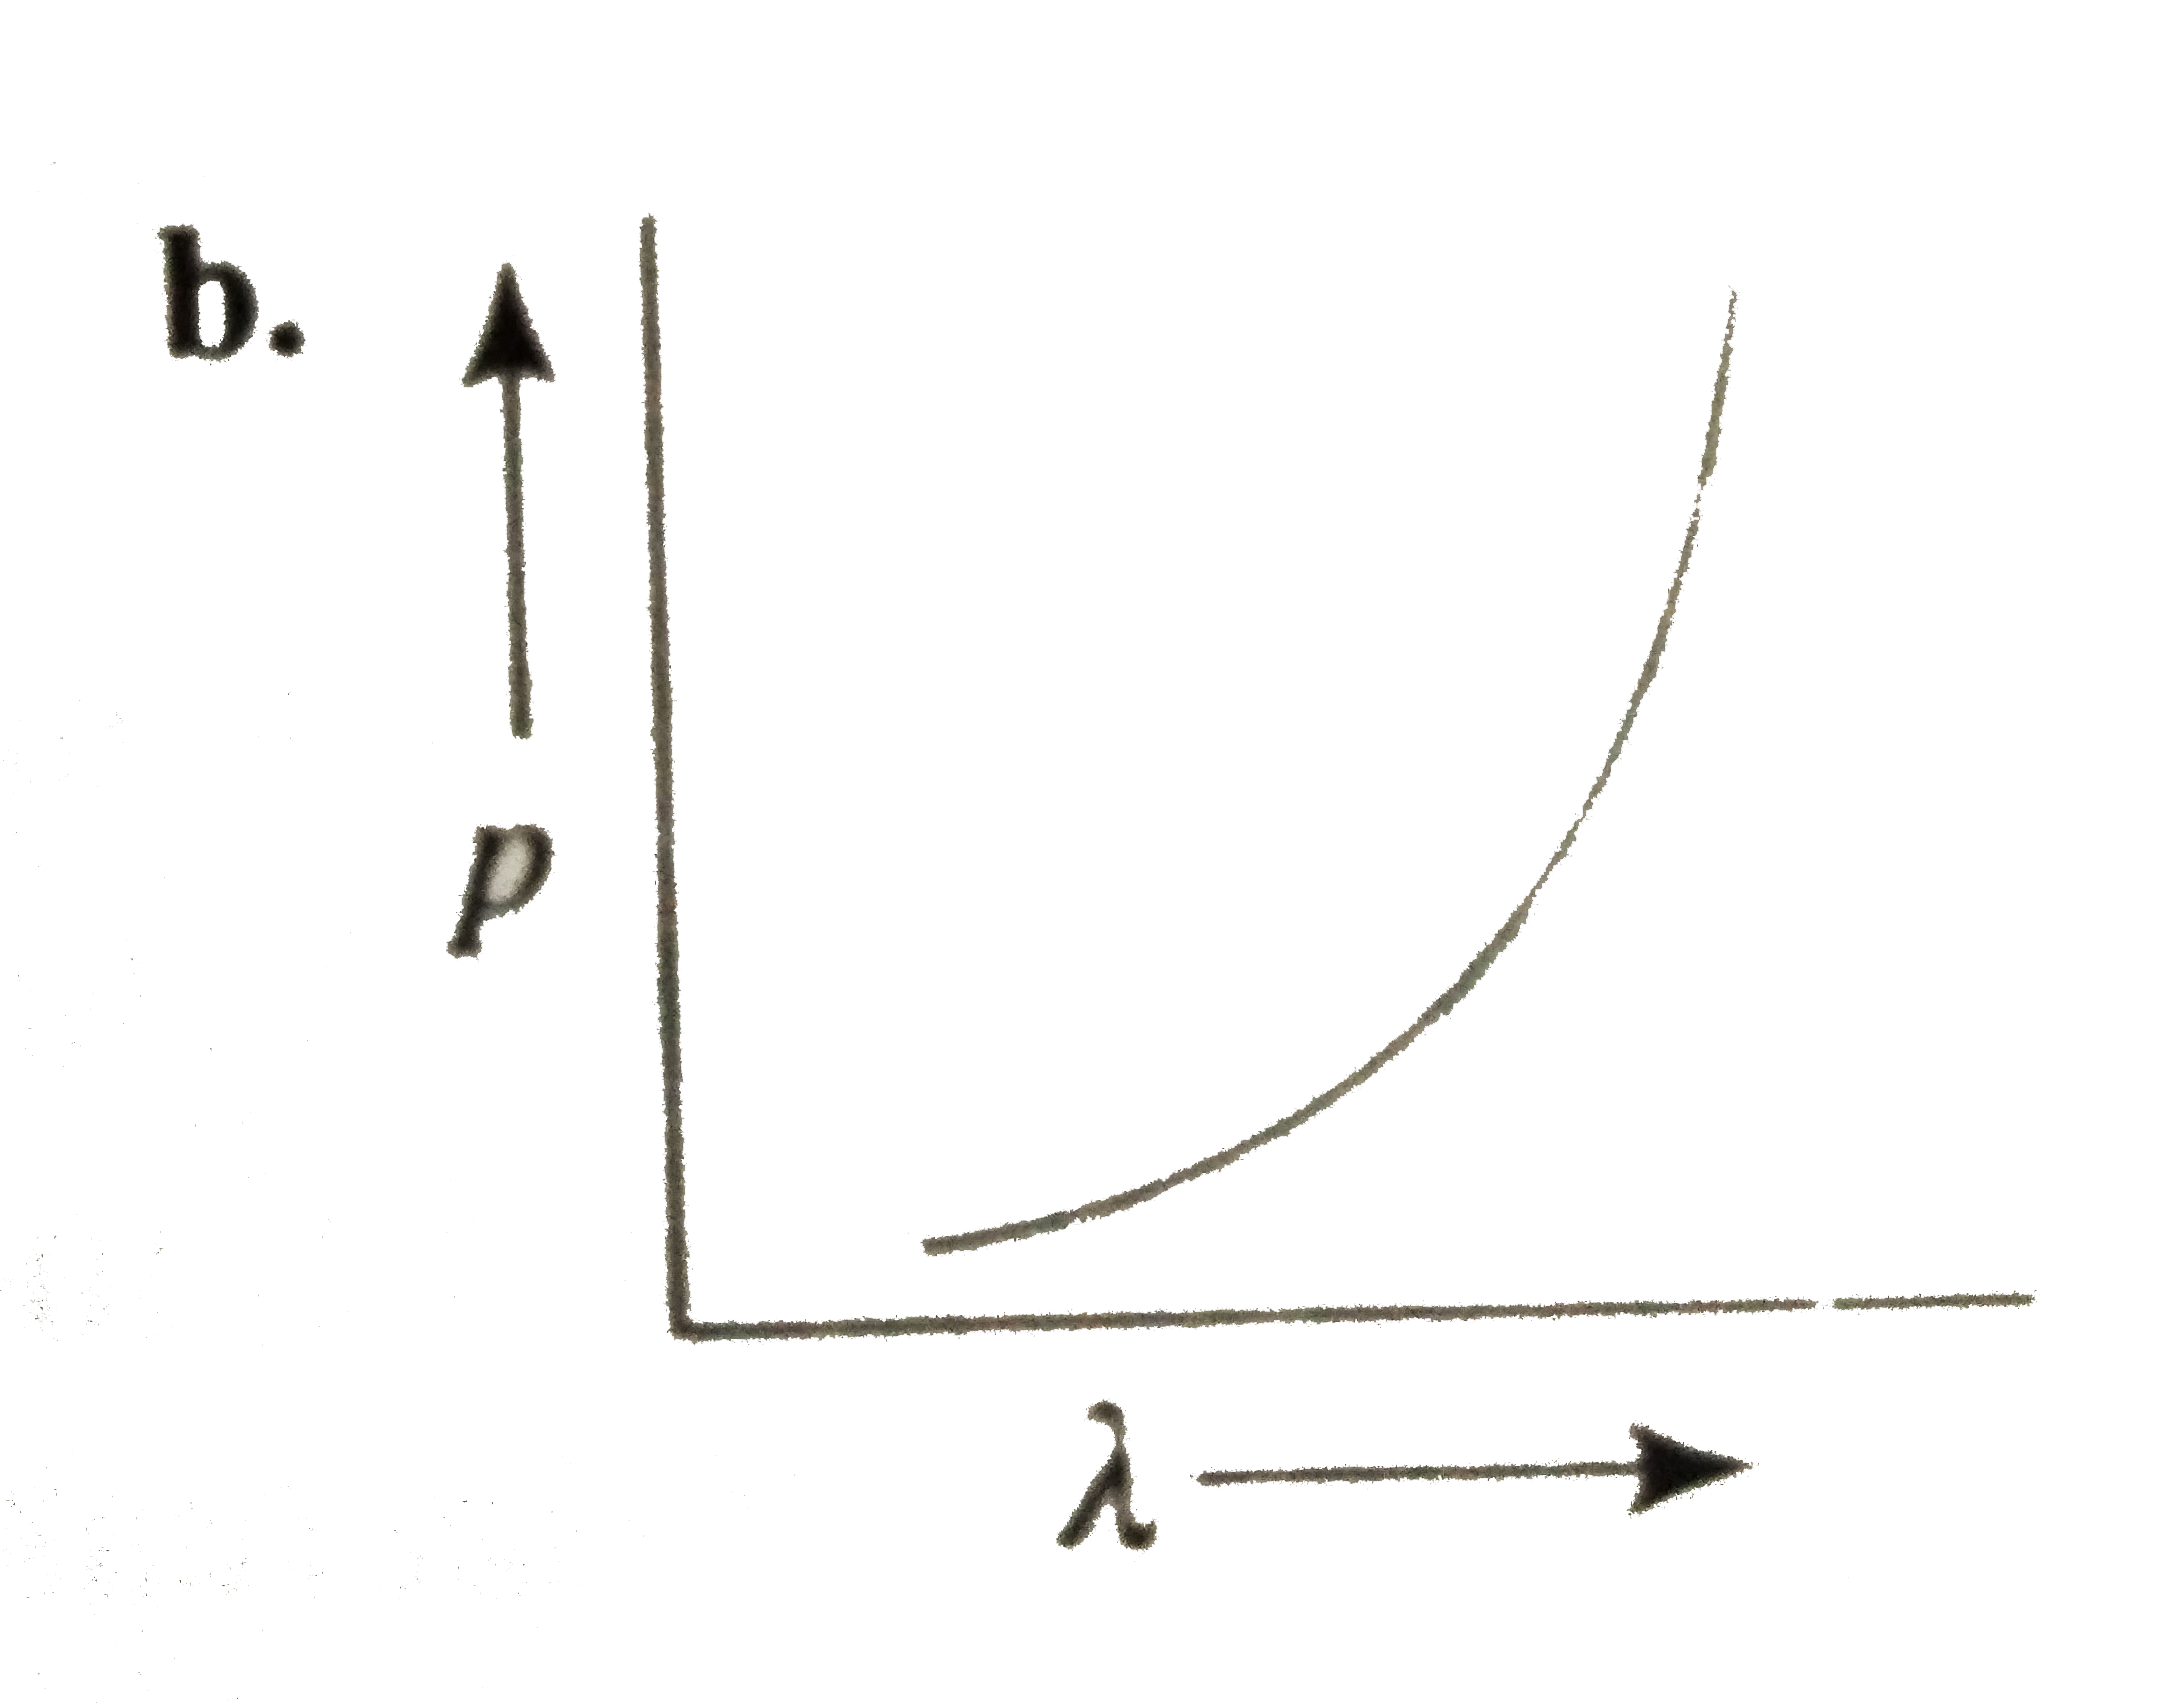 C
C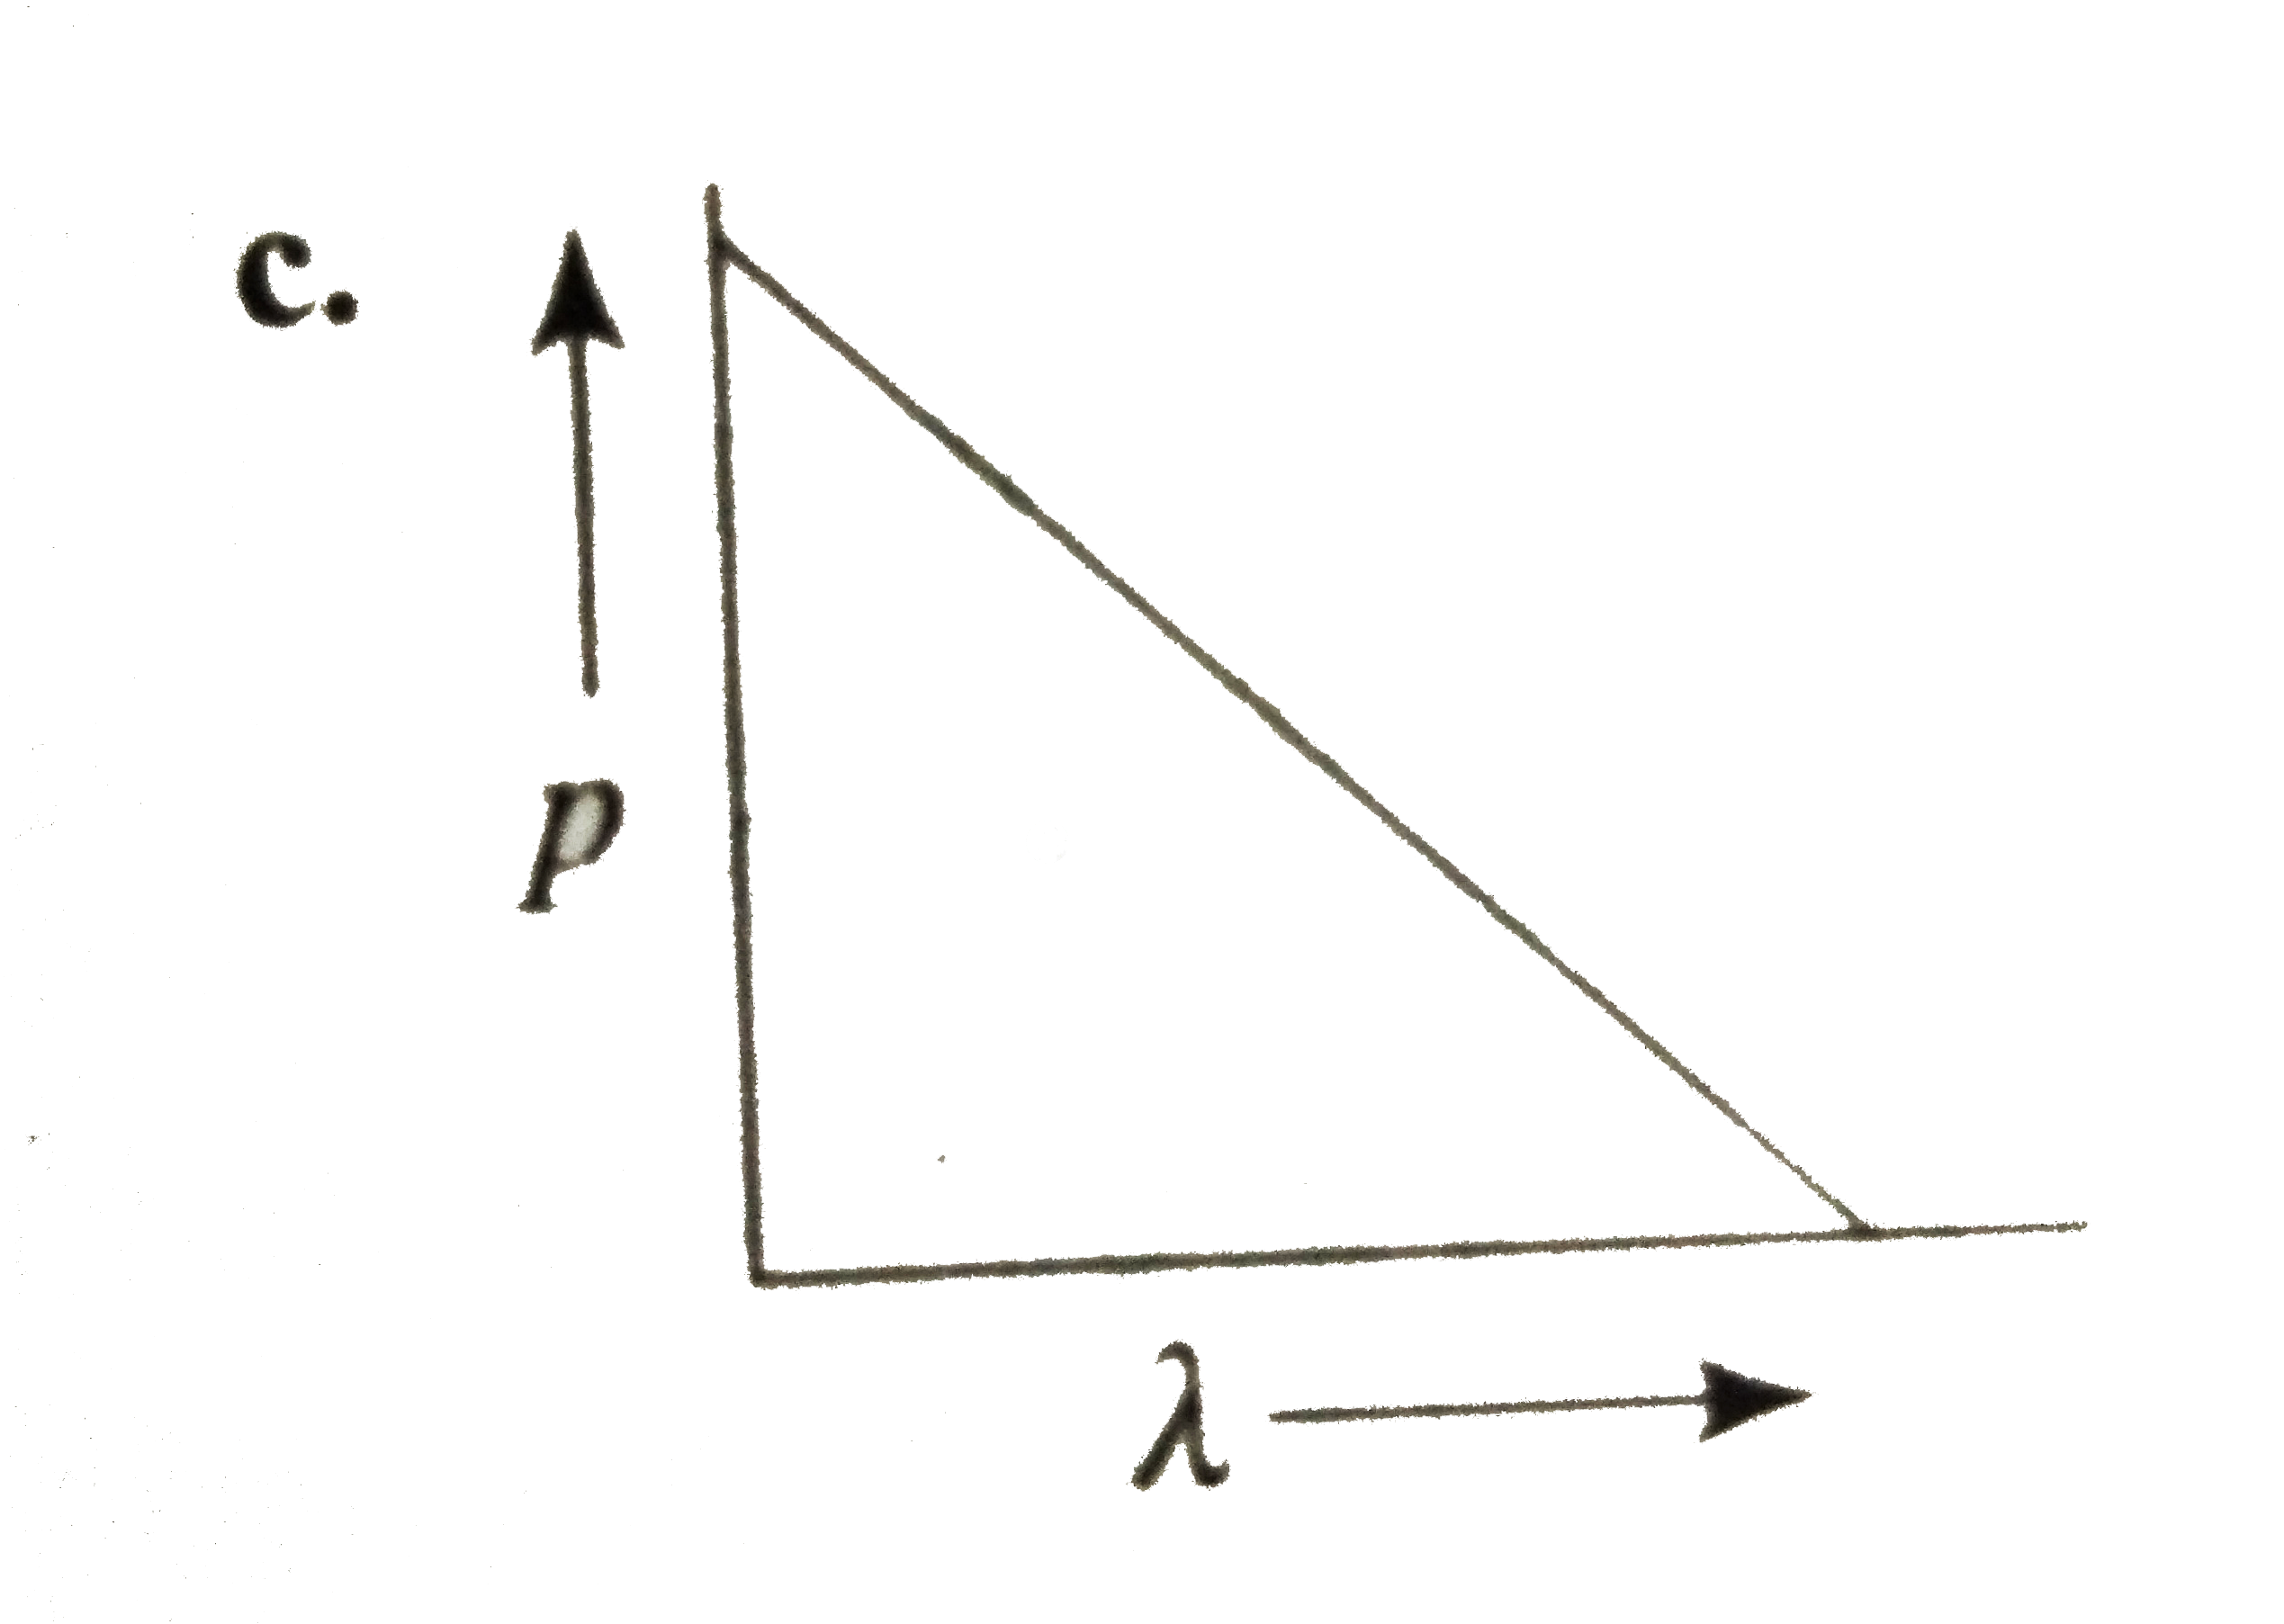 D
D
Which of the following graphs correctly represents the variation of β=−(dVdP)/V with P for an ideal gas at constant temperature
A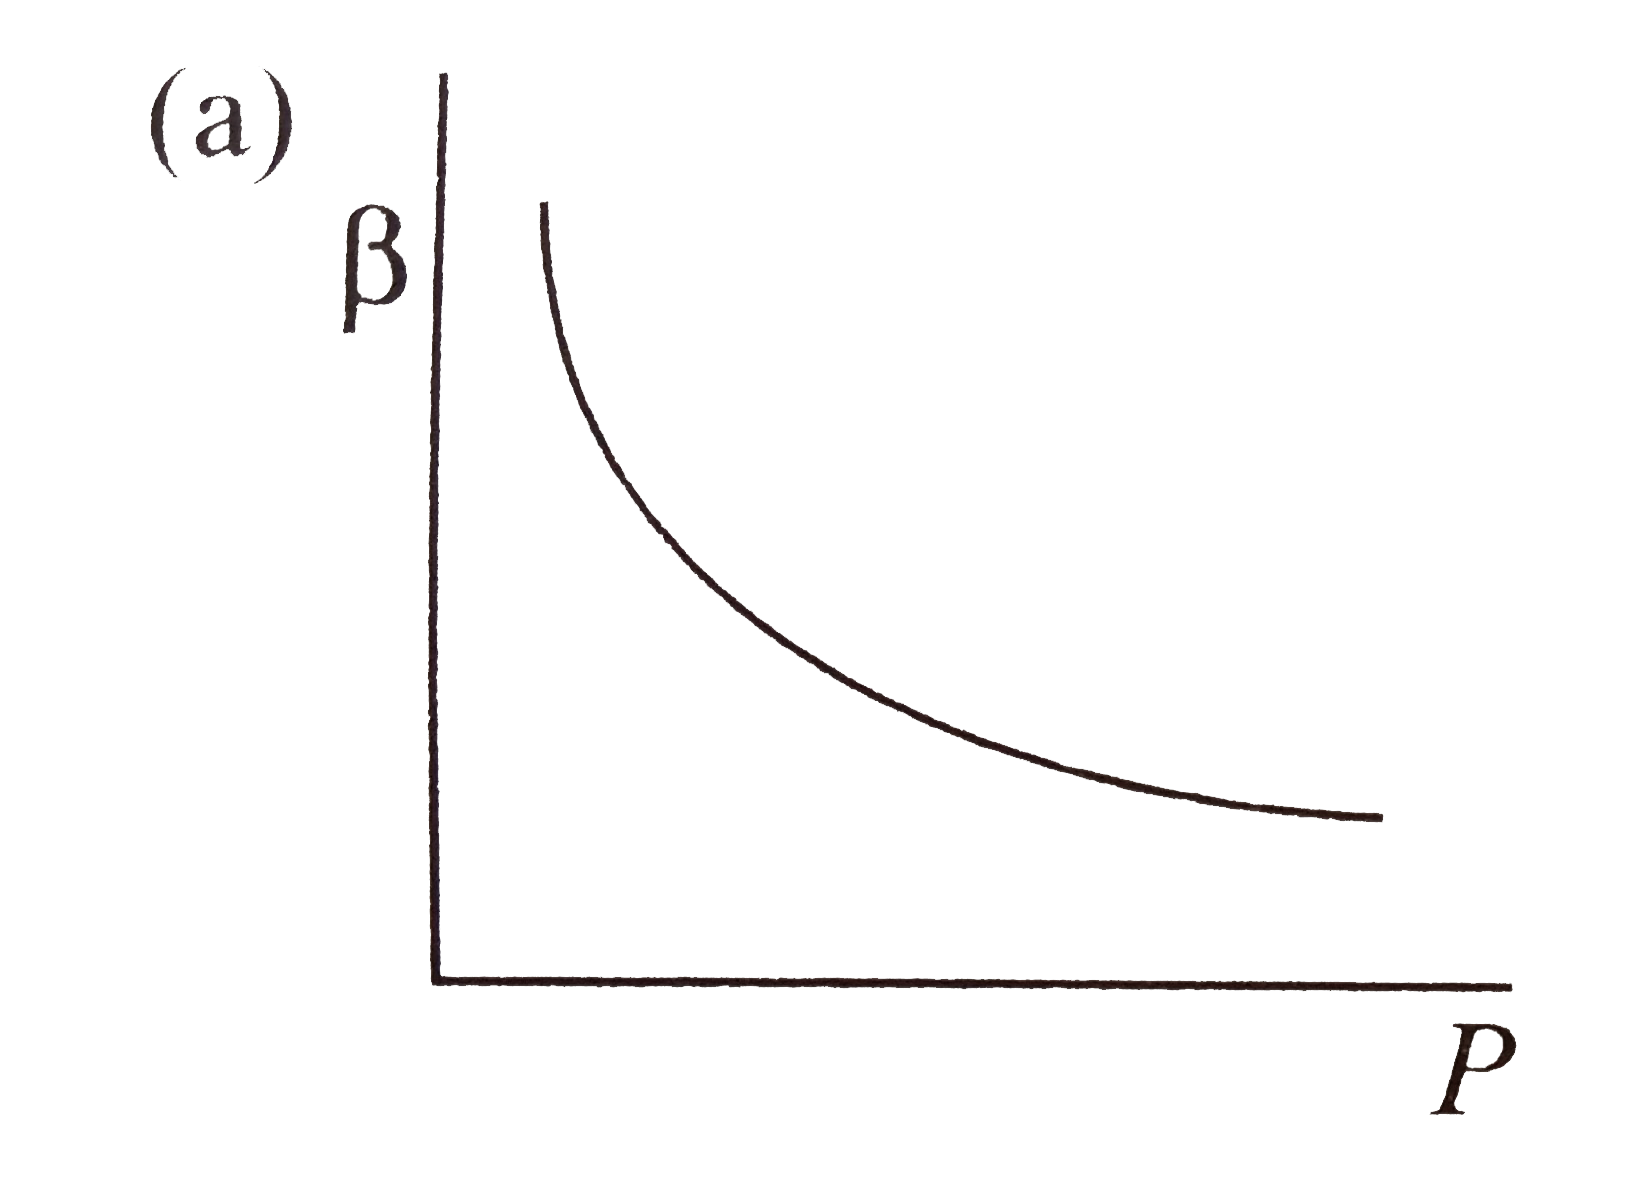 B
B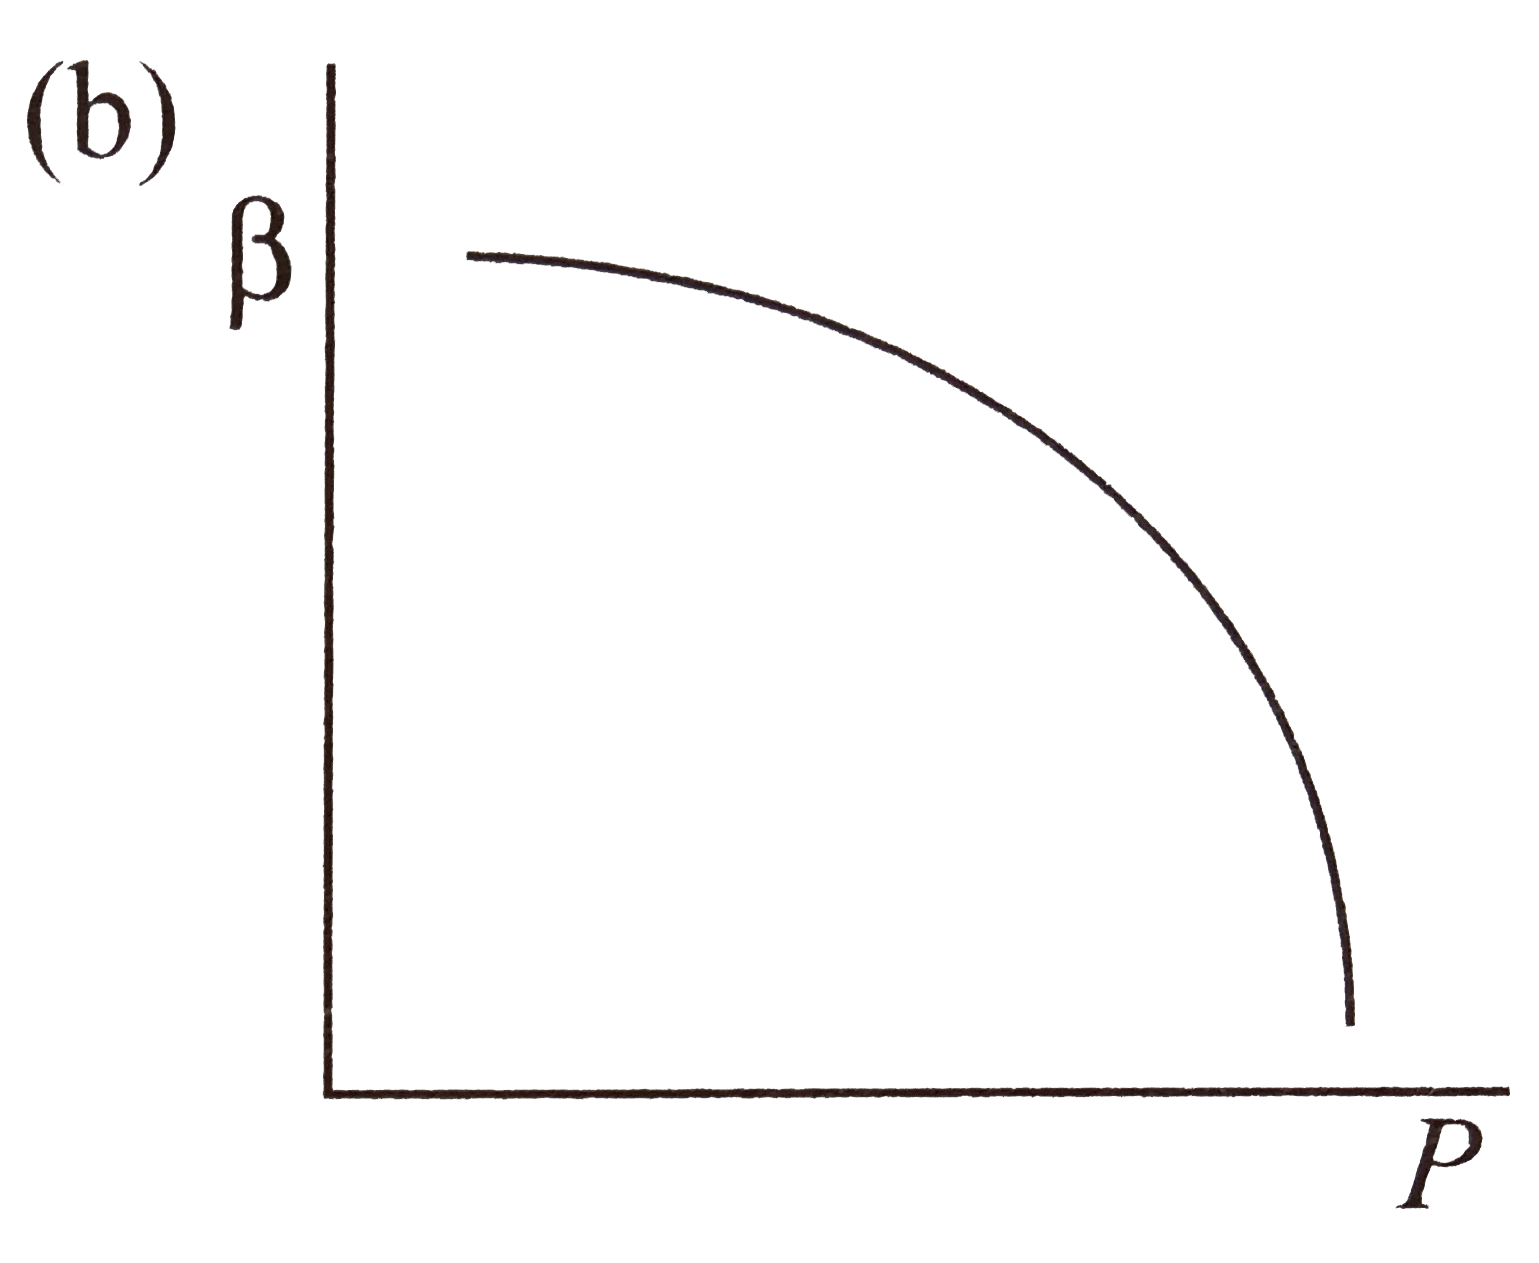 C
C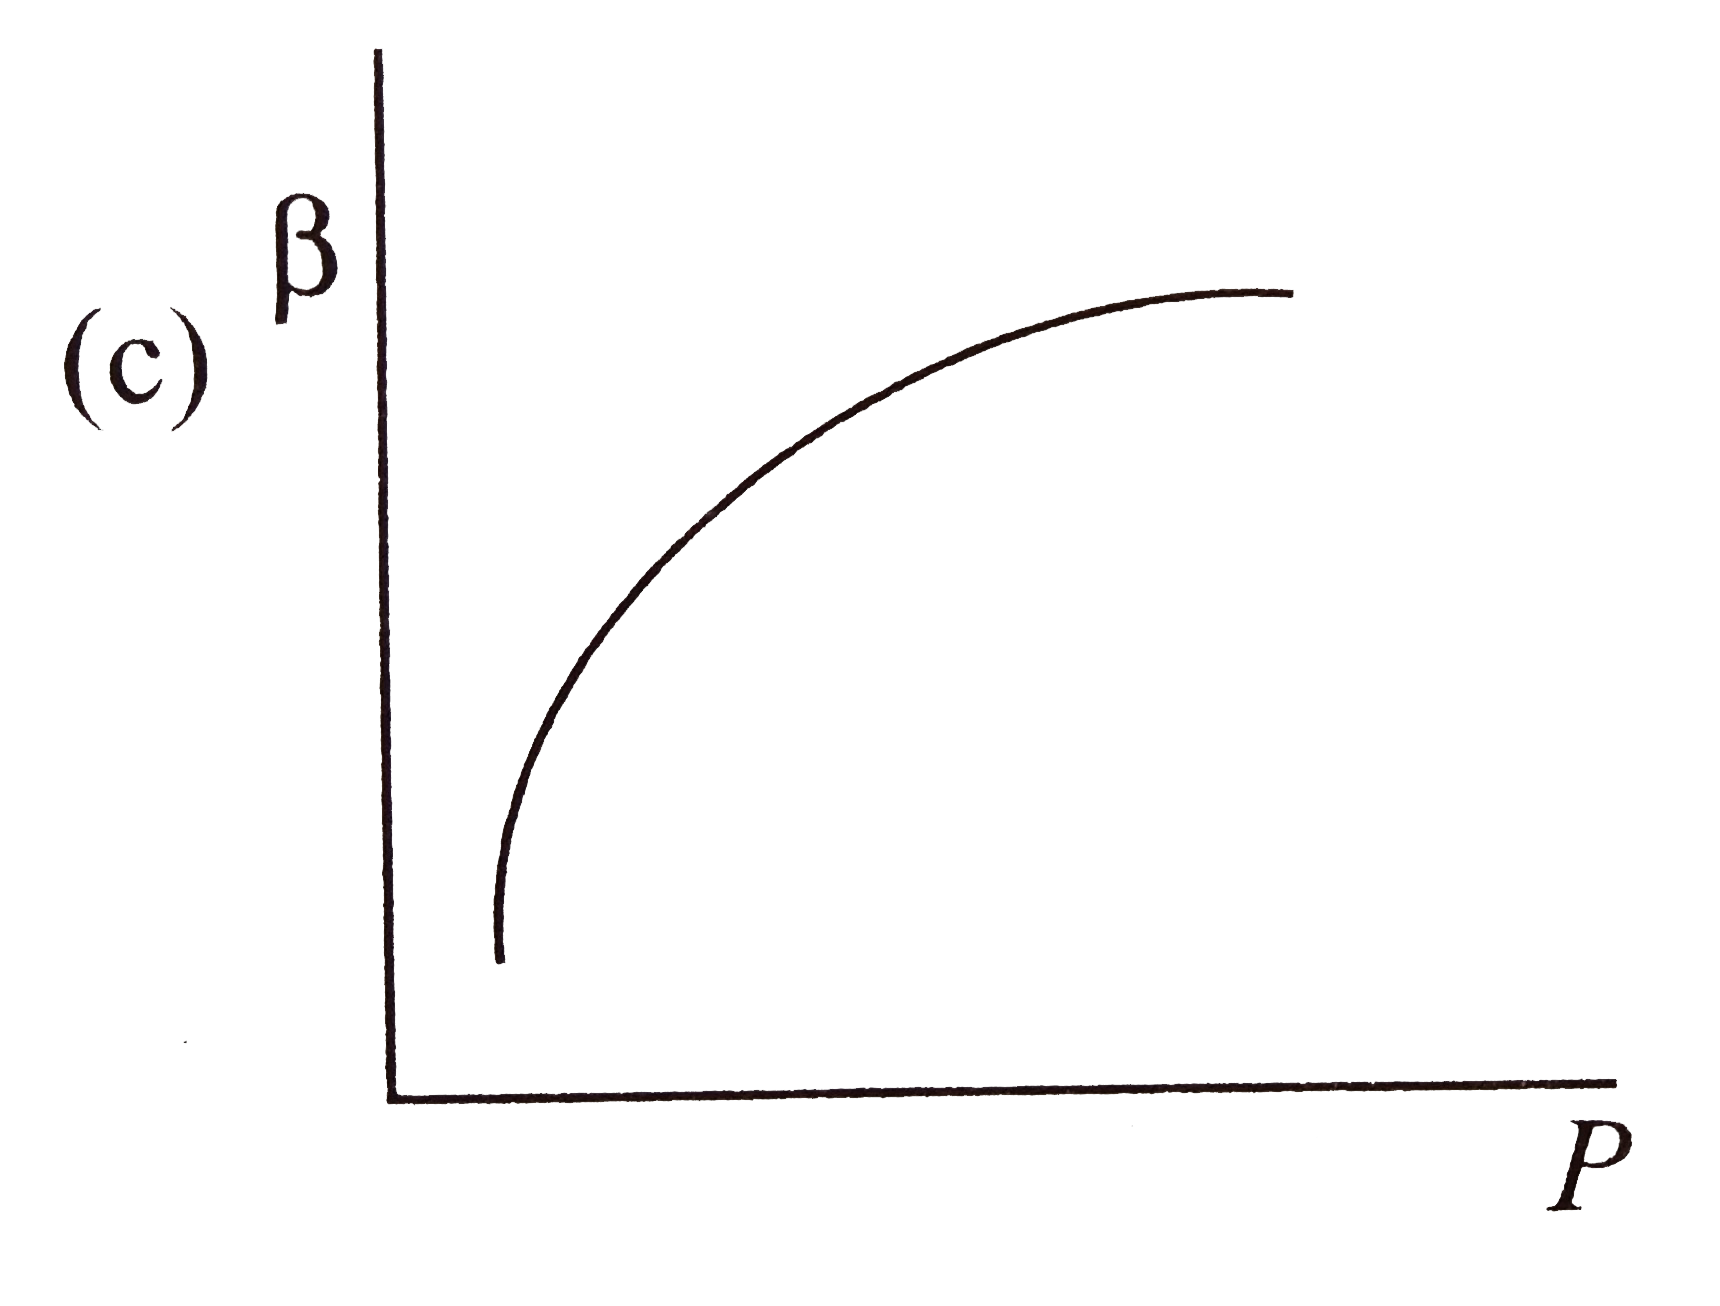 D
D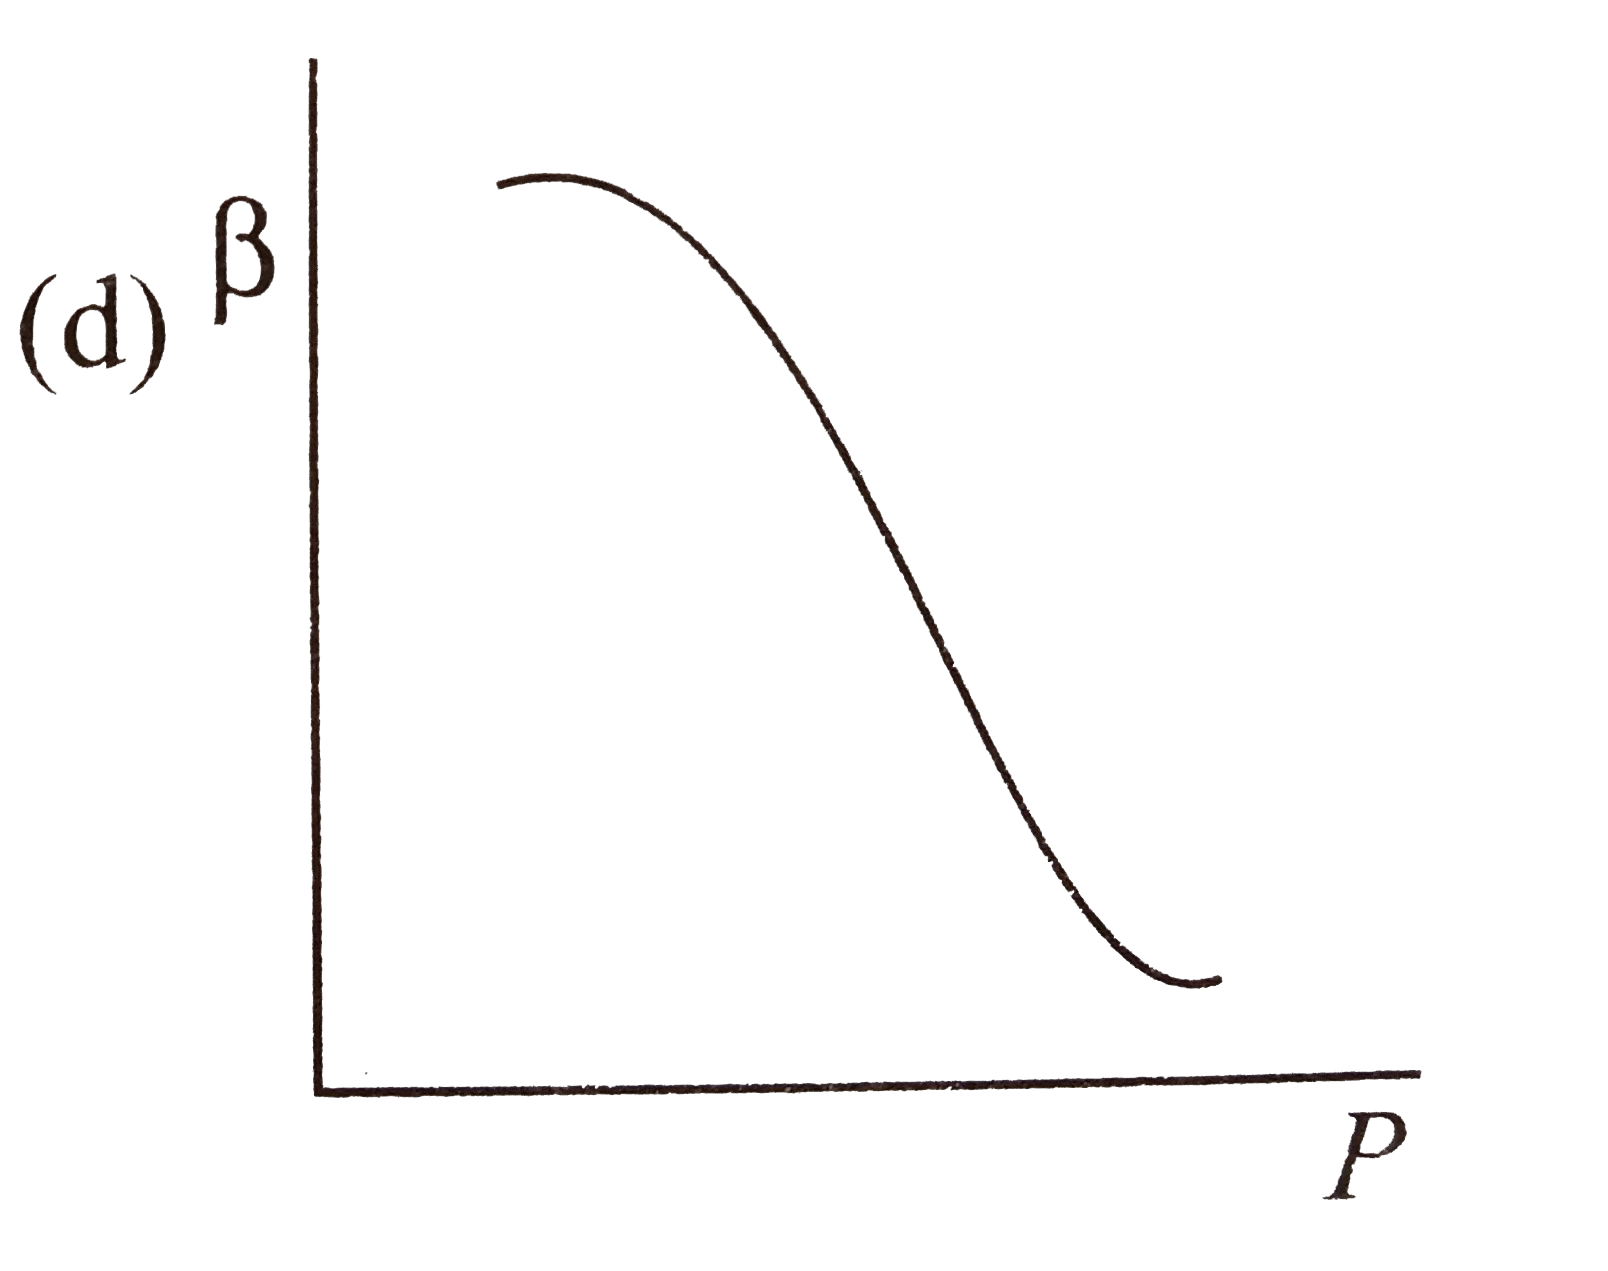
Which of the following graphs correctly represents the variation of β=−dV/dPV
with P for an ideal gas at constant temperature?A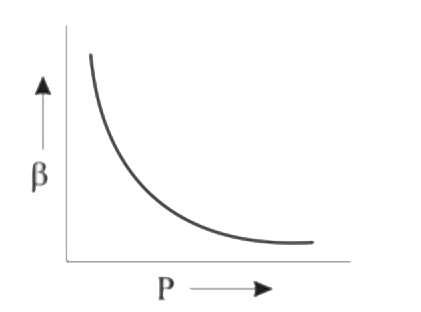 B
B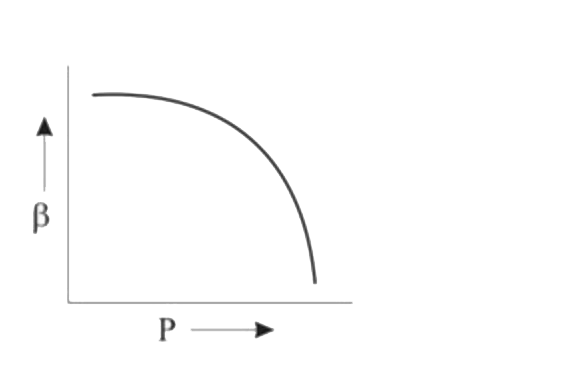 C
C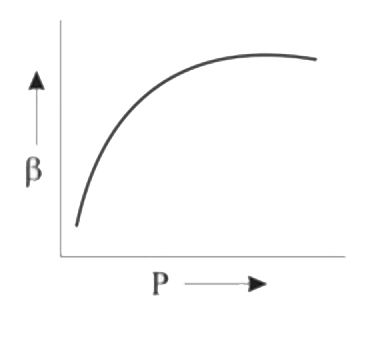 D
D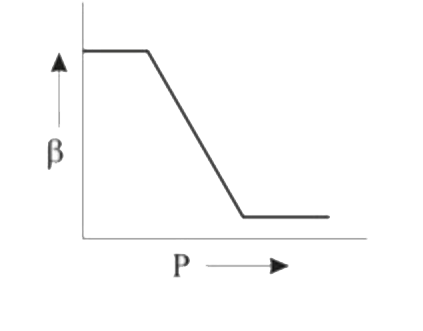
Which of the following graph correctly represents the variation of molar conductance (Δm) with dilution for a strong electrolyte ?
View SolutionWhich of the following graphs correctly represents the variation of β=−(dVdP)1V with P for an ideal gas at constant temperature ?
View SolutionWhich of the following graph correctly represents the variation of molar conductance (Δm) with dilution for a strong electrolyte ?
View SolutionWhich of the following graphs correctly represents the variation of β=−(dV/dP)/V with P for an ideal gas at constant temperature?
View SolutionWhich of the following graphs correctly represents the variation of β=−dV/dPV
with P for an ideal gas at constant temperature?
View Solution
