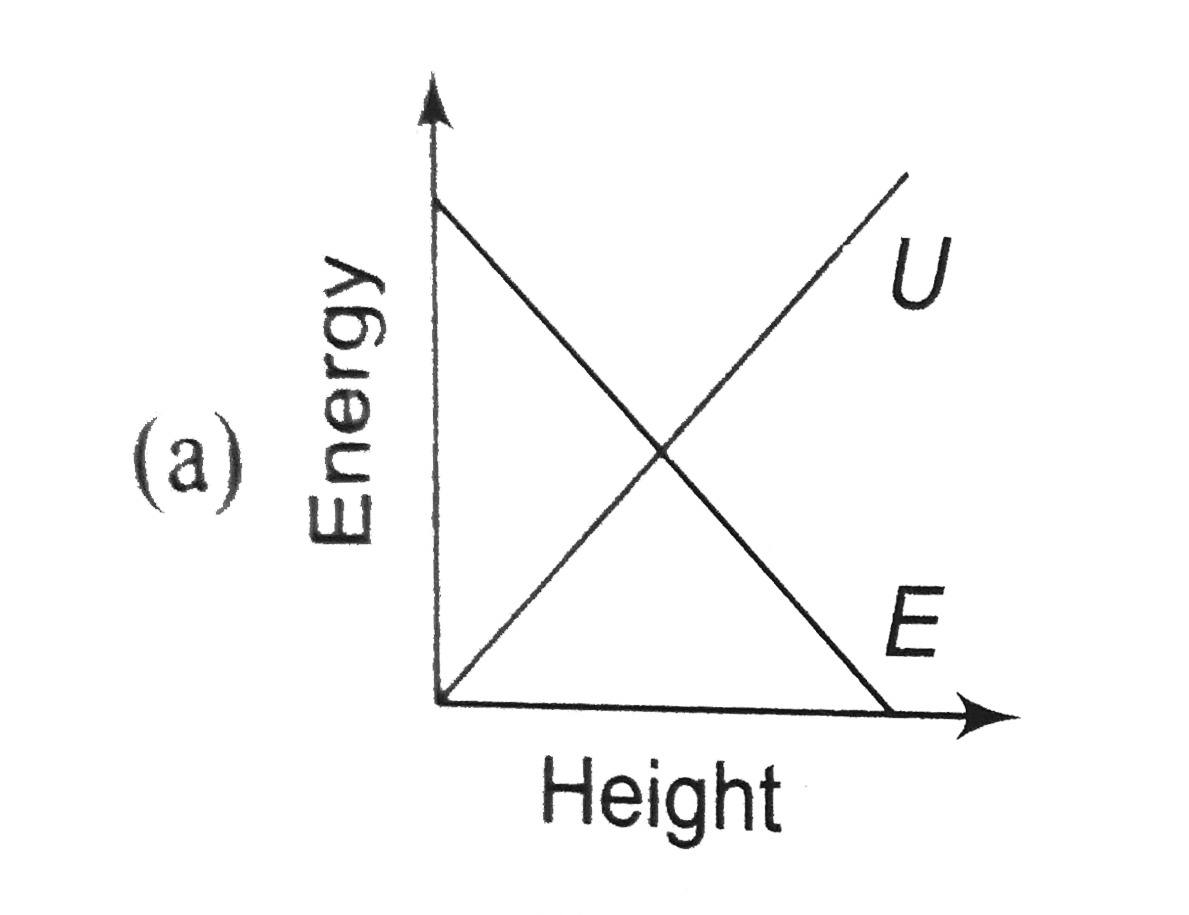
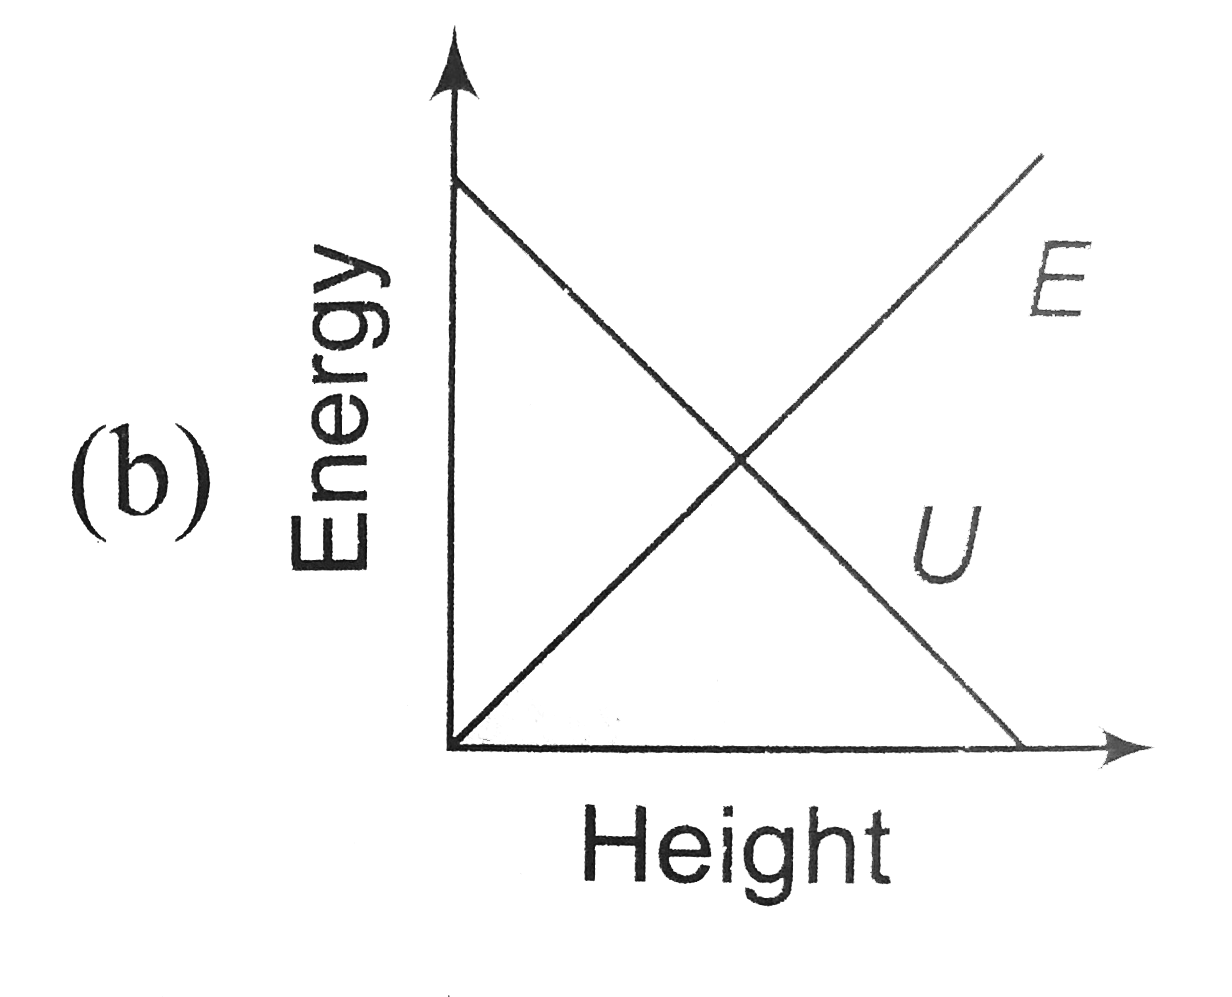
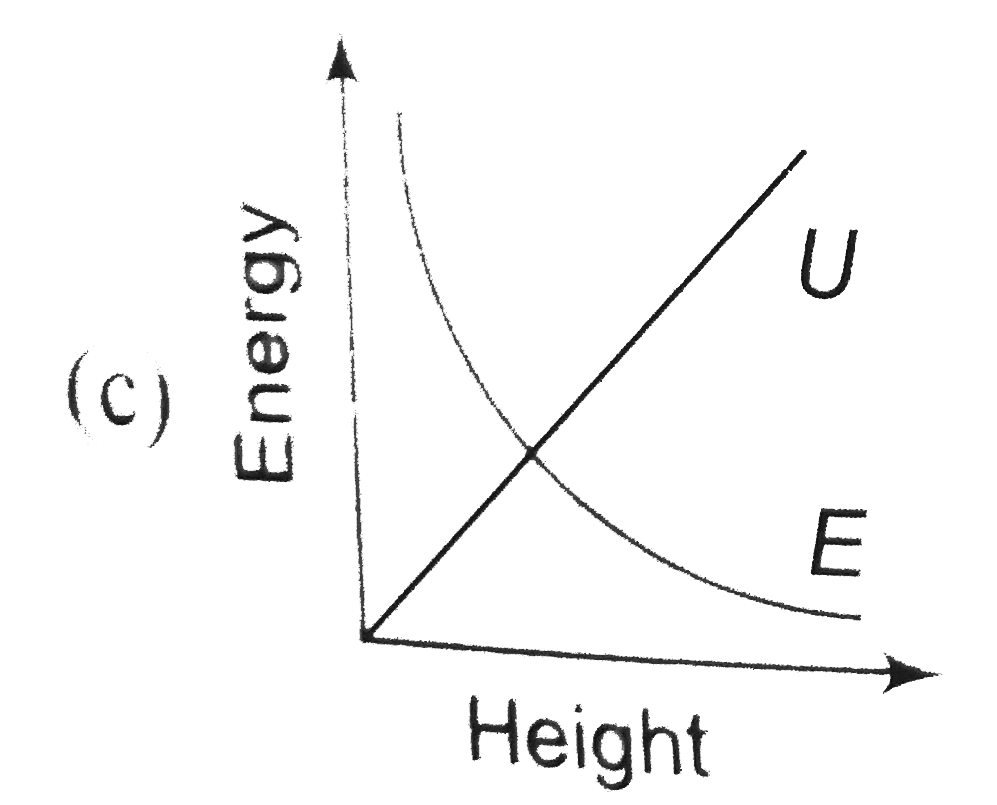
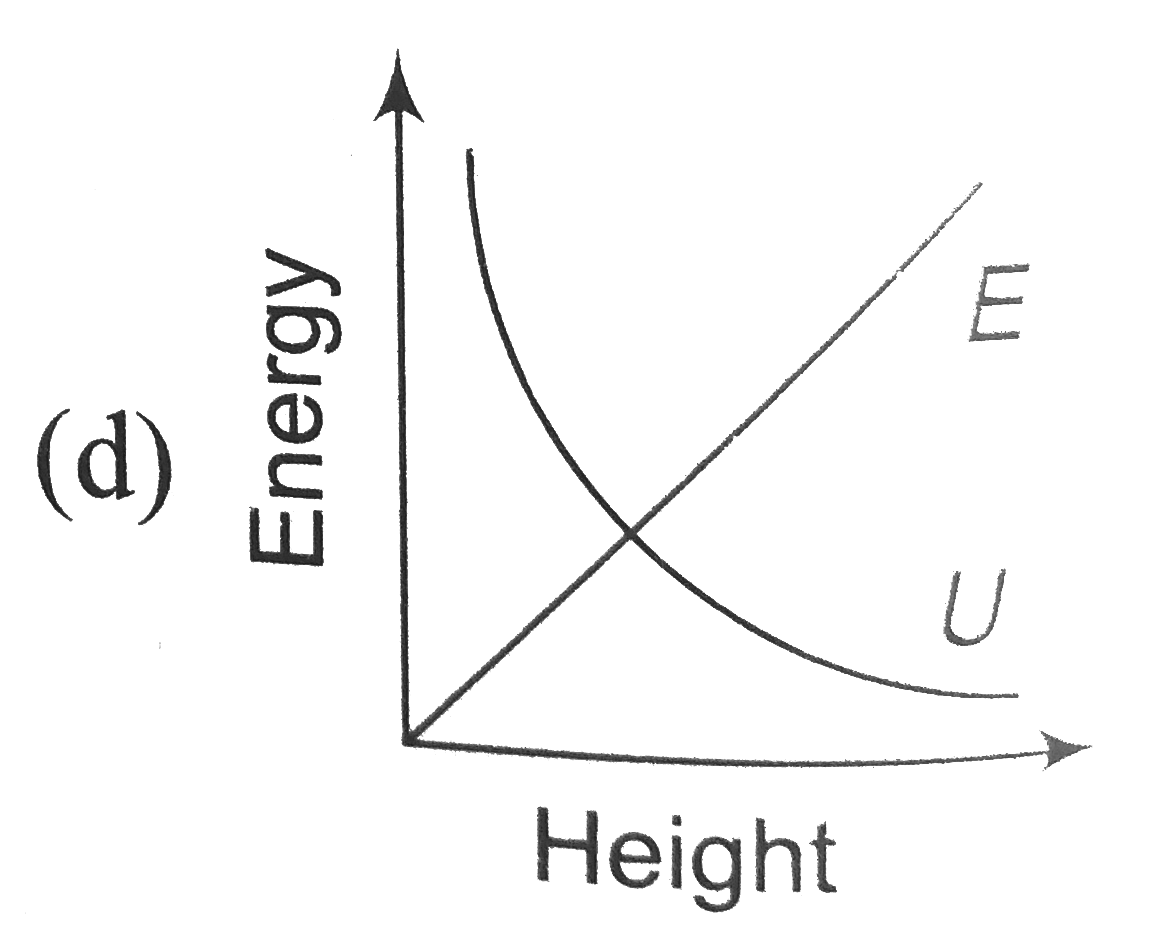
Which of the following graph best represents the total energy (T) of a freely falling body and its height (h) above the ground?


The correct Answer is:A
Total energy remains the same
Topper's Solved these Questions
- WORK AND ENERGYBOOK - MTG IIT JEE FOUNDATIONCHAPTER - WORK AND ENERGYEXERCISE - Exercise (Multiple Choice Questions Level -2)
14 Videos
- WORK AND ENERGYBOOK - MTG IIT JEE FOUNDATIONCHAPTER - WORK AND ENERGYEXERCISE - Exercise (Comprehension Type)
5 Videos
- WORK AND ENERGYBOOK - MTG IIT JEE FOUNDATIONCHAPTER - WORK AND ENERGYEXERCISE - Solved Examples
27 Videos
- THRUST AND PRESSUREBOOK - MTG IIT JEE FOUNDATIONCHAPTER - THRUST AND PRESSUREEXERCISE - Olympiad/HOTS Corner
15 Videos
Similar Questions
Knowledge Check
Which of the following graph is correct between kinetic energy E, potential energy (U) and height (h) from the ground of the partical
A B
B C
C D
D
Which of the following graph is correct between kinetic energy E, potential energy (U) and height (h) from the ground of the partical
A B
B C
C D
D
Velocity-displacement graph of a freely falling body is
Astraight line passing through the originBstraight line intersecting x and y axesCparabolaDhyperbola
In the case of a body freely falling from small height
View SolutionA ball falls from a height ‘h’ and collides with the ground. Each time it collides, its velocity is halved. Which of the following graphs are correct? Here t, v and y represent time, velocity and height above ground respectively. (vertically upwards direction is taken as positive and ground as y = 0)
View SolutionWhich one of the following graphs best represents the ways in which the total power P radiated by a black body depends upon the thermodynamic temperature T of the body?
View SolutionA ball falls from a height ‘h’ and collides with the ground. Each time it collides, its velocity is halved. Which of the following graphs are correct? Here t, v and y represent time, velocity and height above ground respectively. (vertically upwards direction is taken as positive and ground as y = 0)
View SolutionA parachutist steps from an aircraft, falls freely for two second, and then opens his parachute. Which of the following acceleration time (a−t) graphs best represents his downward acceleration a during the first 5 second ?
View Solution
