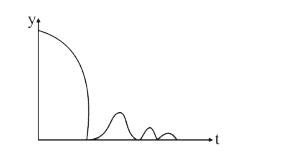
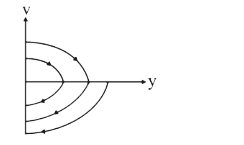
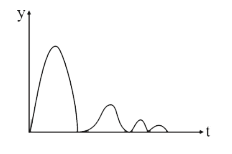
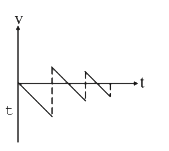
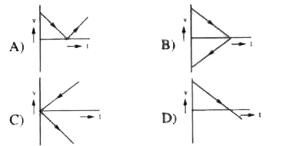
A ball falls from a height ‘h’ and collides with the ground. Each time it collides, its velocity is halved. Which of the following graphs are correct? Here t, v and y represent time, velocity and height above ground respectively. (vertically upwards direction is taken as positive and ground as y = 0)
The correct Answer is:D
To solve the problem, we need to analyze the motion of the ball as it falls and bounces back up, considering the conditions given in the question.
1. Understanding the Motion:
- The ball falls from a height h and collides with the ground.
- Each time it collides, its velocity is halved.
- The downward direction is taken as negative, and the upward direction is positive.
2. Initial Conditions:
- When the ball is dropped from height h, it starts with an initial velocity v0=0 (just before it starts falling).
- As it falls, it accelerates due to gravity, reaching a maximum downward velocity just before it hits the ground.
3. Velocity After Each Collision:
- Let’s denote the velocity just before the first collision as v1.
- After the first collision, the velocity becomes v2=v12 (half of v1).
- After the second collision, the velocity becomes v3=v22=v14.
- This pattern continues, where after the nth collision, the velocity is vn=v12n−1.
4. Height After Each Collision:
- The height reached after each bounce will also decrease because the velocity is halved each time.
- The maximum height after the first bounce can be calculated using the kinematic equation:
h1=v212g
- After the second bounce, the height reached will be:
h2=v222g=(v12)22g=v218g
- Continuing this, after the nth bounce, the height will be:
hn=v212g⋅2n−1=v212g⋅2n−1
5. Graph Analysis:
- For the velocity graph (v vs. t): The velocity will be maximum just before the first collision, then it will decrease to half after the first bounce, and continue to decrease after each subsequent bounce. The graph will show a series of peaks decreasing over time.
- For the height graph (y vs. t): The height will start from h and decrease to 0 when the ball hits the ground. After each bounce, the height will reach a lower maximum height, creating a series of decreasing peaks on the graph.
6. Conclusion:
- The correct graphs will show a decreasing velocity after each collision and a decreasing height after each bounce.
- The ball falls from a height h and collides with the ground.
- Each time it collides, its velocity is halved.
- The downward direction is taken as negative, and the upward direction is positive.
- When the ball is dropped from height h, it starts with an initial velocity v0=0 (just before it starts falling).
- As it falls, it accelerates due to gravity, reaching a maximum downward velocity just before it hits the ground.
- Let’s denote the velocity just before the first collision as v1.
- After the first collision, the velocity becomes v2=v12 (half of v1).
- After the second collision, the velocity becomes v3=v22=v14.
- This pattern continues, where after the nth collision, the velocity is vn=v12n−1.
- The height reached after each bounce will also decrease because the velocity is halved each time.
- The maximum height after the first bounce can be calculated using the kinematic equation:
h1=v212g
- After the second bounce, the height reached will be:
h2=v222g=(v12)22g=v218g
- Continuing this, after the nth bounce, the height will be:
hn=v212g⋅2n−1=v212g⋅2n−1
- For the velocity graph (v vs. t): The velocity will be maximum just before the first collision, then it will decrease to half after the first bounce, and continue to decrease after each subsequent bounce. The graph will show a series of peaks decreasing over time.
- For the height graph (y vs. t): The height will start from h and decrease to 0 when the ball hits the ground. After each bounce, the height will reach a lower maximum height, creating a series of decreasing peaks on the graph.
- The correct graphs will show a decreasing velocity after each collision and a decreasing height after each bounce.
Topper's Solved these Questions
- KINEMATICS OF A PARTICLE Book:VMC MODULES ENGLISHChapter:KINEMATICS OF A PARTICLE Exercise:JEE MAIN (archive)
Explore 19 Videos
- KINEMATICS OF A PARTICLE Book:VMC MODULES ENGLISHChapter:KINEMATICS OF A PARTICLE Exercise:JEE Advanced (archive)
Explore 14 Videos
- KINEMATICS OF A PARTICLE Book:VMC MODULES ENGLISHChapter:KINEMATICS OF A PARTICLE Exercise:LEVEL 1
Explore 75 Videos
- JEE MAIN REVISON TEST-23Book:VMC MODULES ENGLISHChapter:JEE MAIN REVISON TEST-23Exercise:PHYSICS (SECTION 2)
Explore 1 Video
- LAWS OF MOTION Book:VMC MODULES ENGLISHChapter:LAWS OF MOTION Exercise:IMPECCABLE
Explore 53 Videos
Similar Questions
A ball is dropped from a height h above ground. Neglect the air resistance, its velocity (v) varies with its height (y) above the ground as :-
View SolutionA particle is thrown vertically upwards with a velocity v. It returns to the ground in time T. which of the following graphs correctly represents the motion ?
View Solution
Knowledge Check
A ball is dropped vertically from a height d above the ground. It hits the ground and bounces up vertically to a height d/2. Neglecting subsequent motion and air resistance, its velocity v varies with the heiht h above the ground as
A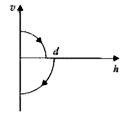 B
B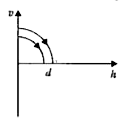 C
C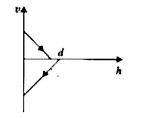 D
D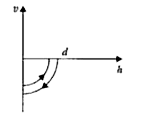
A ball thrown vertically upward with initial velocity u. Which of the following graphs represent the velocity of ball correctly as function of time?
(Take upward direction as positive)
View SolutionA body is falling from height 'h' it takes t1 time to reach the ground. The time taken to cover the first half of height is:-
View SolutionA small metallic spherical ball is dropped from a height h. If it collides with the ground inelastically and rebounds, then
View SolutionA ball is projected upwards from a height h above the surface of the earth with velocity v. The time at which the ball strikes the ground is
View SolutionA ball is projected upwards from a height h above the surface of the earth with velocity v. The time at which the ball strikes the ground is
View SolutionWhich of the following is the graph between the height (h) of a projectile and time (t), when it is projected from the ground
View SolutionA ball is thrown vertically upwards. Which of the following graph/graphs represent velocity-time graph of the ball during its flight (air resistance is neglected)
View Solution
