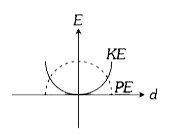
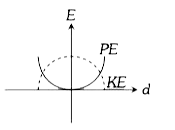
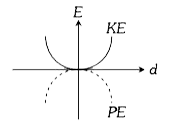
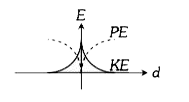
For a simple pendulum, a graph is plotted between itskinetic energy (KE) and potential energy (PE)against its displacement d. Which one of the following represents these correctly? (graph are schematic and not drawn to scale)


The correct Answer is:B
KE =12mω2√A2−y2
PE =12mω2y2
as y = 0, KEmax,PEmin
y=±A,KEmin,PEmax
Similar Questions
For a simple pendulum, a graph is plotted between its kinetic energy (K.E.) and potential energy (P.E.) against its displacement d. Which one of the following represents these correctly ? (graph are schematic and not drawn to scale)
View Solutionएक सरल लोलक के लिए, विस्थापन d, गतिज ऊर्जा KE=12mv2 तथा स्थितिज ऊर्जा PE = mgh के बीच में आरेख खींचा जाता है। यदि विस्थापन d को X-अक्ष के सापेक्ष तथा 12mv2 तथा mngh को Y-अक्ष के सापेक्ष खींचा जाता है, तो आरेख किस प्रकार का होगा?
View SolutionDraw a graph to show the variation of PE, KE and total energy of a simple harmonic oscillator with displacement.
View SolutionDraw a graph to show the variation of PE, KE and total energy of a simple harmonic oscillator with displacement.
View SolutionFor a simple pendulum, a graph is plotted between itskinetic energy (KE) and potential energy (PE) against its displacement d . Which one of the following represents these correctly? (graph are schematic and not drawn to scale)
View SolutionFor a simple pendulum, a graph is plotted between its kinetic energy (KE) and potential energy (PE) against its displacement d . Which one of the following represents these correctly? (graph are schematic and not drawn to scale)
View SolutionFor a simple pendulum, a graph is plotted between its kinetic energy(KE) and potential energy (PE) against its displacement d. Which one of the following represents these correctly? (graphs are schematic and drawn to scale)
View SolutionA particle falls from rest under gravity. Its potential energy with respect to the ground (PE) and its kinetic energy (KE) are plotted against time (t). Choose the correct graph.
View Solution
