Which graph is correct for an ideal gas between pressure and density.
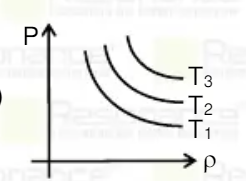
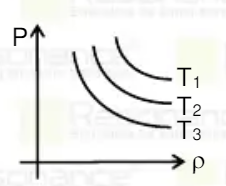
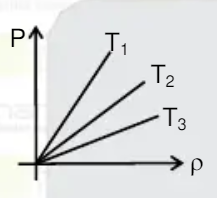
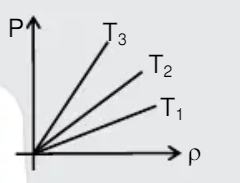
To solve the problem of determining the correct graph for an ideal gas between pressure (P) and density (ρ), we will use the ideal gas law and analyze the relationship between these variables step by step.
1. Understand the Ideal Gas Law:
The ideal gas law is given by the equation:
PV=nRT
where P is pressure, V is volume, n is the number of moles, R is the ideal gas constant, and T is the temperature.
2. Express Pressure in Terms of Density:
We can express the number of moles n in terms of mass m and molar mass M:
n=mM
Substituting this into the ideal gas law gives:
P=mMVRT
The density ρ is defined as:
ρ=mV
Therefore, we can rewrite the pressure equation as:
P=ρRTM
3. Analyze the Relationship:
From the equation P=ρRTM, we can see that pressure P is directly proportional to density ρ when temperature T is held constant:
P∝ρ(at constant T)
4. Graphical Representation:
Since pressure is directly proportional to density, the graph of pressure (P) versus density (ρ) will be a straight line passing through the origin. The slope of this line will depend on the temperature T.
5. Effect of Temperature on the Slope:
If we consider different temperatures, the slope of the line dPdρ will be:
slope=RTM
Thus, as temperature increases, the slope of the graph also increases. Therefore, if we have three different temperatures T1<T2<T3, the slopes will follow:
slope at T3>slope at T2>slope at T1
6. Conclusion:
Based on the above analysis, the correct graph will be a straight line with increasing slope as the temperature increases. Therefore, the graph corresponding to T3 will have the steepest slope, followed by T2 and then T1.
Final Answer:
The correct graph for an ideal gas between pressure and density is the one that shows a straight line with increasing slope for higher temperatures.
The ideal gas law is given by the equation:
PV=nRT
where P is pressure, V is volume, n is the number of moles, R is the ideal gas constant, and T is the temperature.
We can express the number of moles n in terms of mass m and molar mass M:
n=mM
Substituting this into the ideal gas law gives:
P=mMVRT
The density ρ is defined as:
ρ=mV
Therefore, we can rewrite the pressure equation as:
P=ρRTM
From the equation P=ρRTM, we can see that pressure P is directly proportional to density ρ when temperature T is held constant:
P∝ρ(at constant T)
Since pressure is directly proportional to density, the graph of pressure (P) versus density (ρ) will be a straight line passing through the origin. The slope of this line will depend on the temperature T.
If we consider different temperatures, the slope of the line dPdρ will be:
slope=RTM
Thus, as temperature increases, the slope of the graph also increases. Therefore, if we have three different temperatures T1<T2<T3, the slopes will follow:
slope at T3>slope at T2>slope at T1
Based on the above analysis, the correct graph will be a straight line with increasing slope as the temperature increases. Therefore, the graph corresponding to T3 will have the steepest slope, followed by T2 and then T1.
The correct graph for an ideal gas between pressure and density is the one that shows a straight line with increasing slope for higher temperatures.
Topper's Solved these Questions
Similar Questions
Knowledge Check
Which is (are) correct for ideal gas ?
A(δUδT)P=0B(δTδP)H=0C(δEδV)T=0D(δUδP)T=0Which is (are) correct for ideal gas ?
A(δUδT)P=0B(δUδT)H=0C(δEδV)T=0D(δUδP)T=0Which graph is not a straight line for an ideal gas ?
AP us 1V (at constant T and n)BPV us V2 (at constant T and n)CP us T2 (at constant V and n)Dlog P us log (V2) (at constant T and n)
Which of the following graph is incorrect for an ideal gas?

View Solutionwhich one of the following graph is not correct for ideal gas ?
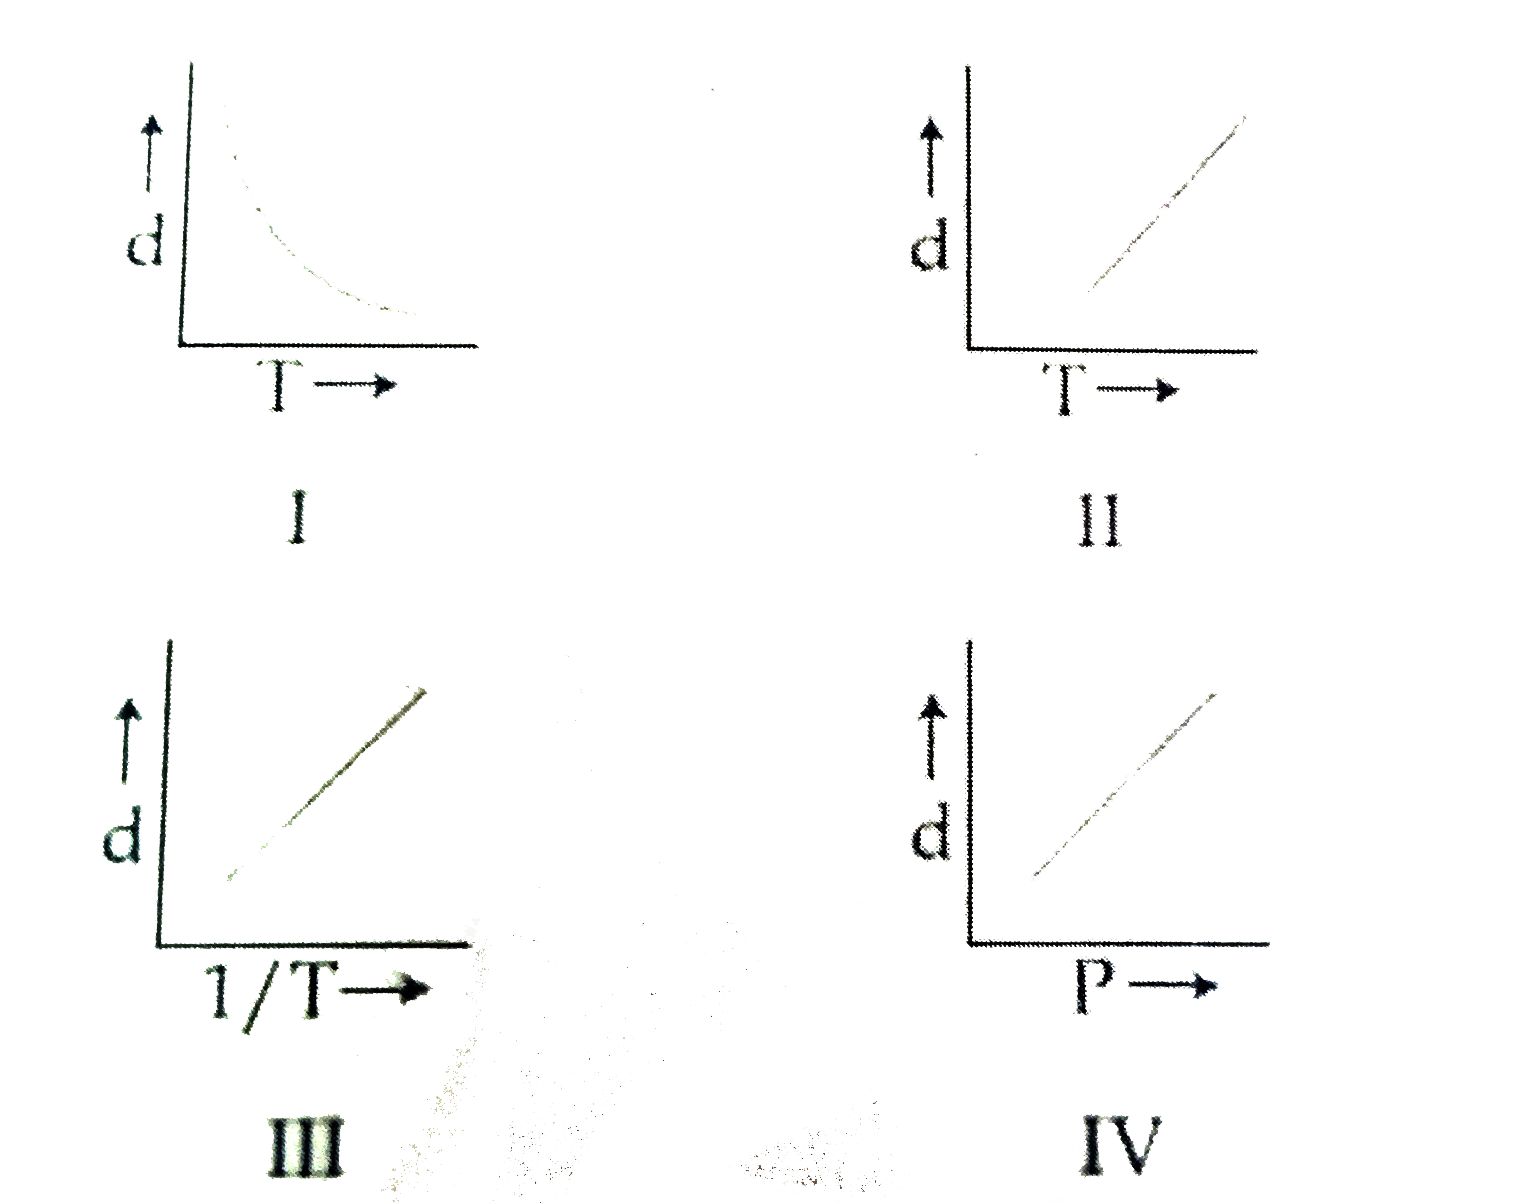
d=density ,P=pressure,T=Temperature
View SolutionThe density of an ideal gas
View SolutionDuring the adiabatic change of ideal gas, the realation between the pressure and the density will be:
View SolutionIn Boyles experiment for a given gas at different temperature the graph drawn between pressure and density are straight lines as shown then
_E01_060_Q01.png)
View Solution
