Pressure versus temperature graph of an ideal gas at constant volume V is shown by the straight line A. Now mass of the has is doubled and the volume is halved, then the corresponding pressure versus temperature graph will be shown by the line
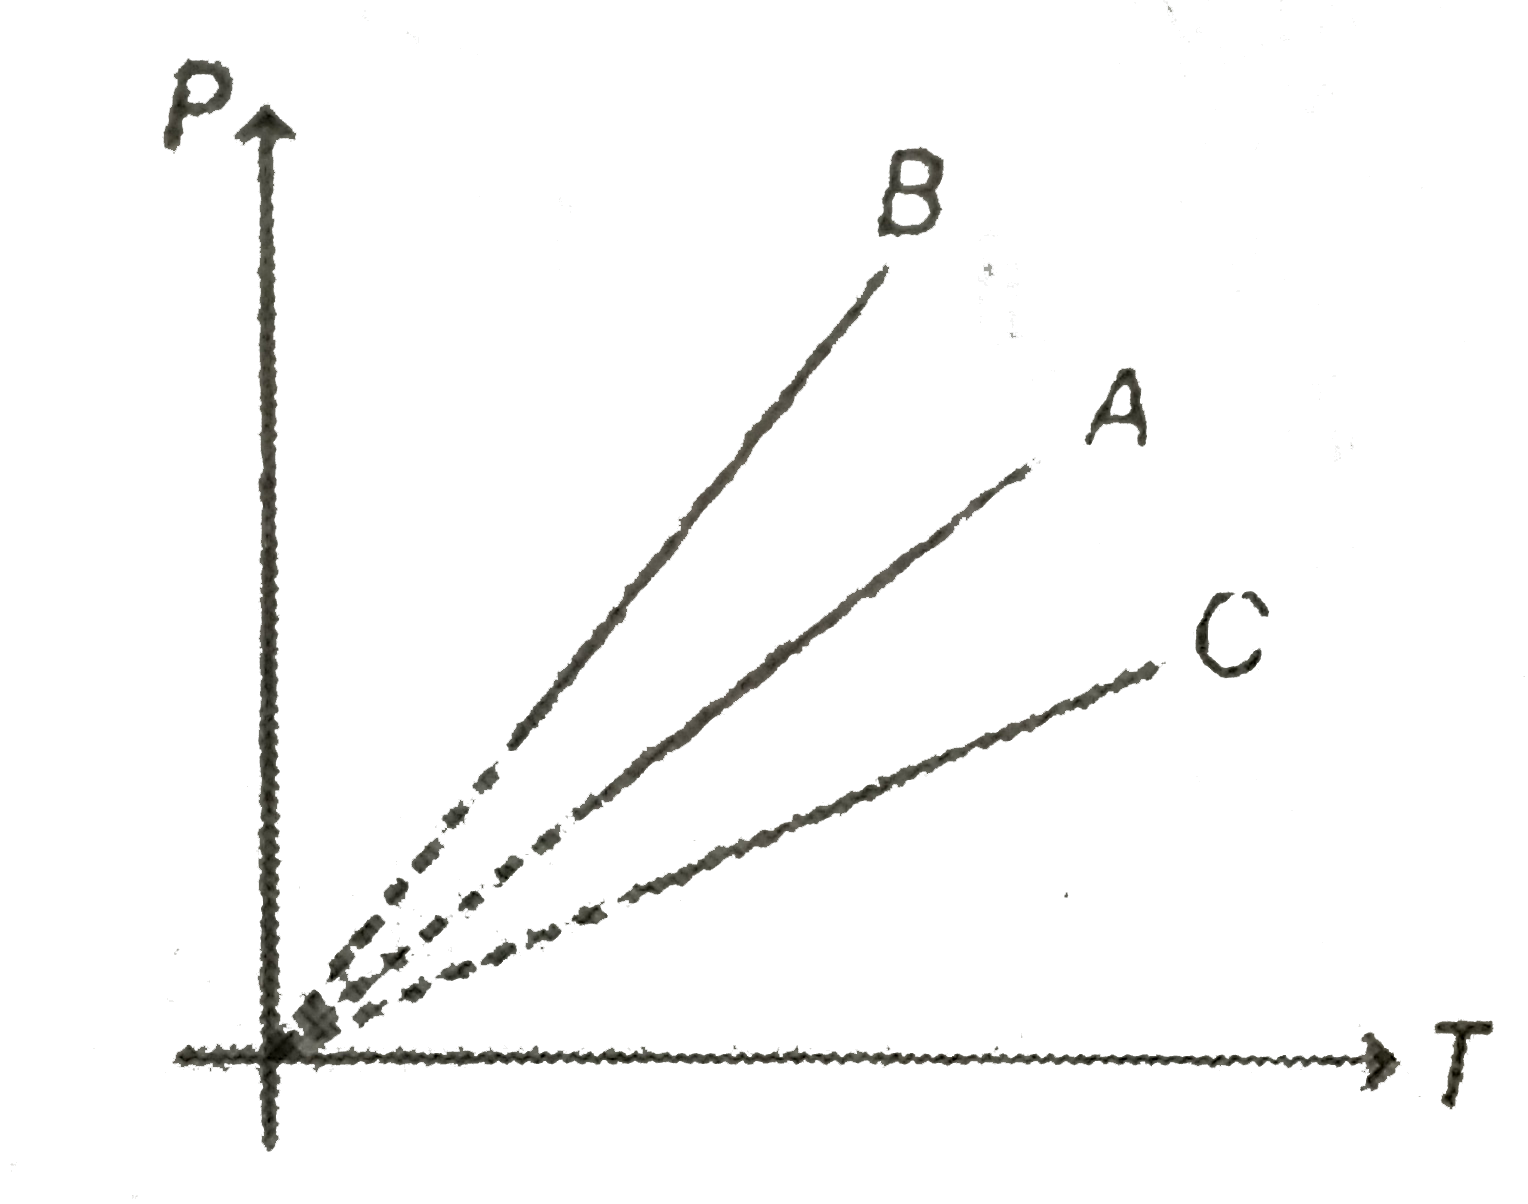
A
B
C
None of these
The correct Answer is:B
PV=mM×RT⇒P=mRTMV
At V = constant, P vs T graph is a straight line
slope =mRMV
(slope). =2mRMV/2=4(mRmV)
Similar Questions
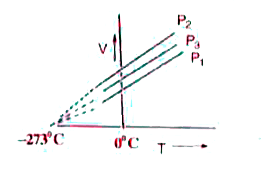
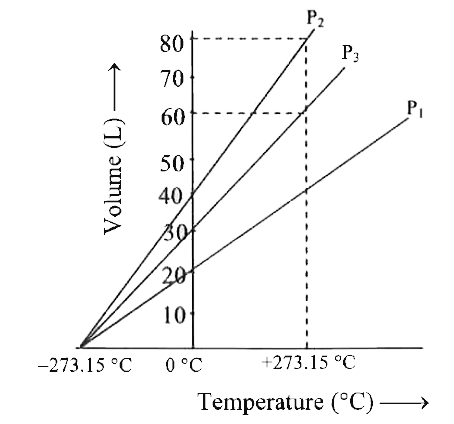
The volume-temperature graphs of a given mass of an ideal gas at constant pressures are shown below. What is the correct order of pressures?
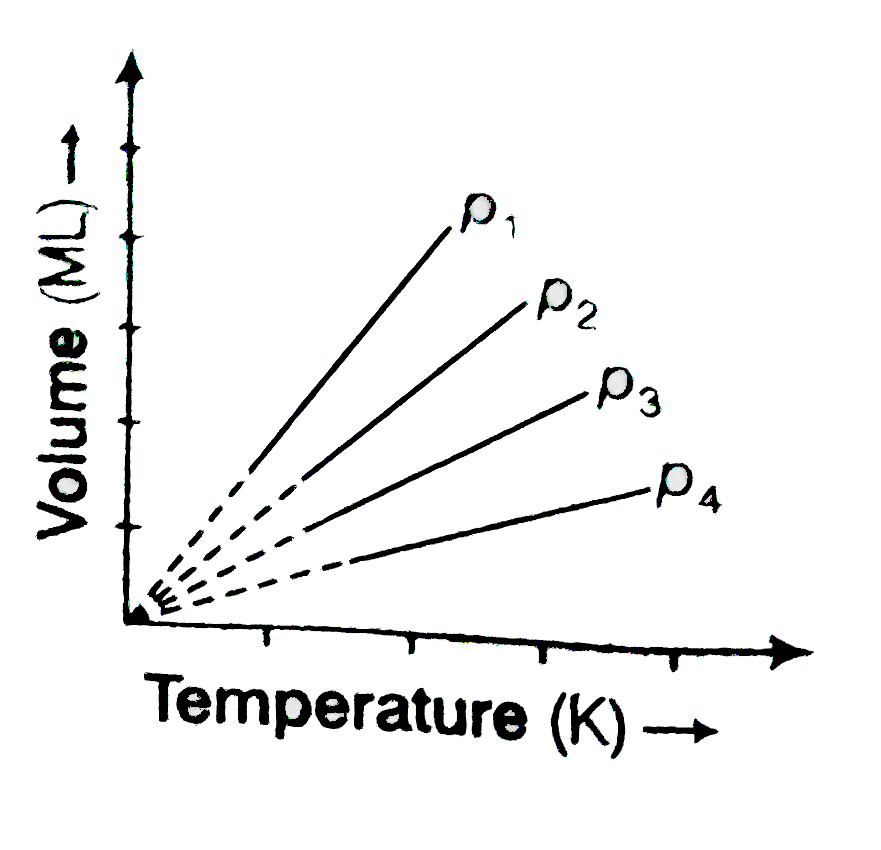
View SolutionA plot of volume (V) versus temperature (T) for a gas at constant pressure is a straight line passing through the origin. The plots at different values of pressure are shown in figure. Which of the following order of pressure is correct for this gas ?
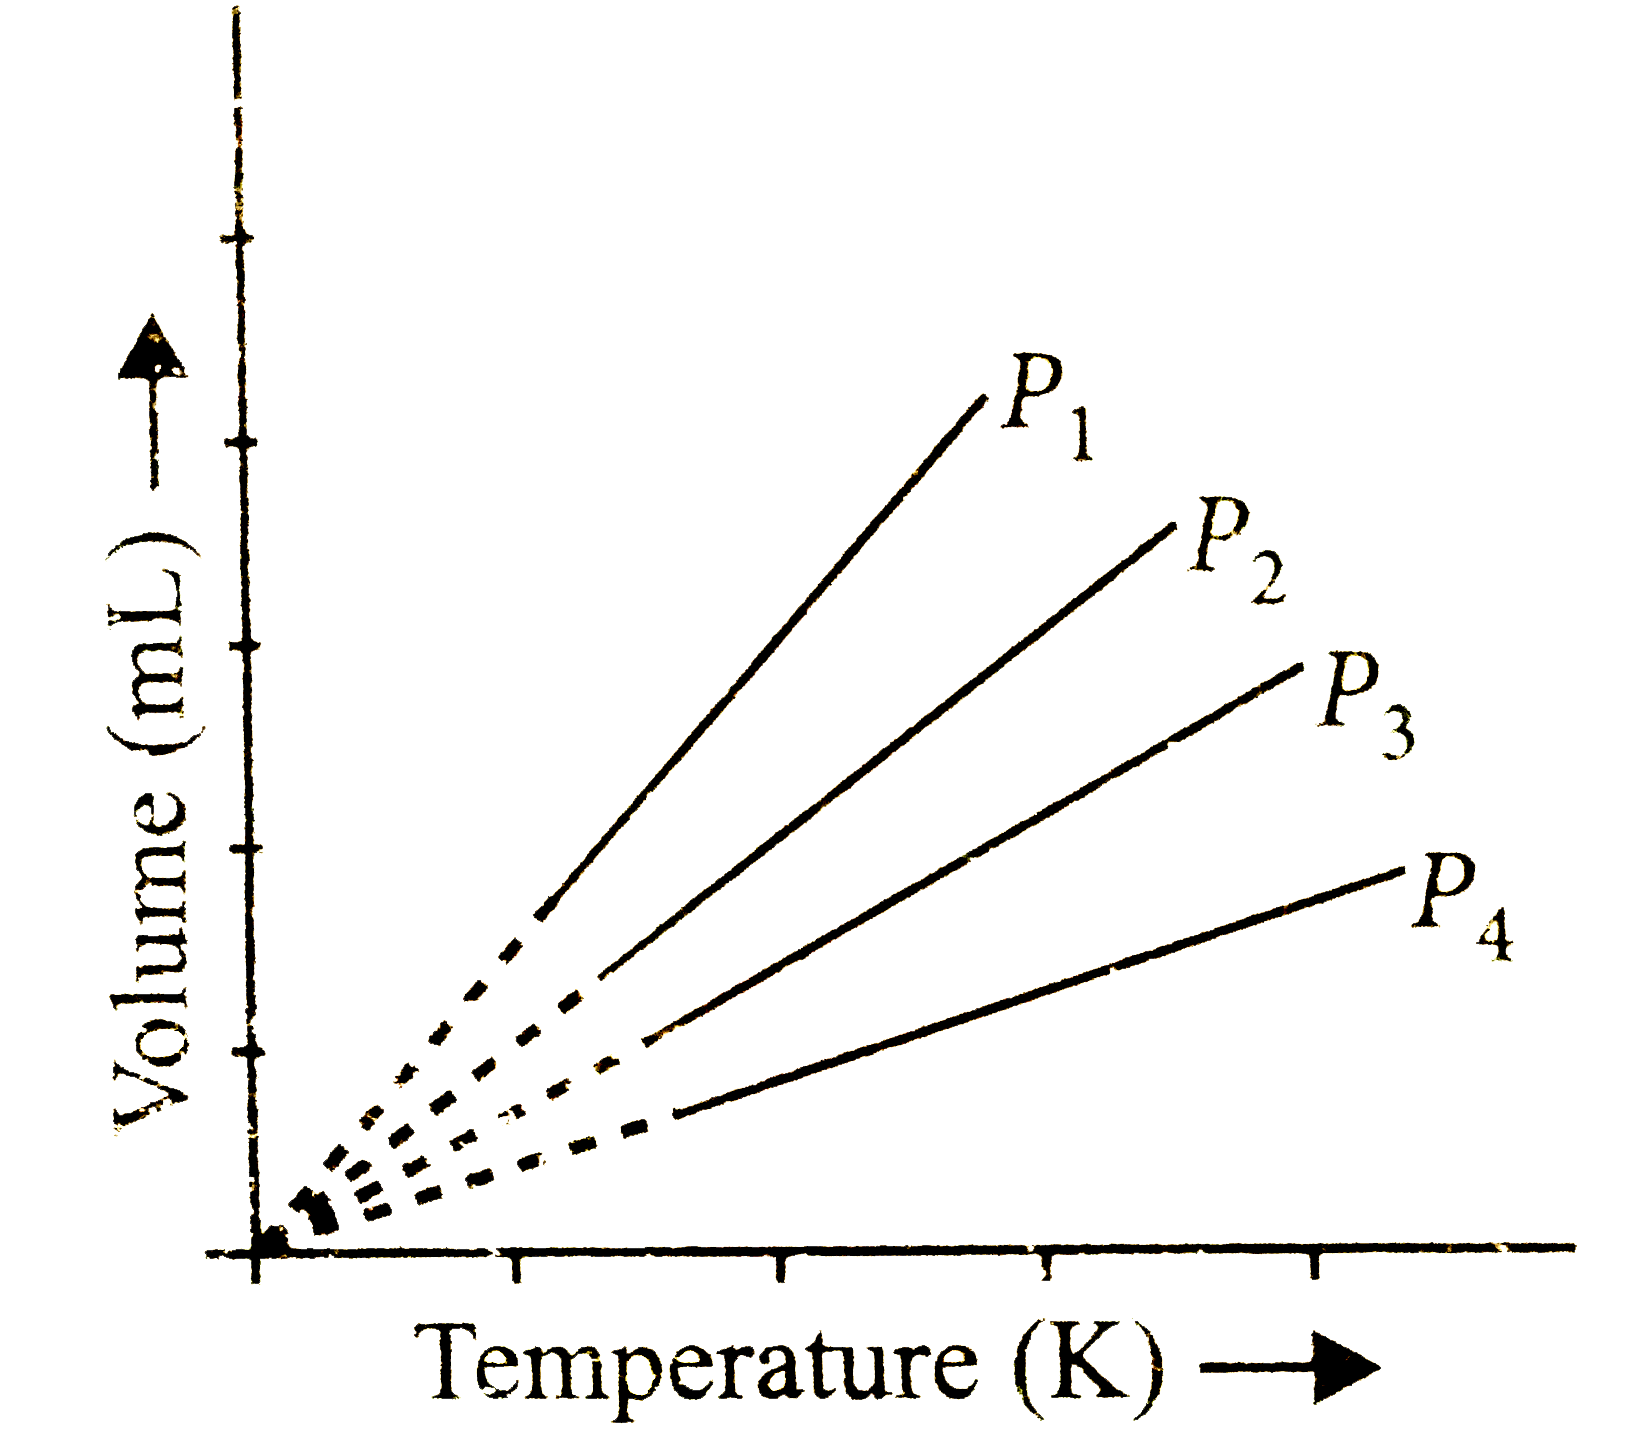
View SolutionA plot of volume (V) versus temperature (T) for a gas at constant pressure is a straight line passing through the origin . The plots at different values of pressure are shown in figure .
Which of the following order of pressure is correct for this gas ?
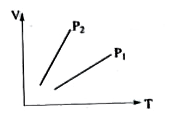
View SolutionFigure shows the volume versus temperature graph for the same mass of a gas (assumed ideal correspond to two different pressure P1andP2. Then
View SolutionThe volume - temperature graph of a given mass of an ideal gas at respective constant pressure is shown below. What is the CORRECT order of pressure ?
View SolutionPressure versus temperature graph of an ideal gas at constant volume V is shown by the straight line A. Now mass of the gas is doubled and the volume is halved, then the corresponding pressure versus temperature graph will be shown by the line
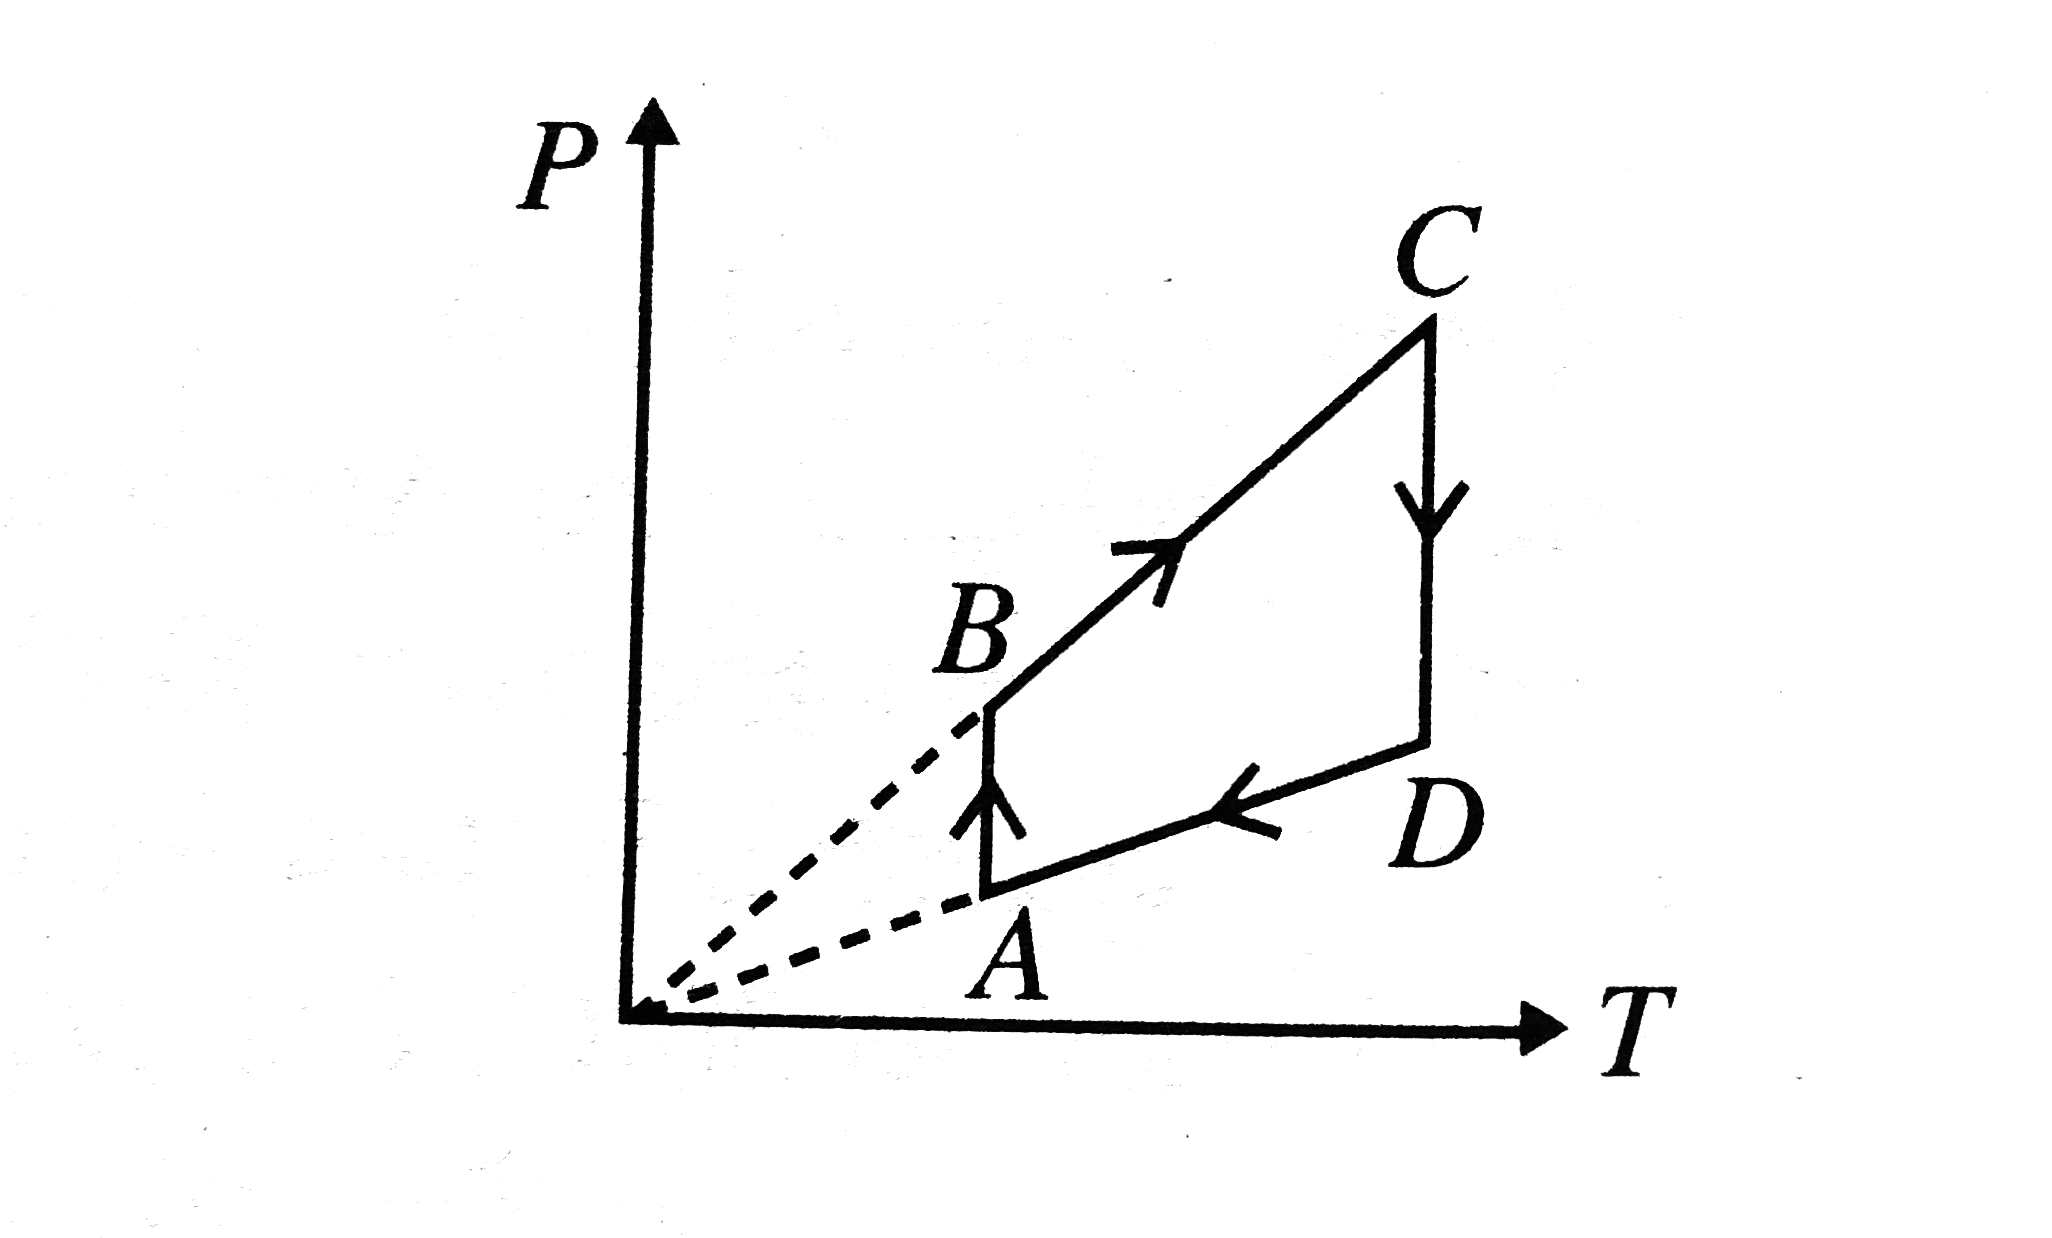
View SolutionPressure versus temperature graph of an ideal gas as shown in Fig.
Corresponding density (ρ) versus volume (V) graph will be
View SolutionPressure versus temperature graph of an ideal gas as shown in Fig.
Corresponding density (ρ) versus volume (V) graph will be

View Solution
