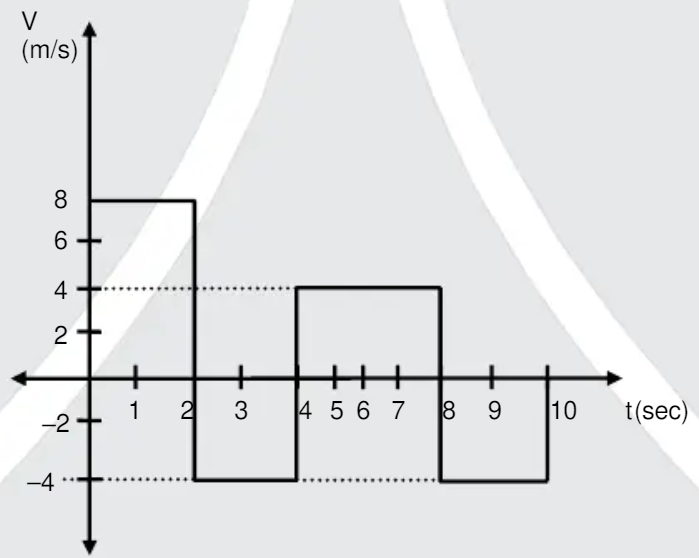
A particle is moving one straight line its V-t graph is shown in the figure.
12
13
14
15
The correct Answer is:B
Topper's Solved these Questions
Similar Questions
Knowledge Check
Velocity displacement graph of a particle moving in a straight line is as shown in figure.
 Amagnitude of acceleration of particle is decreasingBmagnitude of acceleration of particlre is increasingCacceleration versus displacement graph straight lineDacceleration versus displacement graph is parabola
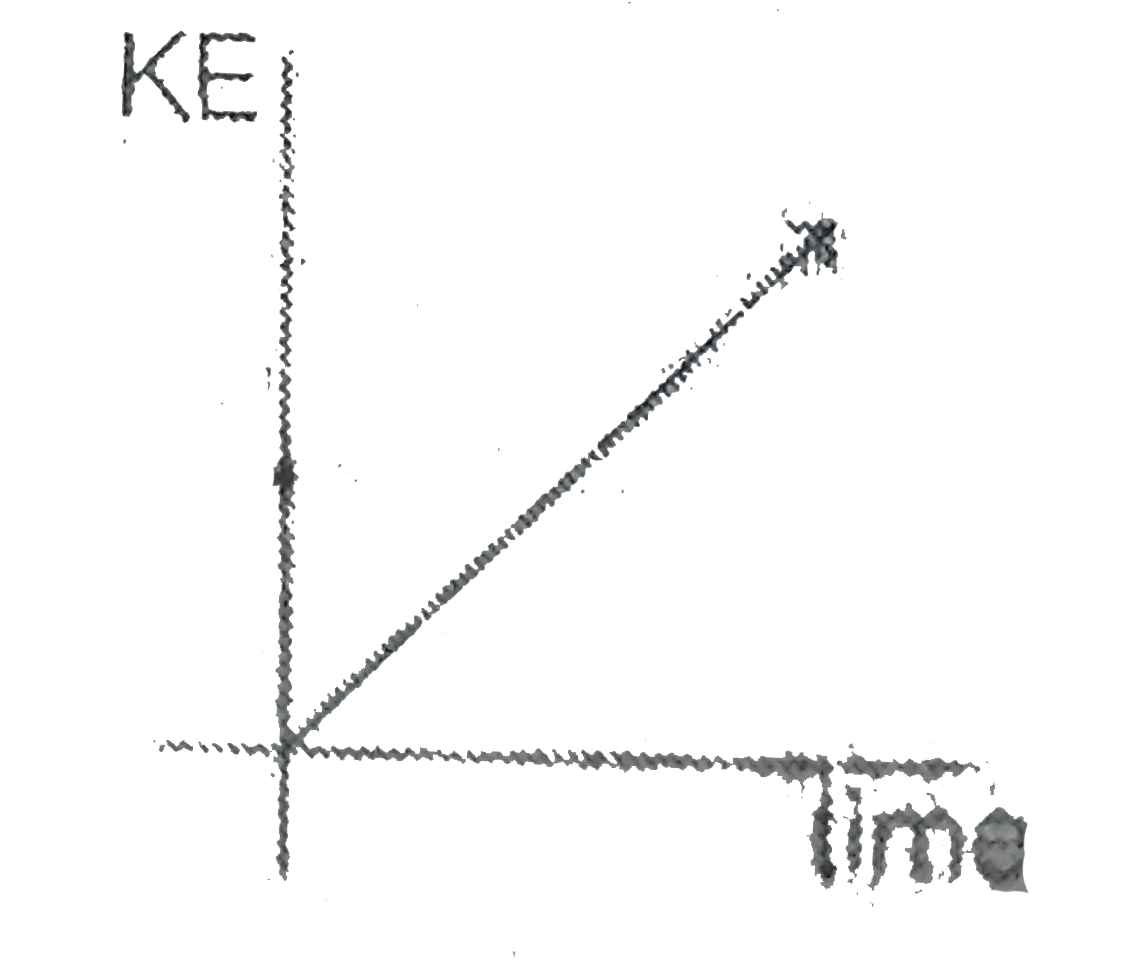
The kinetic energy (KE) versus time graph for a particle moving along a straight line is as shown in the figure. The force versus time graph for the particle may be
 A
A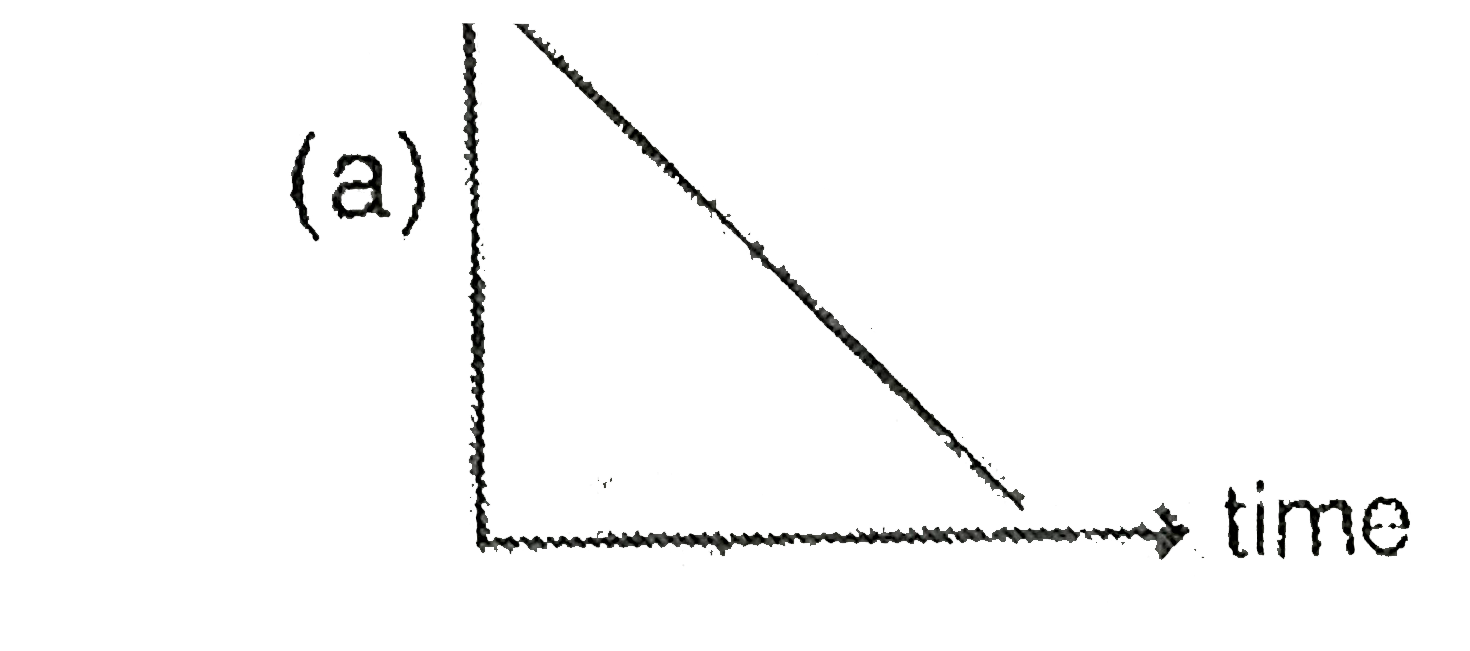 B
B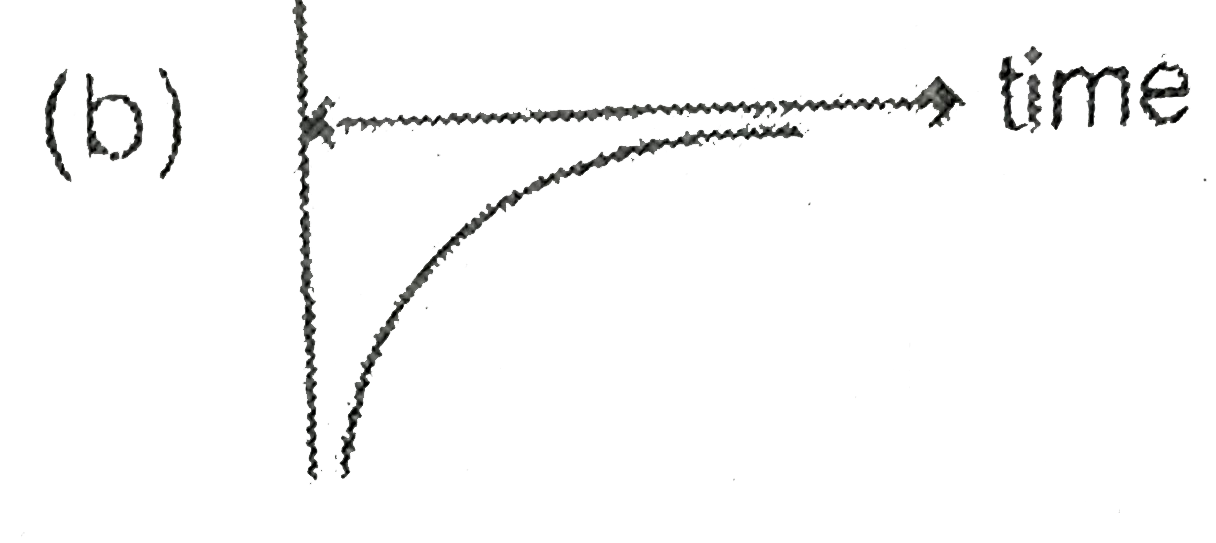 C
C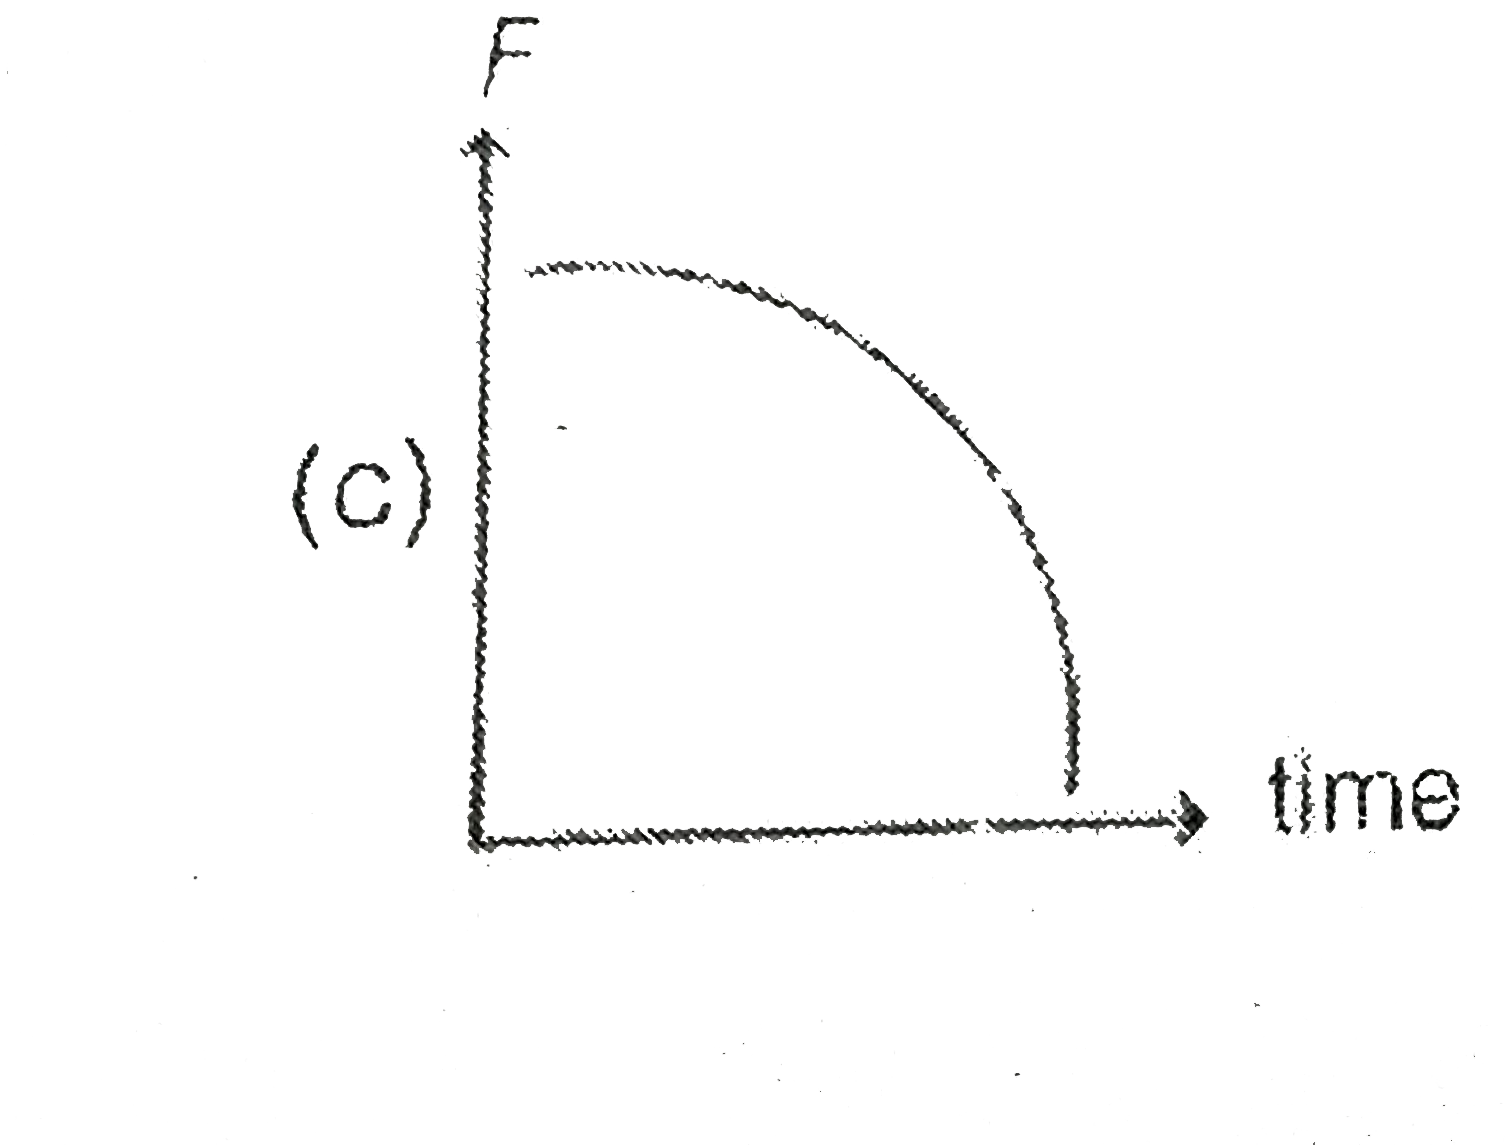 D
D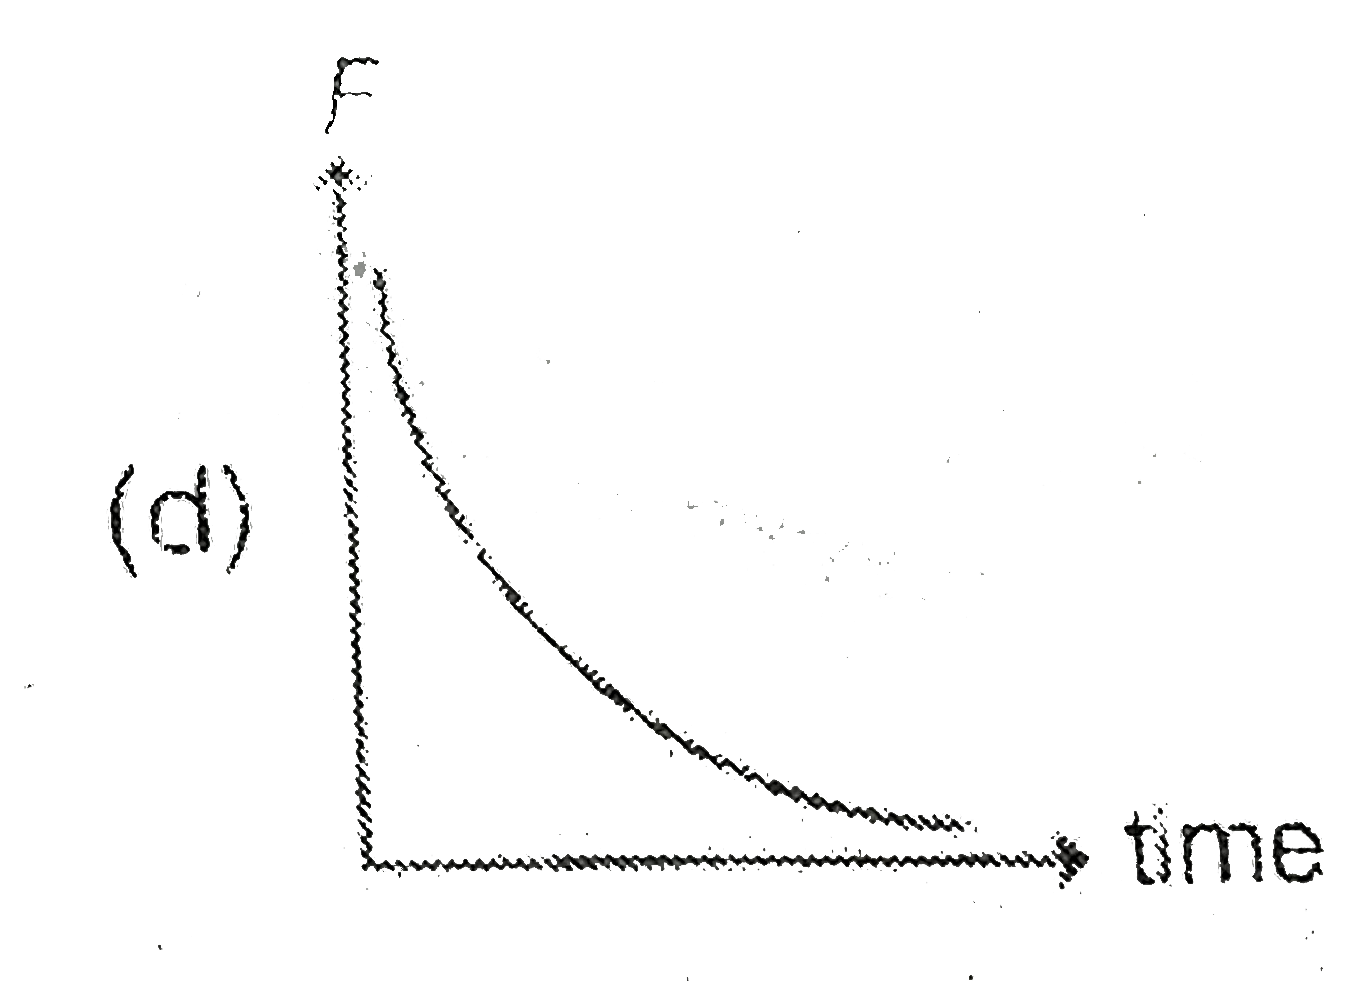
Displacement time graph of a particle moving in a straight line is a shown in figure.
 Ain region A acceleration is positiveBin region B acceleration is negativeCin region C acceleration is positiveDin region D acceleration is negative
Displacement time graph of a particle moving in a straight line is a shown in figure.

View SolutionAcceleration (a) -displacement (s) graph of a particle moving in a straight line is as shown in the figure. The initial velocity of the particle is zero. The v−s graph of the particle would be
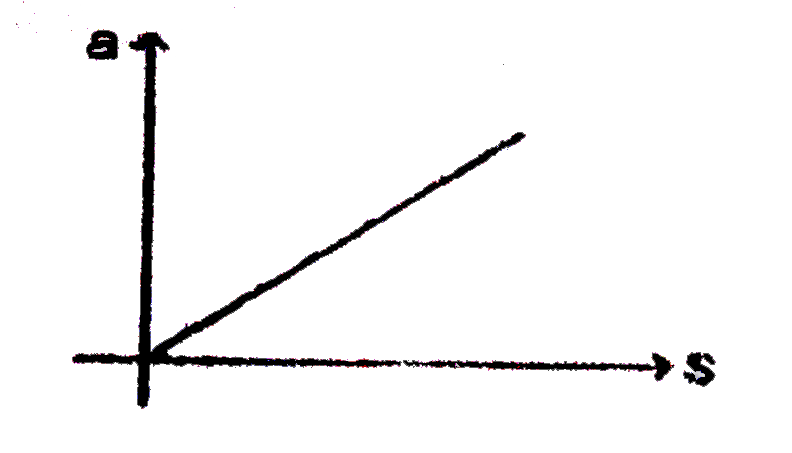
View SolutionVelocity - time (V–t) graph of a particle moving in a straight line is as shown in the figure. The sign of acceleration in regions OP, PQ, QR and RS respectively are
View SolutionMark the statement True (T) or False (F): The position -time graph of a particle moving along a straight line in as shown in the figure. Its speed in constant.
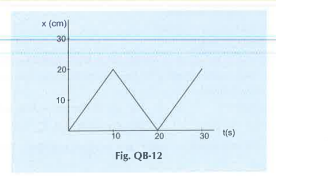
View SolutionAcceleration (a) -displacement (s) graph of a particle moving in a straight line is as shown in the figure. The initial velocity of the particle is zero. The v−s graph of the particle would be

View Solution
