For an isothermal process which of the curve represent correct relationship between P v/s V for different temperature T1,T2,T3.
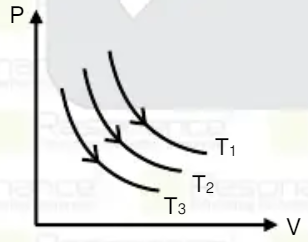
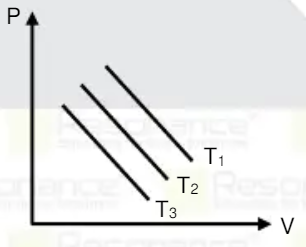
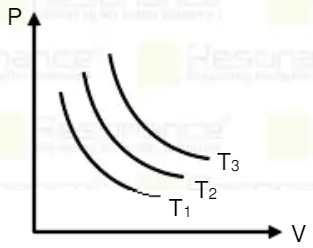
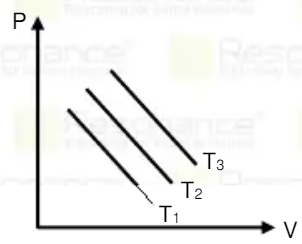
The correct Answer is:A
Topper's Solved these Questions
Similar Questions
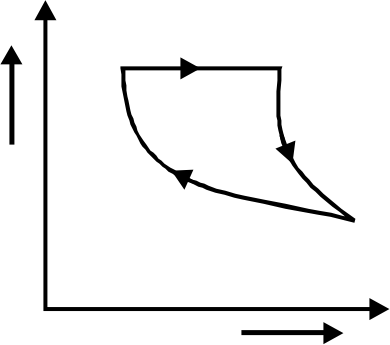
For a given thermodynamic cyclic process, P−V indicator diagram is as shown in the figure. Process AB,BC&CA are isobaric, & isothermal respectively. Then which of the following curve represent correc V−T indicator diagram for the process ABCA?
View SolutionWhich of the following P-V curve best represents. As isothermal process?
View Solution
Knowledge Check
The preparation of ammonia by Haber's process is an exothermic reaction. If the process follows the following temperature pressure relationship for its % yield, then for temperatures T1,T2,andT3 the correct option is
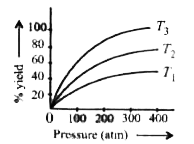 AT3>T2>T1BT1>T2>T3CT1=T2=T3Dnothing could be predicted.
Which of the following P-V curve best represents. As isothermal process?
A B
B C
C D
D
Which of the following P-V curve best represents. As isothermal process?
A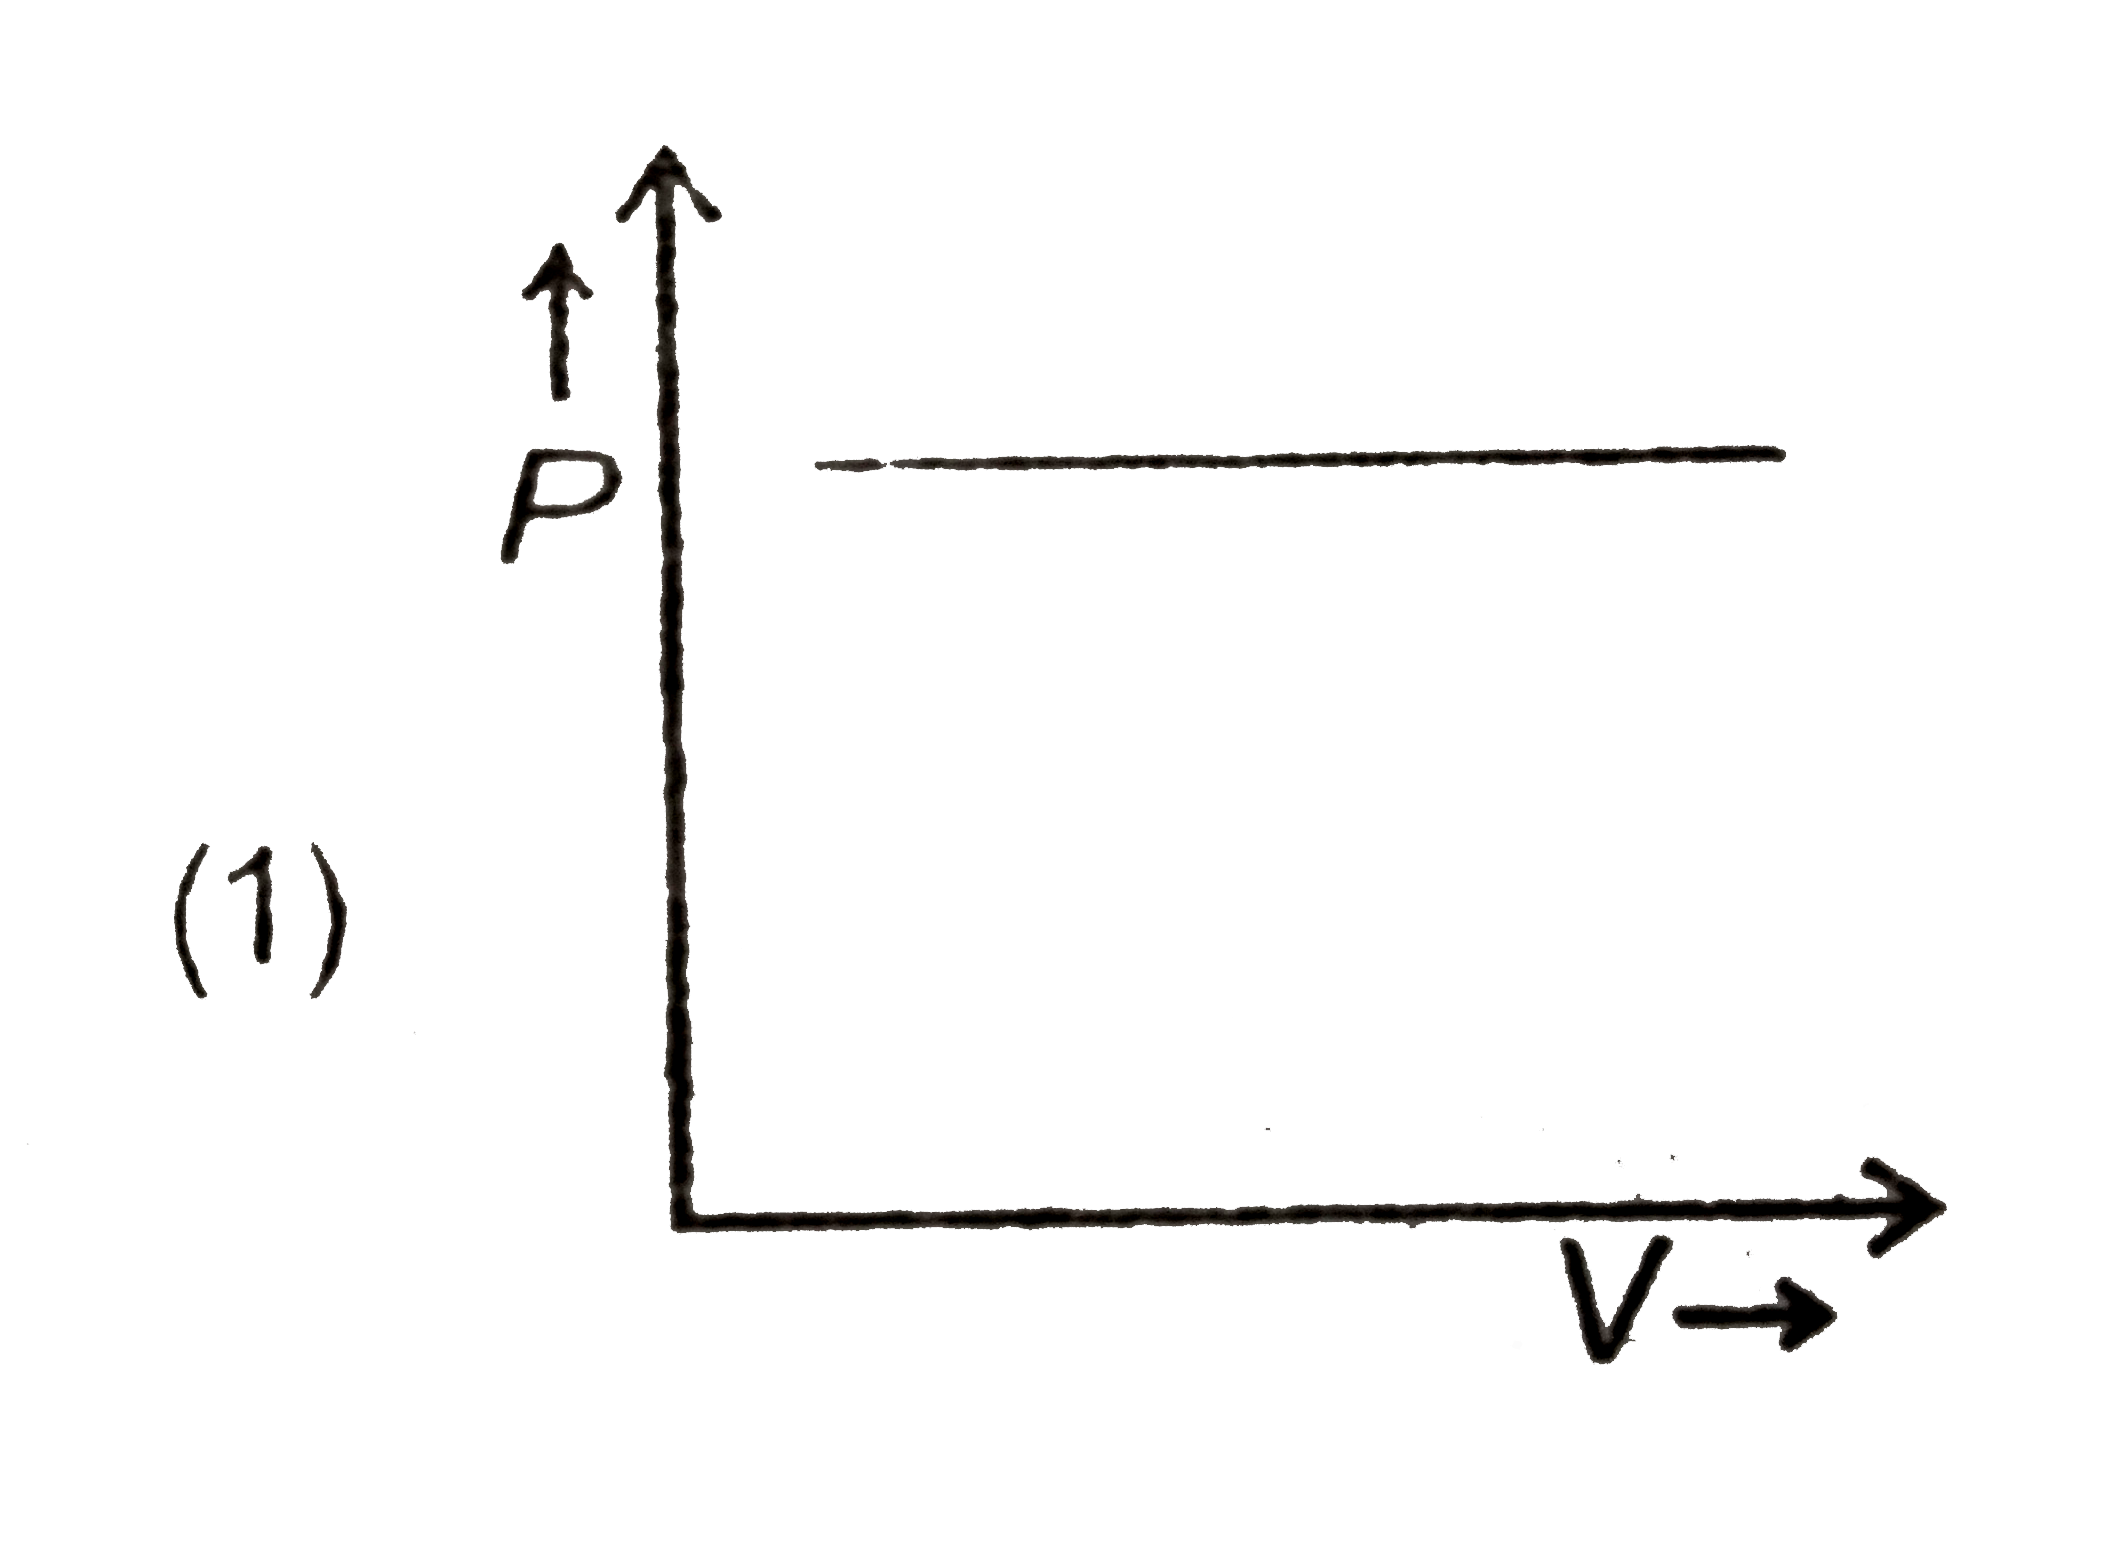 B
B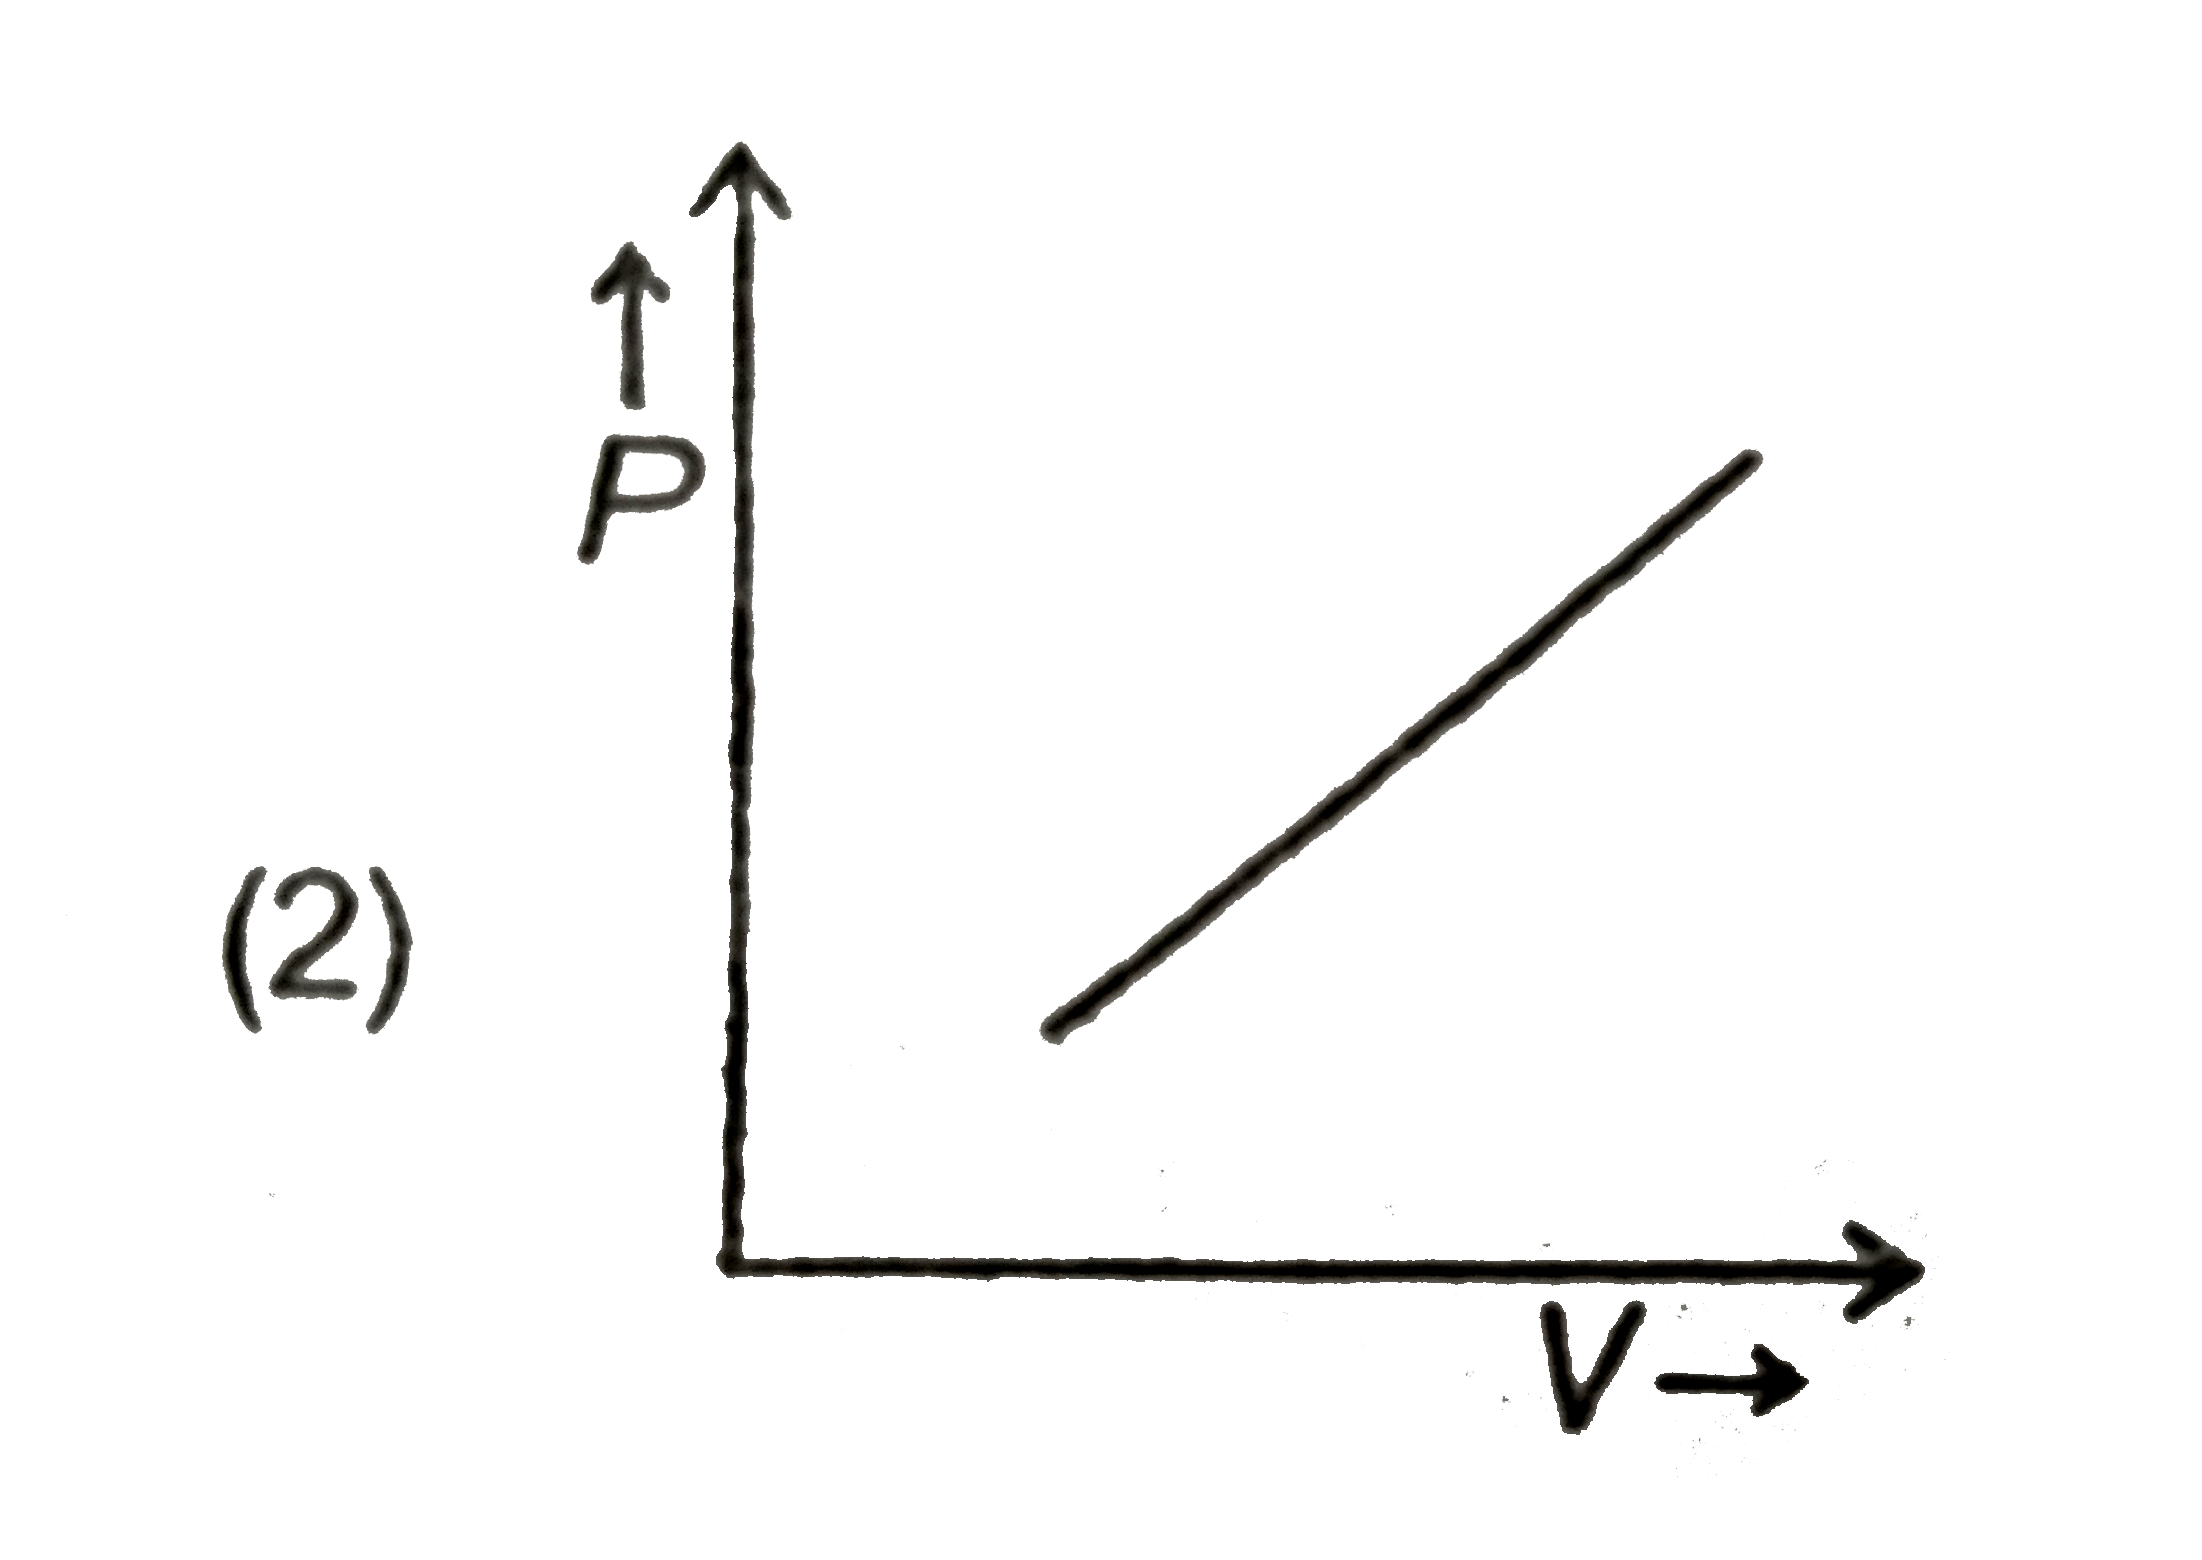 C
C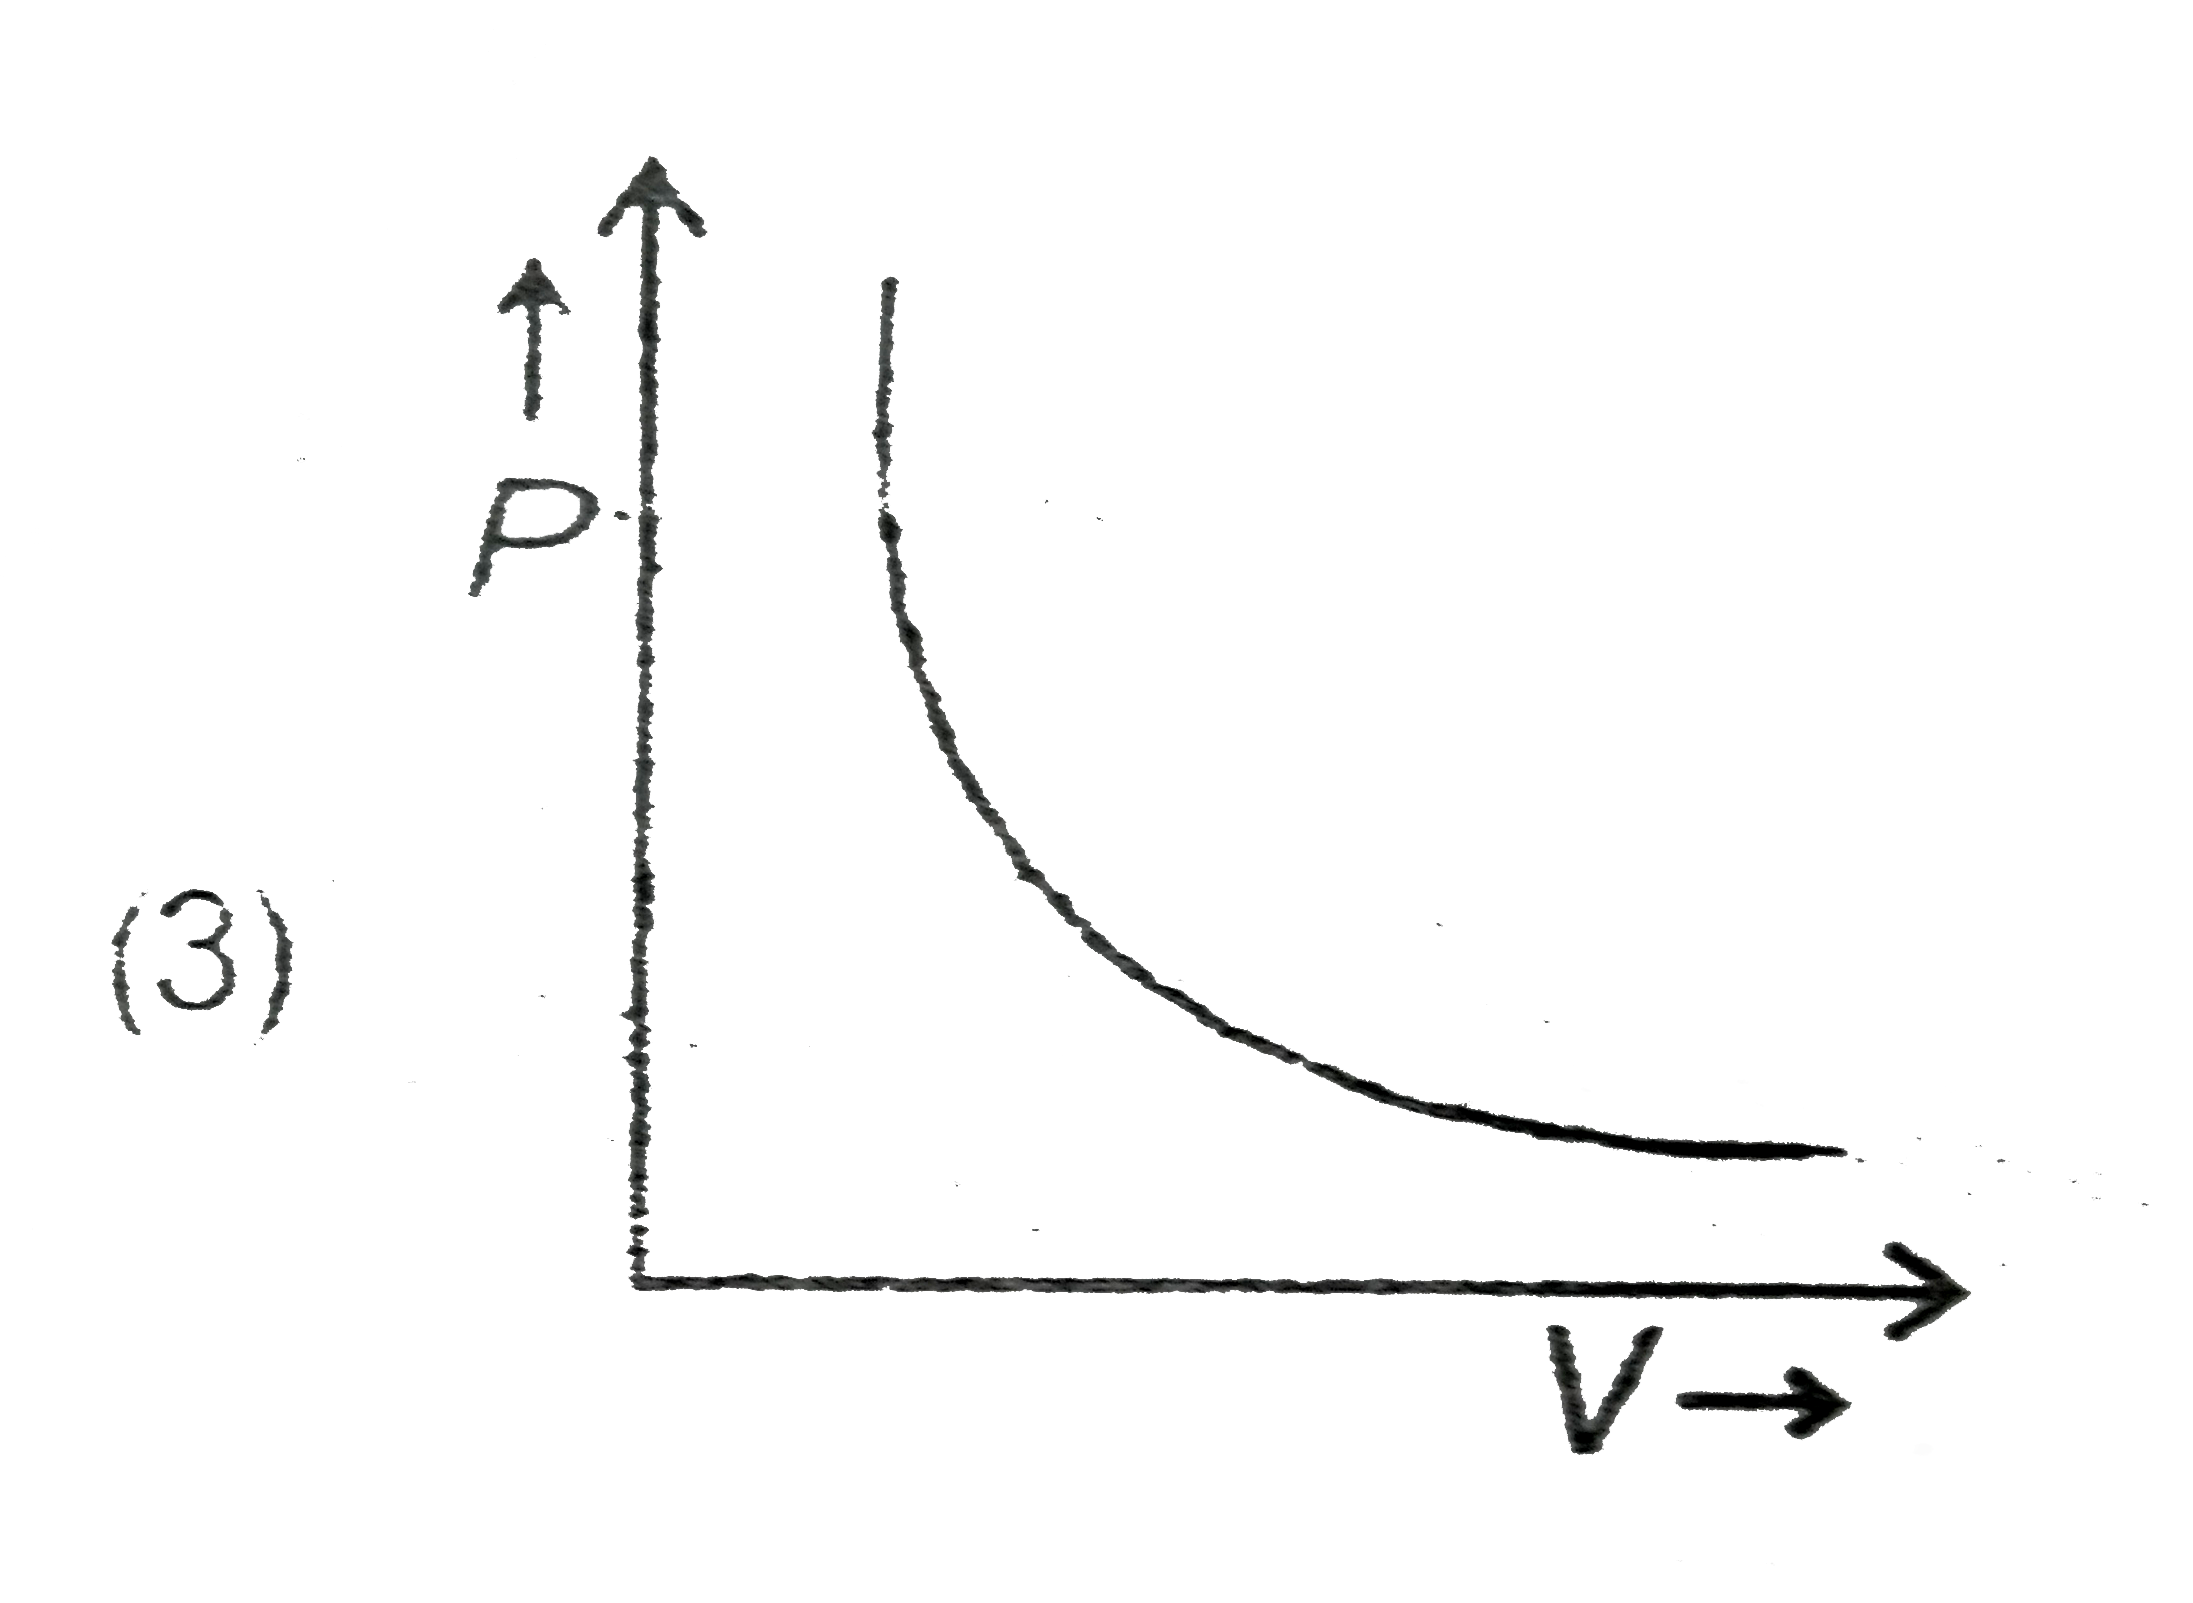 D
D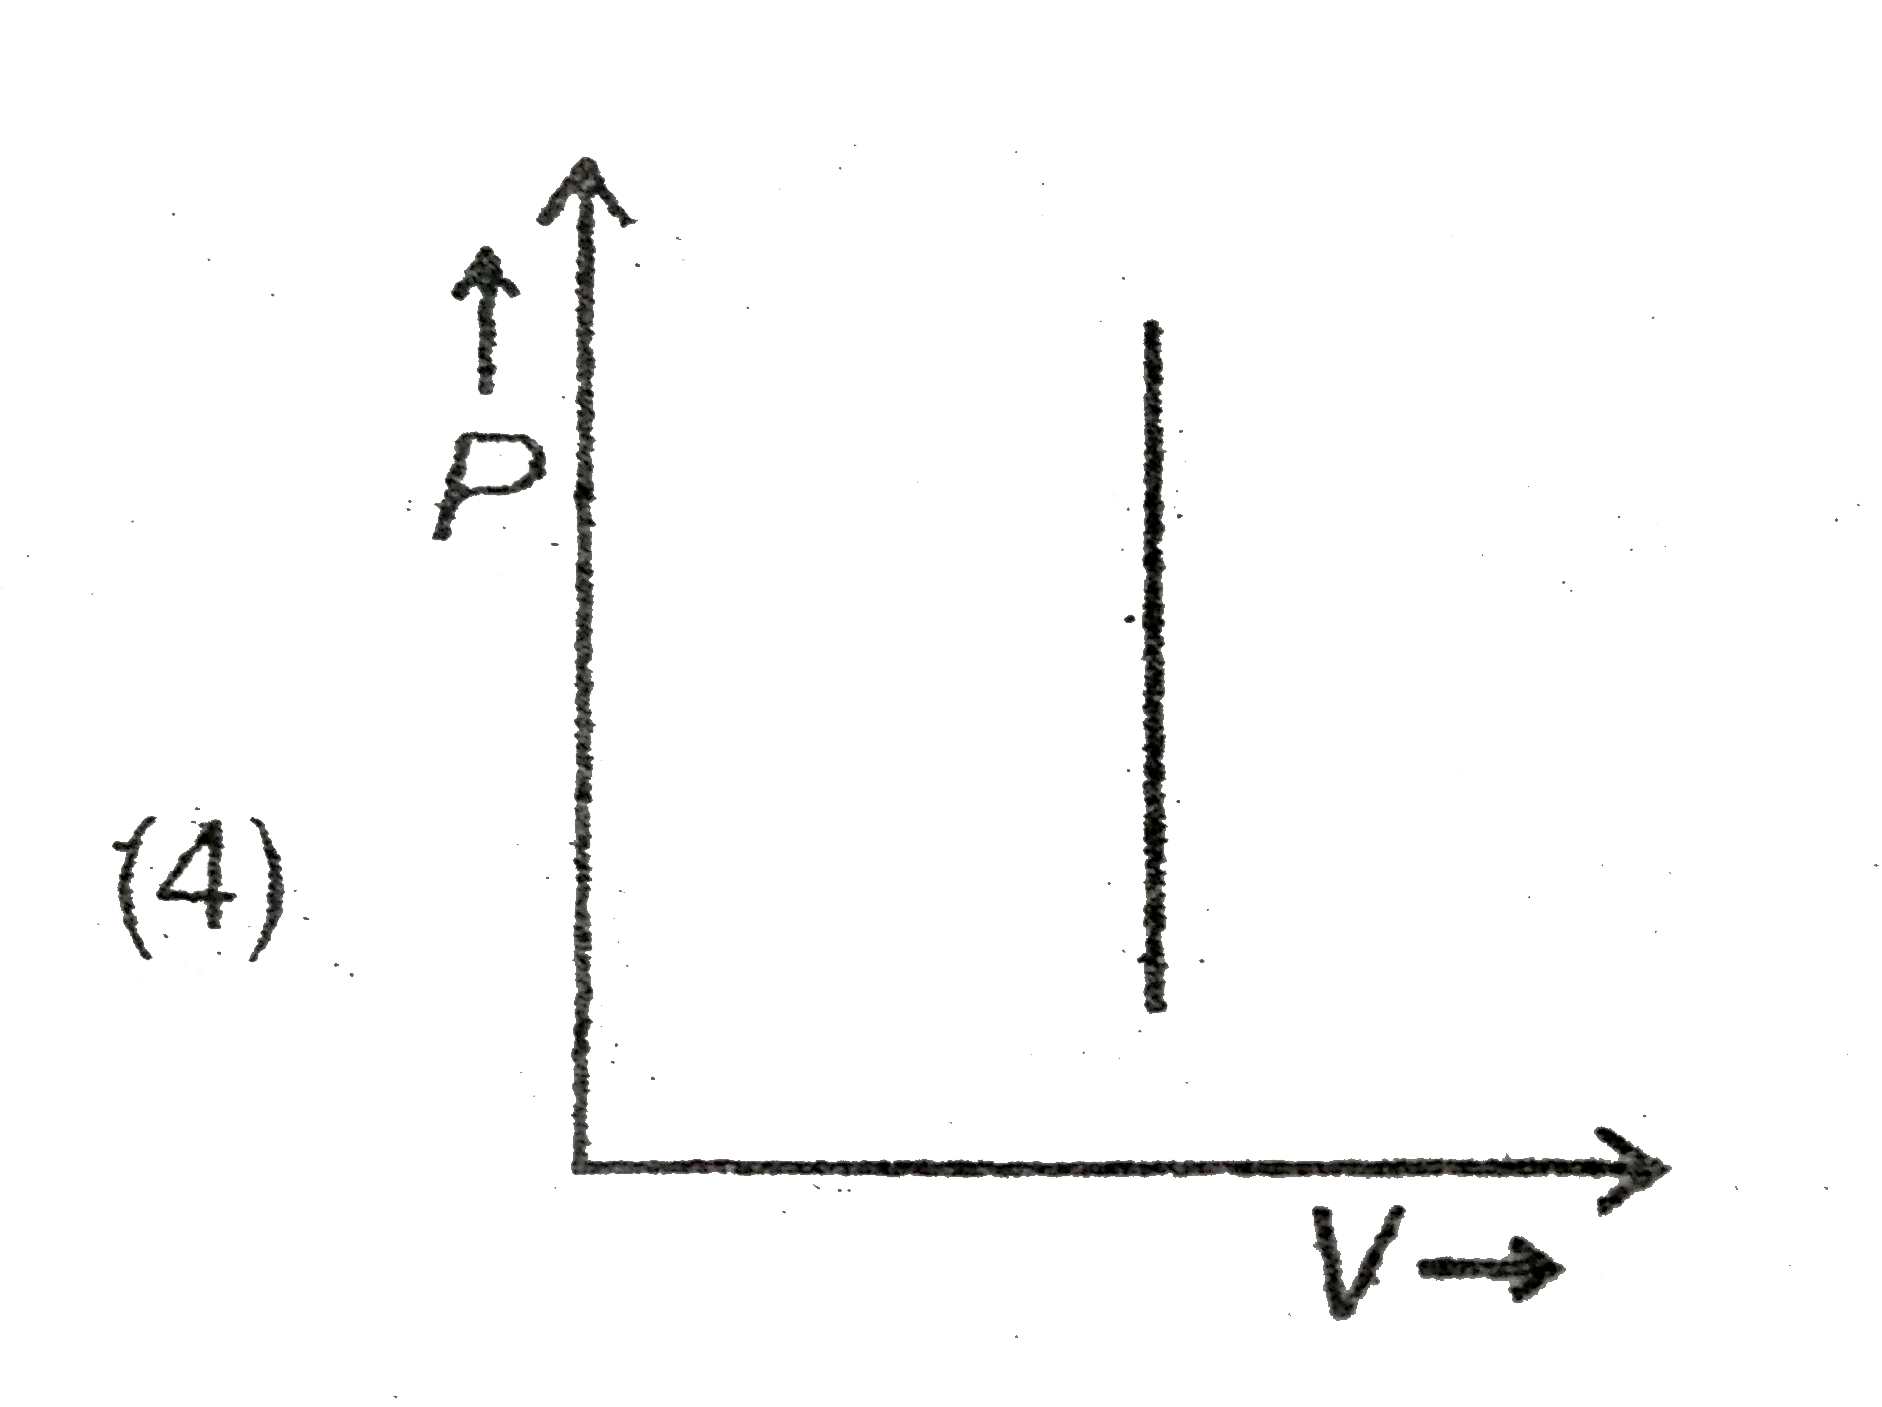
Graphs between pressure and volume are plotted at different temperatures . Which of the following isotherms represents Boyle's law as PV = constant ? (T1>T2>T3)
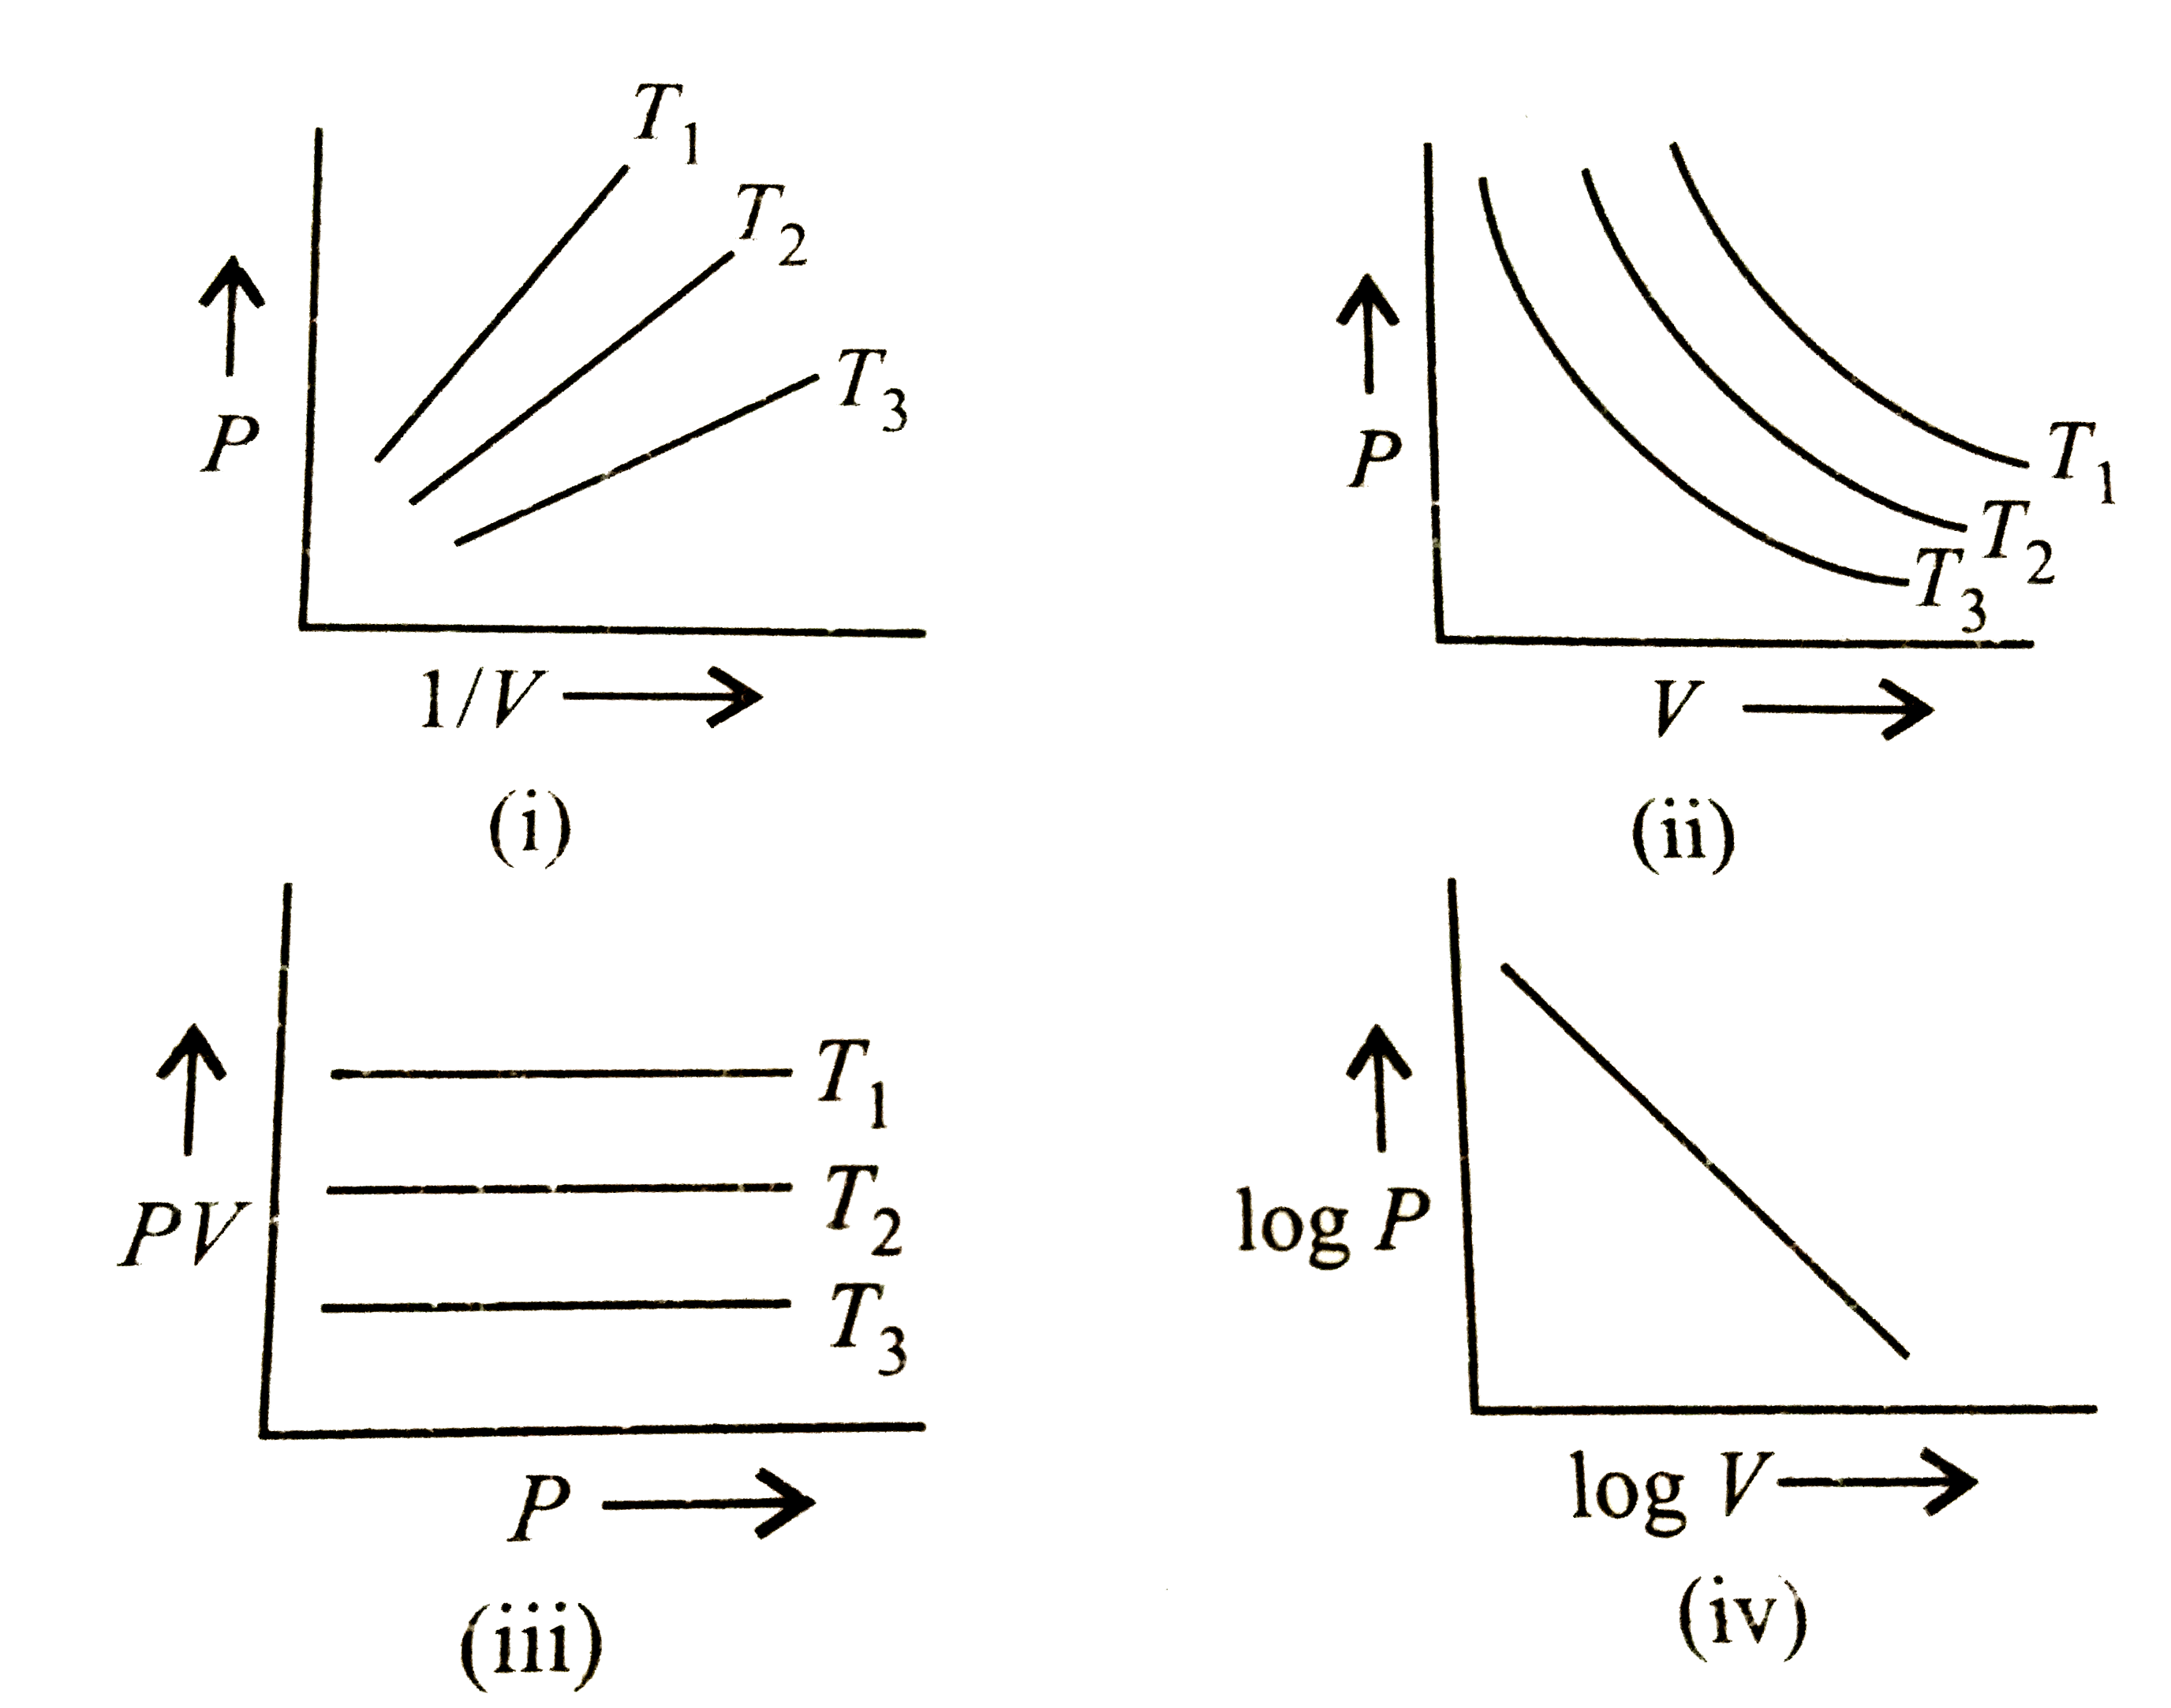
View SolutionGraphs between pressure and volume are plotted at different temperatures . Which of the following isotherms represent Boyle's law as PV = constant ? (T1>T2>T3)

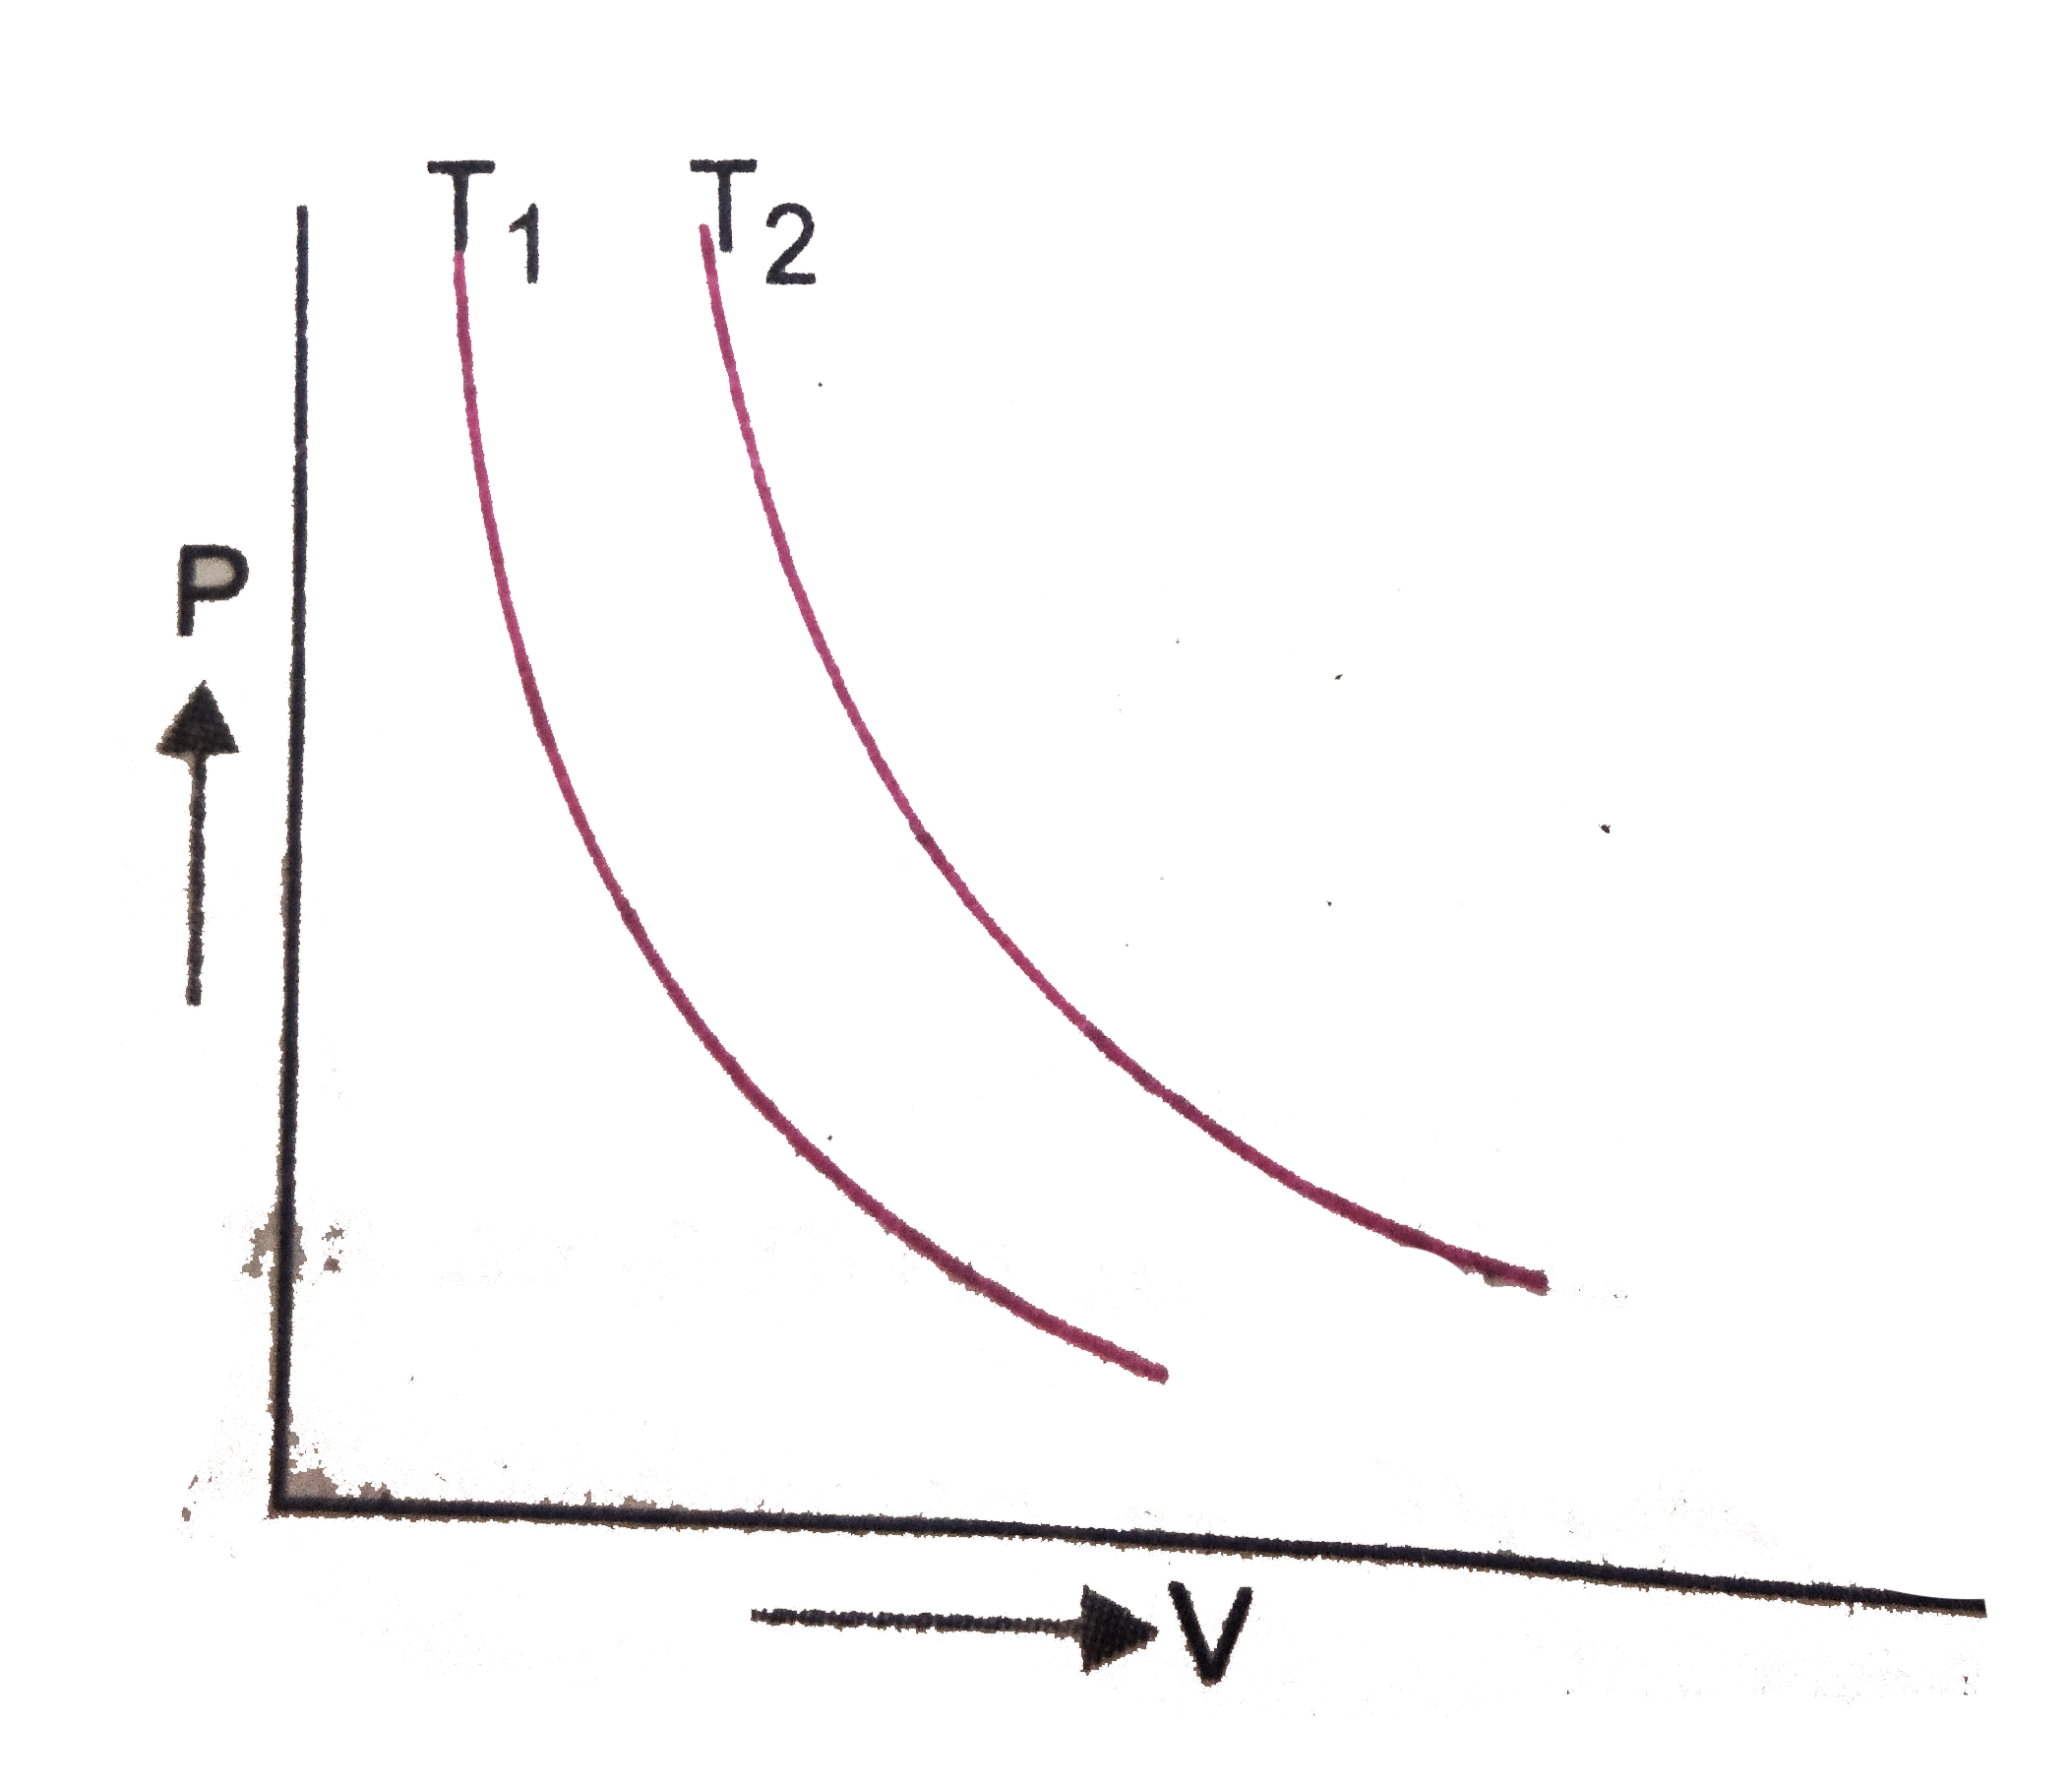
View SolutionIsothermal curves for a given mass of gas are shown at two different temperture T1andT2 in Fig. State whether T1>T2orT2>T1. Justify your answer.
View Solution(p - V) diagram of (n) moles of an ideal gas is as shown in figure. Find the maximum temperature between (A) and (B).
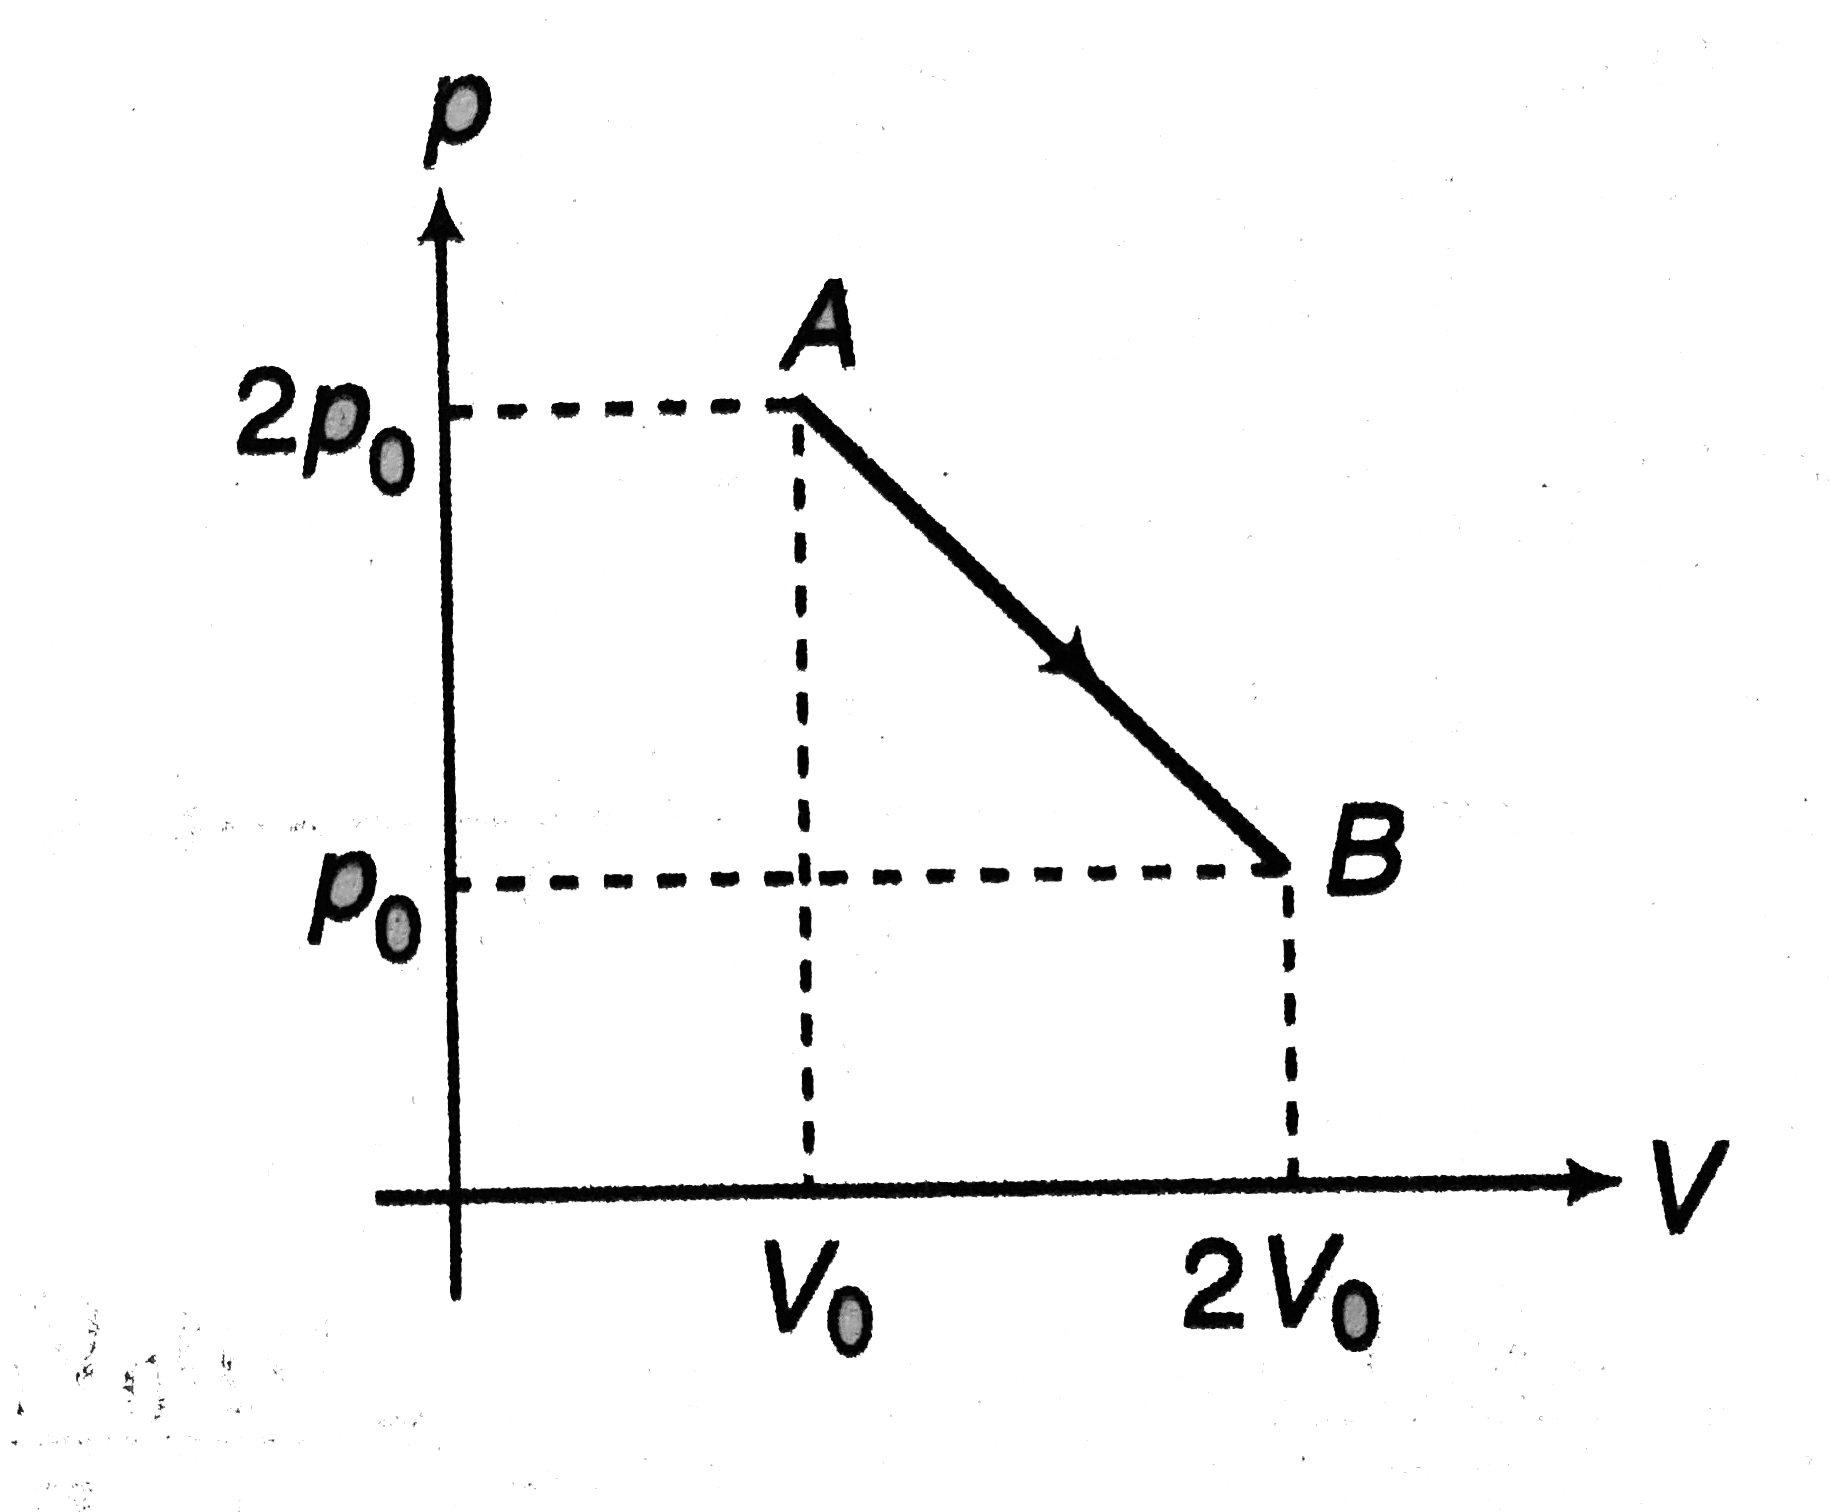 .
.
How to proceed For given number of moles of a gas,
T∝pV(pV=nRT)
Although (pV)A=(pV)B=2p0V0orTA=TB, yet it is not an isothermal process. Because in isothermal process (p- V) graph is a rectangular hyperbola while it is a straight line. So, to see the behaviour of temperature, First we will find either (T - V) equation or (T _ p) equation and from that equation we can judge how the temperature baries. From the graph, first we will write )p V) equation, then we will convert it either in (T - V) equation or in (T - p) quation with the help of equation, (pV = nRT).
View SolutionP-V graph of a cyclic process is as shown in the figure.Then its correct T-V curve would be
View Solution
