The resistivity (ρ) of semiconductor varies with temperature. Which of the following curve represents the correct behaviour?
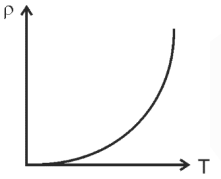
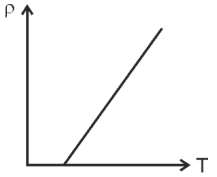
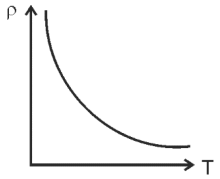
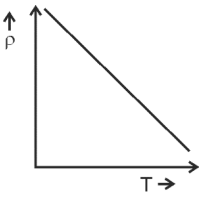
The correct Answer is:C
To solve the problem of how the resistivity (ρ) of a semiconductor varies with temperature (T), we can follow these steps:
Step 1: Understand the relationship between resistivity and temperature
The resistivity of semiconductors generally decreases with an increase in temperature. This is because, as temperature rises, more charge carriers (electrons and holes) become available for conduction.
Step 2: Establish the mathematical relationship
The resistivity (ρ) can be expressed as inversely proportional to temperature (T). This can be mathematically represented as:
ρ∝1T
This implies:
ρ=KT
where K is a constant.
Step 3: Analyze the graph of the relationship
The equation ρ=KT indicates that as temperature (T) increases, the resistivity (ρ) decreases. This is characteristic of a hyperbolic curve, which approaches the x-axis (temperature axis) but never touches it.
Step 4: Identify the correct curve
In a graph where the x-axis represents temperature (T) and the y-axis represents resistivity (ρ), the curve will start at a higher value of resistivity when T is low and will decrease as T increases. Therefore, the correct graph will show a downward trend.
Conclusion
Based on the analysis, the correct option that represents the behavior of the resistivity of a semiconductor with temperature is Option 2.
The resistivity of semiconductors generally decreases with an increase in temperature. This is because, as temperature rises, more charge carriers (electrons and holes) become available for conduction.
The resistivity (ρ) can be expressed as inversely proportional to temperature (T). This can be mathematically represented as:
ρ∝1T
This implies:
ρ=KT
where K is a constant.
The equation ρ=KT indicates that as temperature (T) increases, the resistivity (ρ) decreases. This is characteristic of a hyperbolic curve, which approaches the x-axis (temperature axis) but never touches it.
In a graph where the x-axis represents temperature (T) and the y-axis represents resistivity (ρ), the curve will start at a higher value of resistivity when T is low and will decrease as T increases. Therefore, the correct graph will show a downward trend.
Based on the analysis, the correct option that represents the behavior of the resistivity of a semiconductor with temperature is Option 2.
Topper's Solved these Questions
Similar Questions
Knowledge Check
Which of the following curves represents a third order reaction ?
A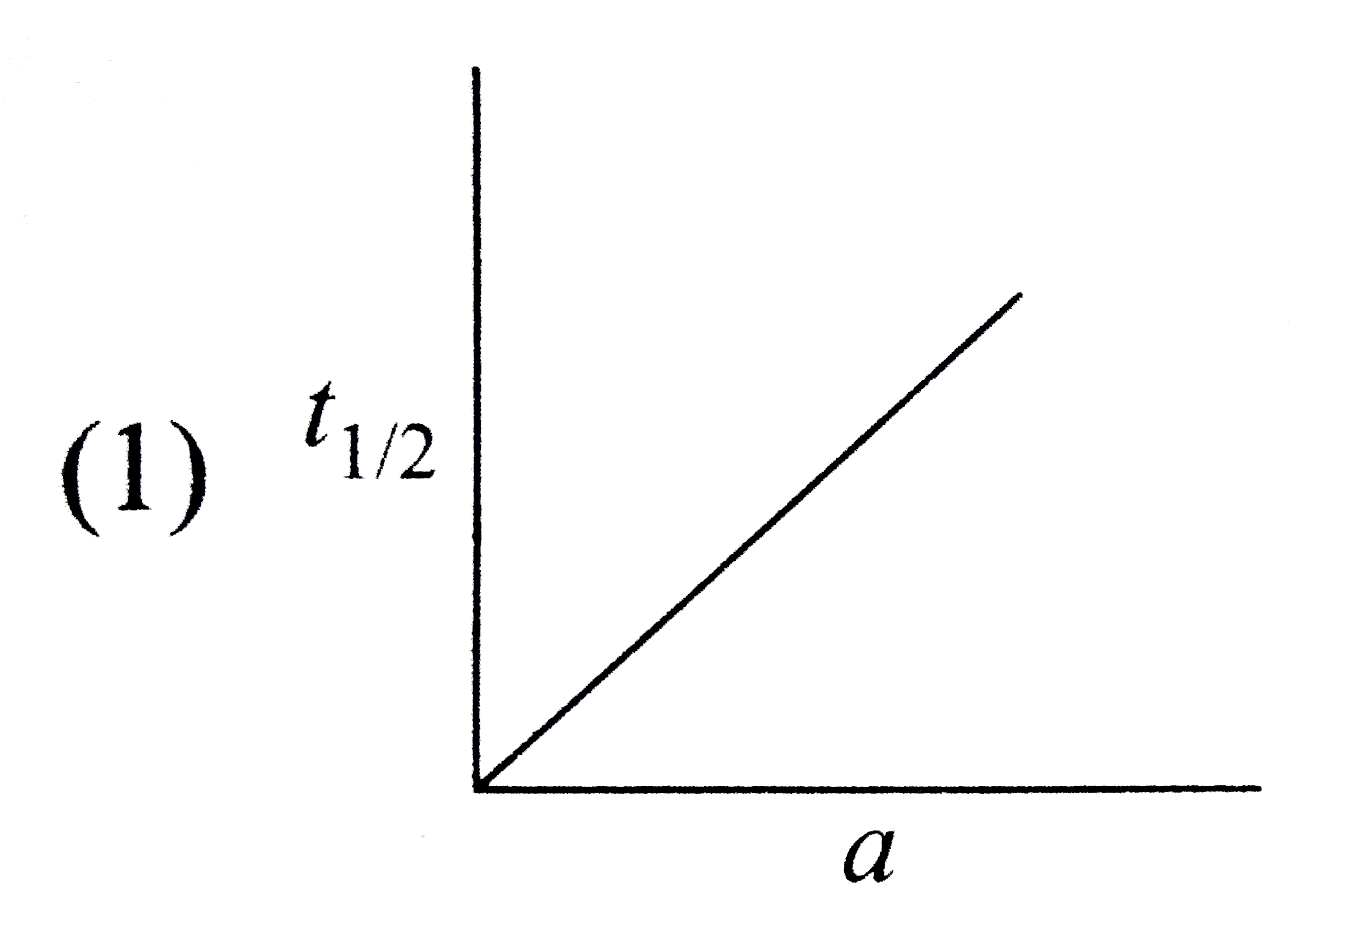 B
B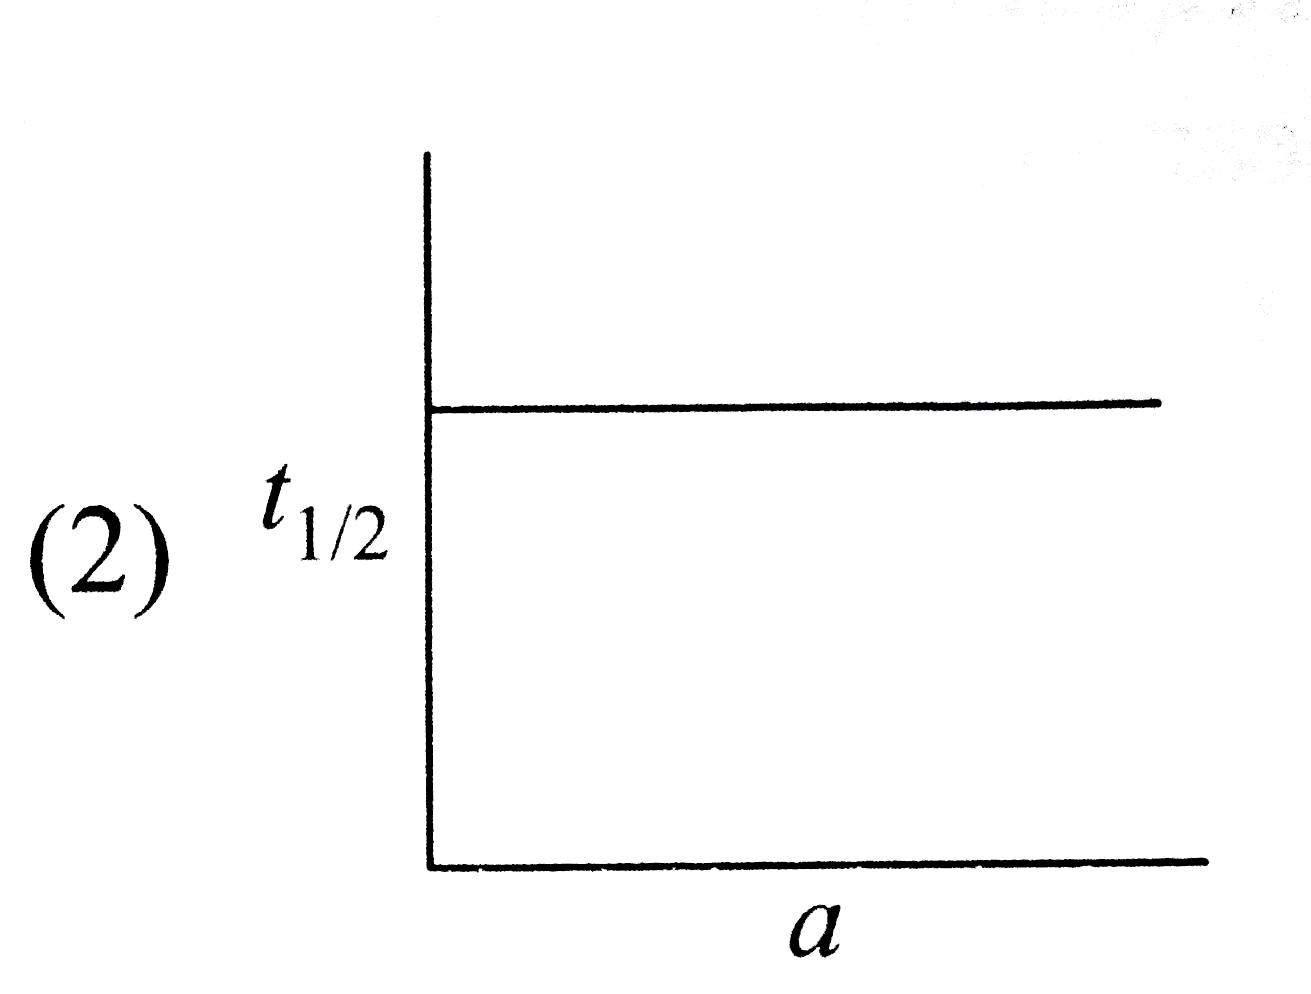 C
C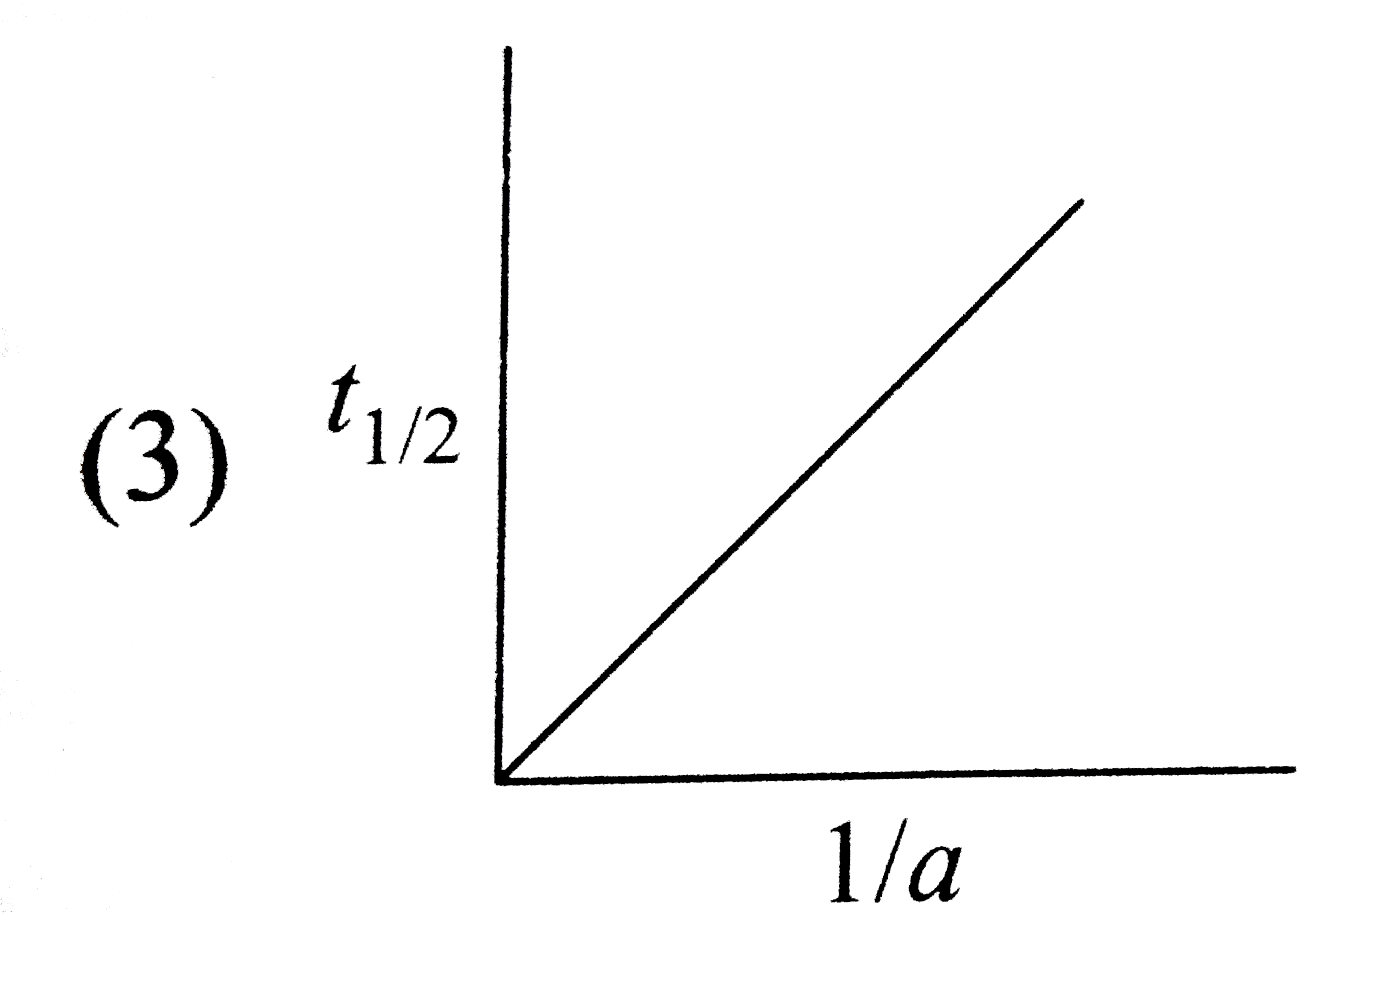 D
D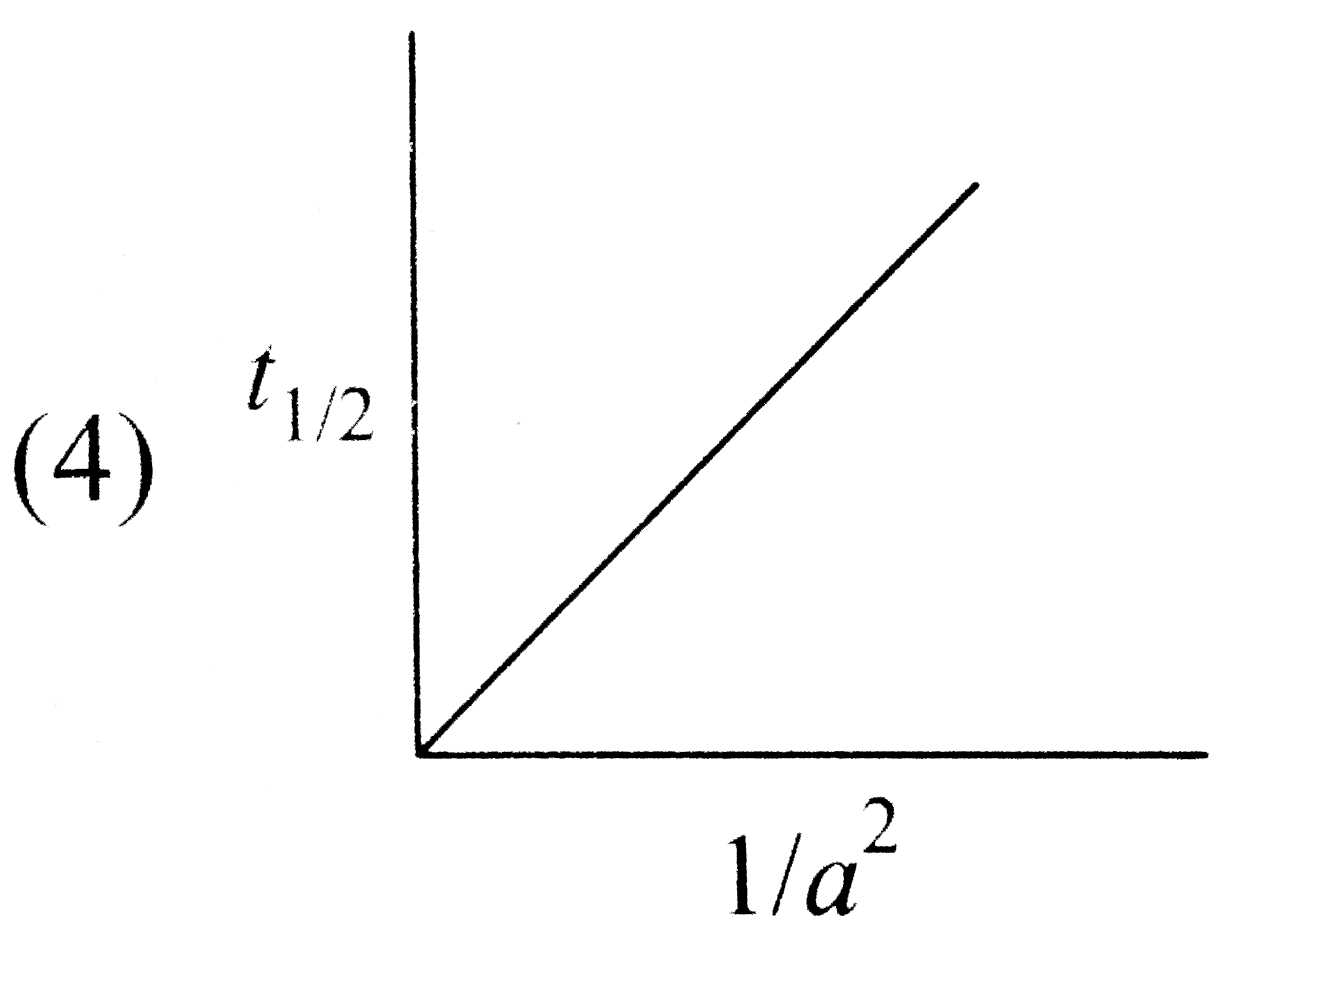
Which of the following curves represent the Henry's law
A B
B C
C D
D
Which of the following curves represents the Henry's law ?
A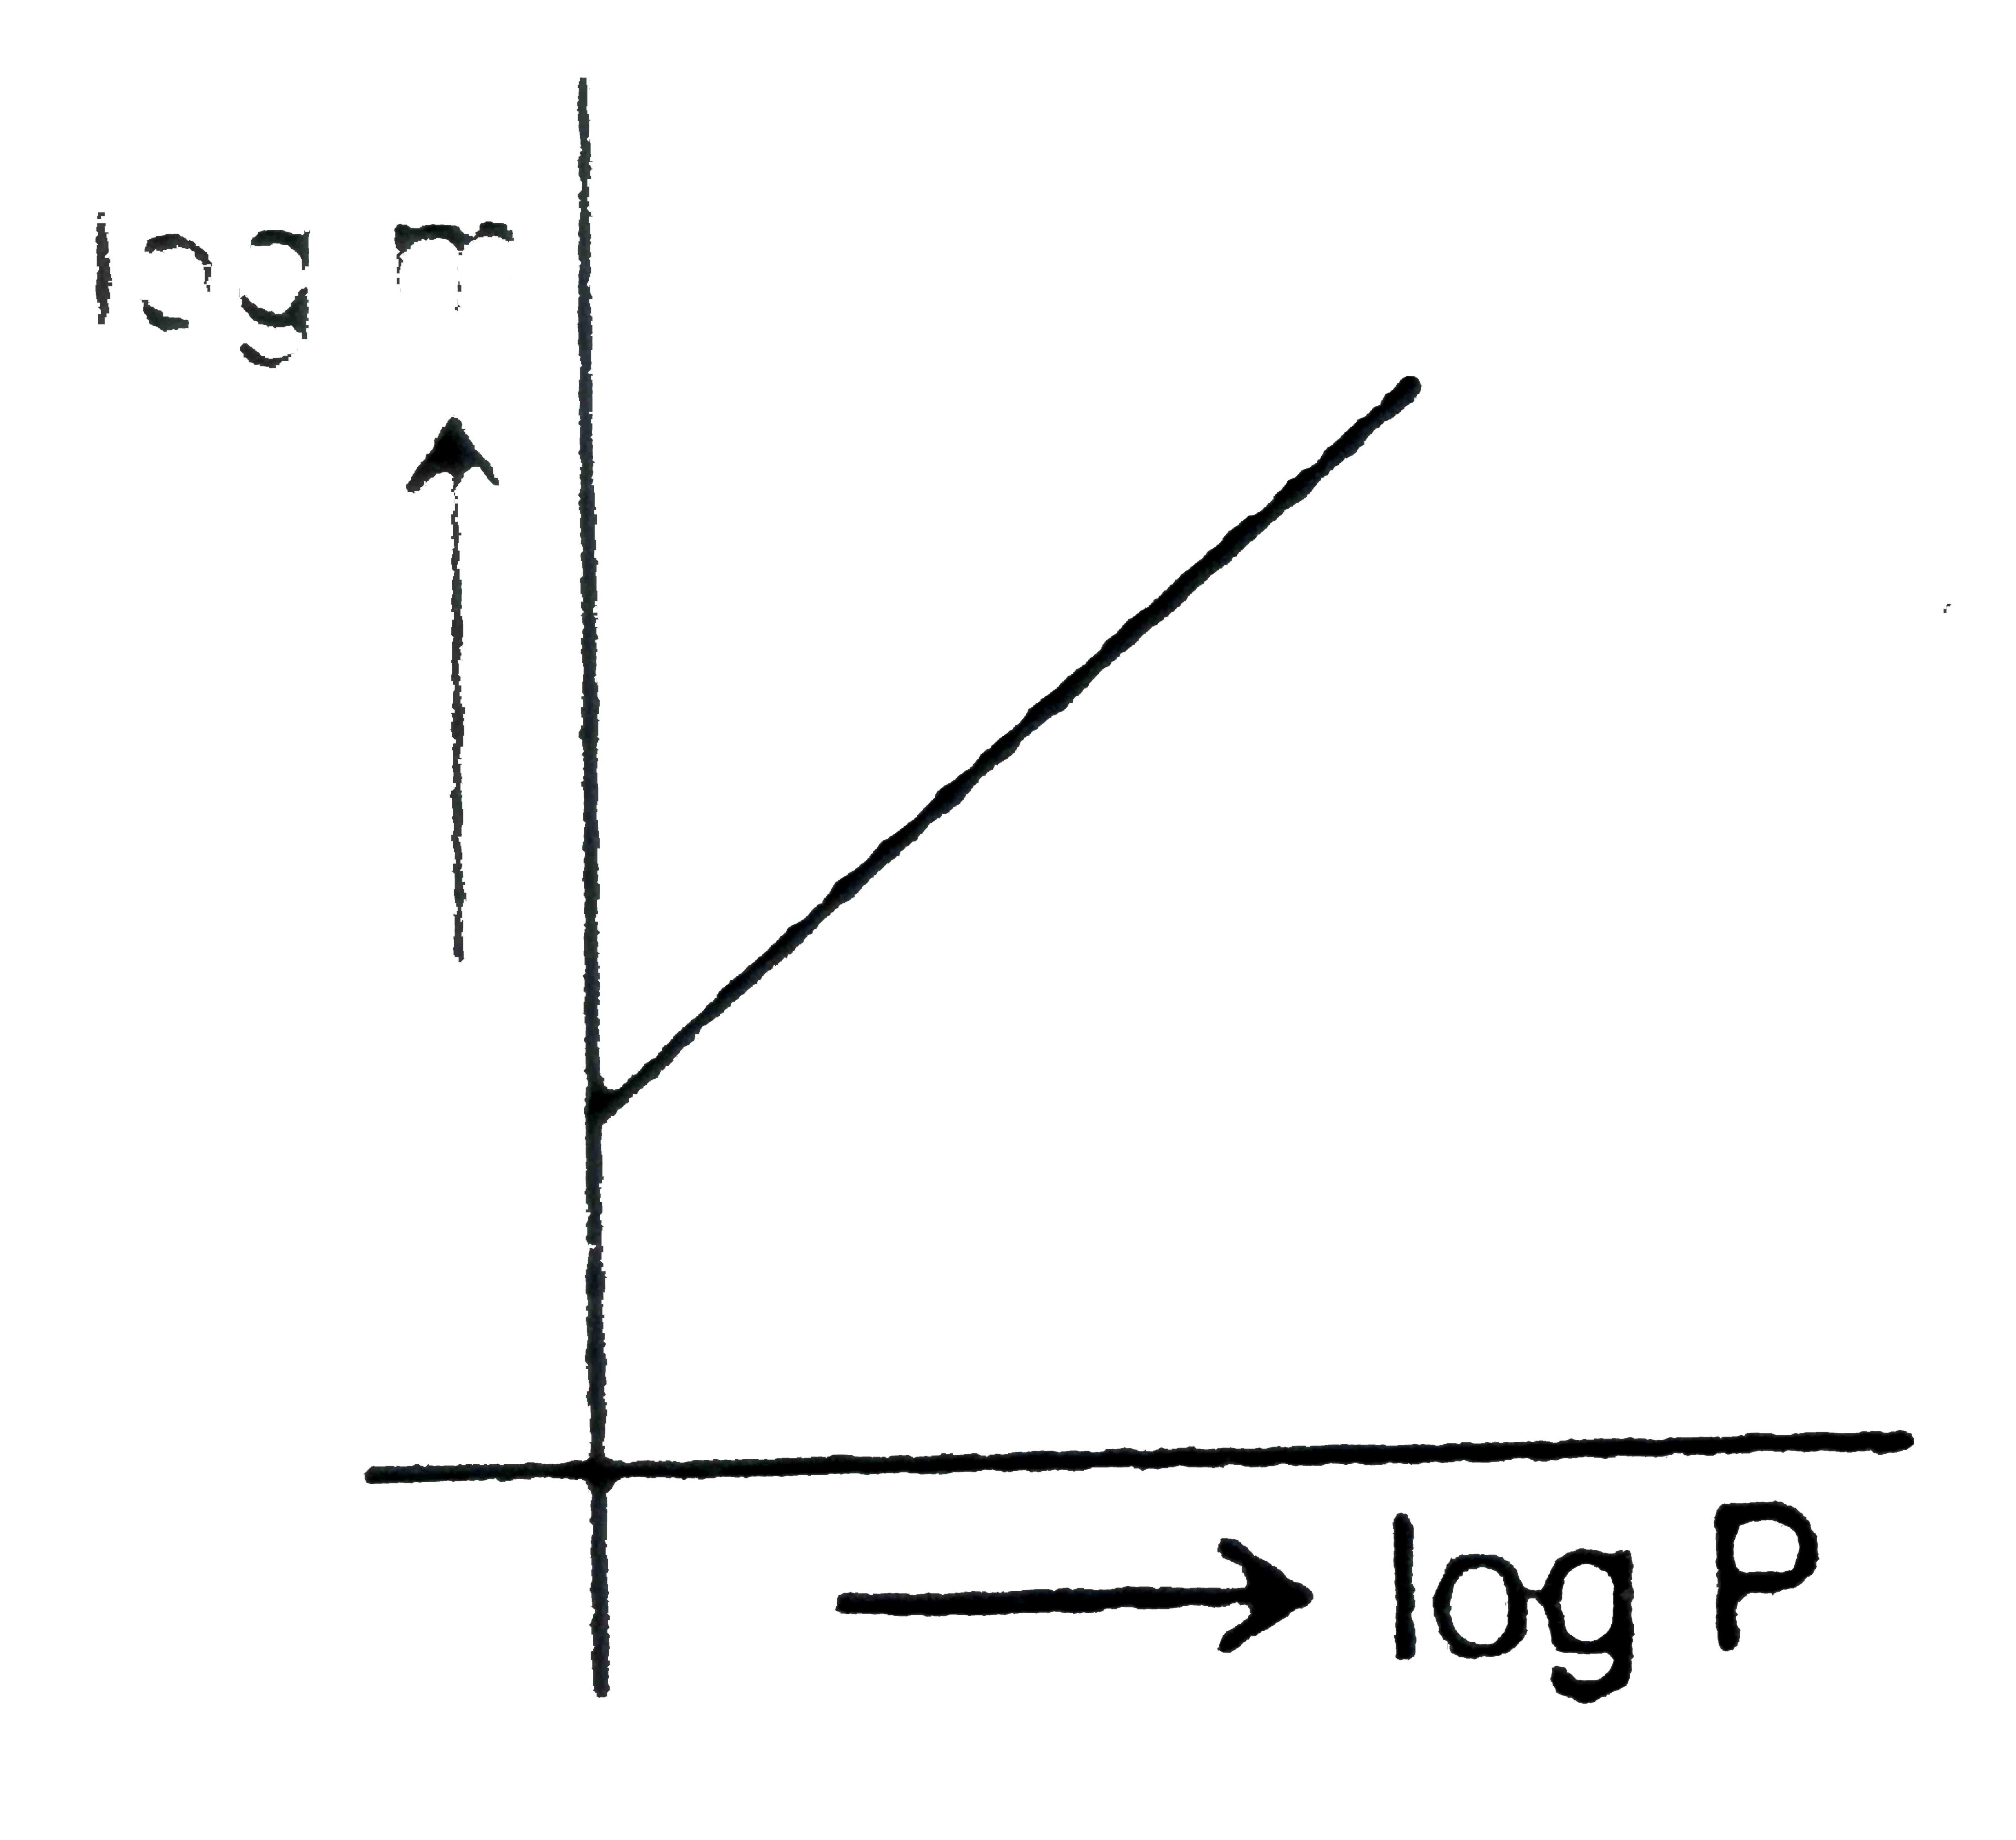 B
B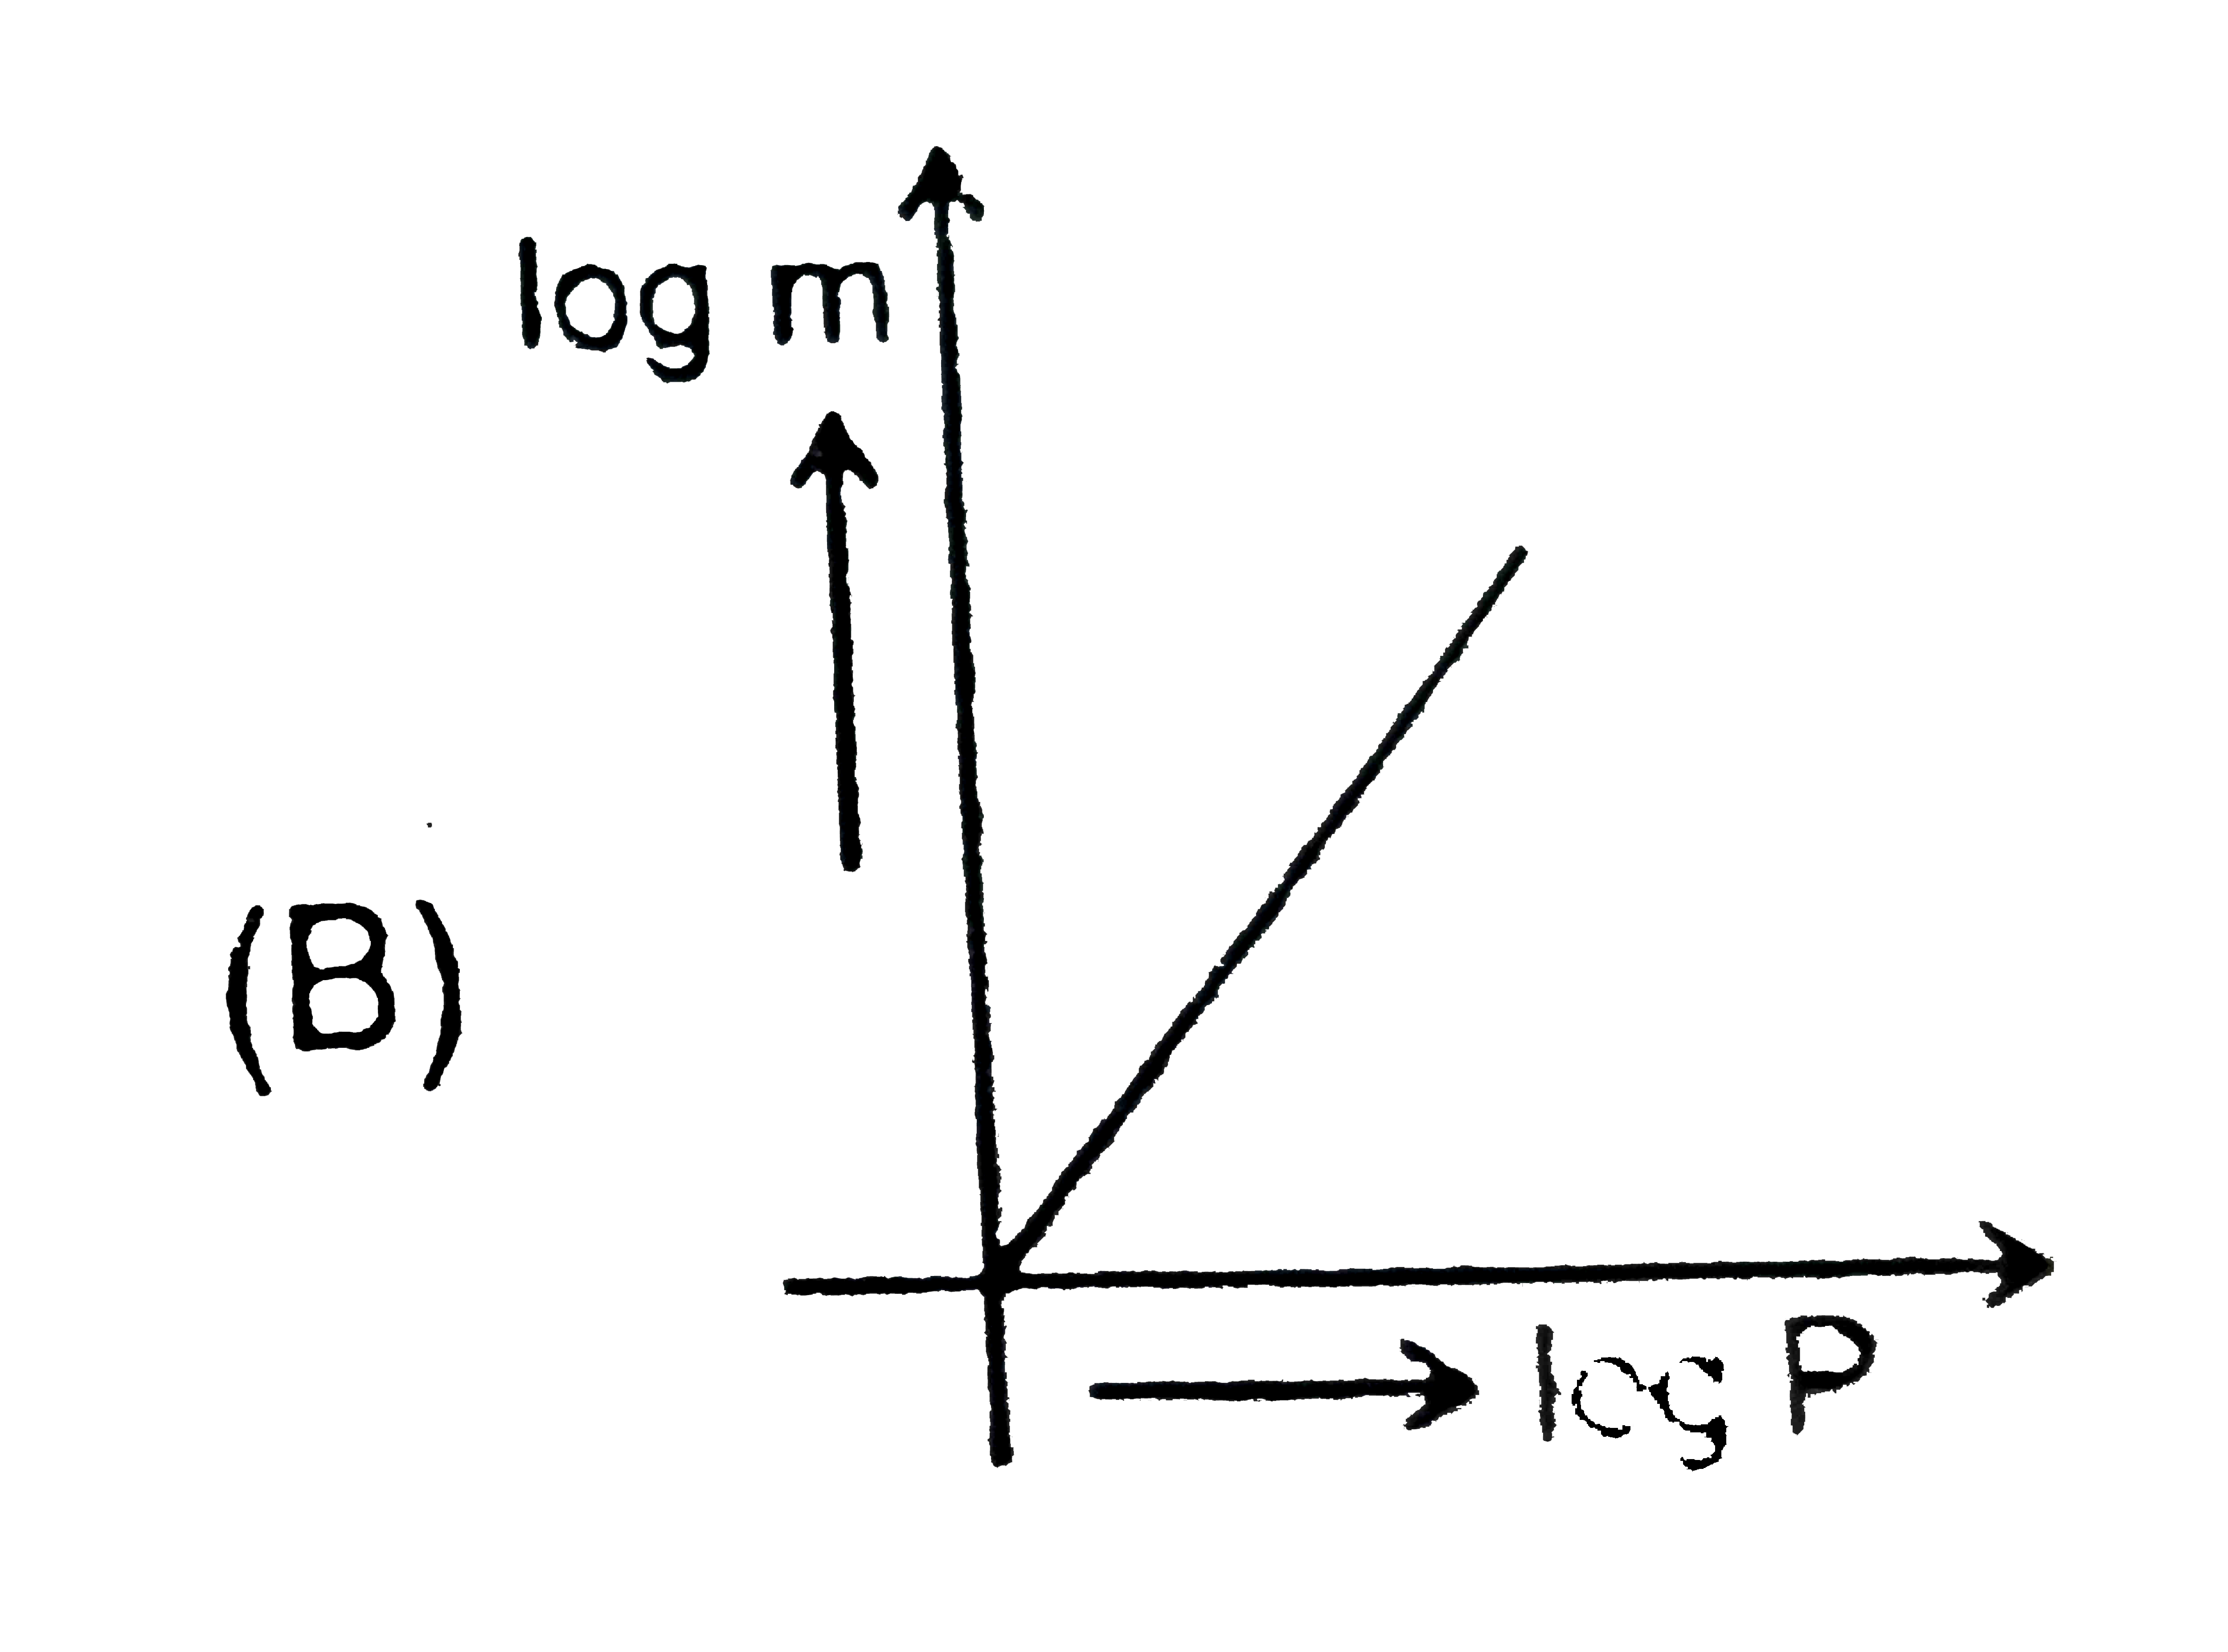 C
C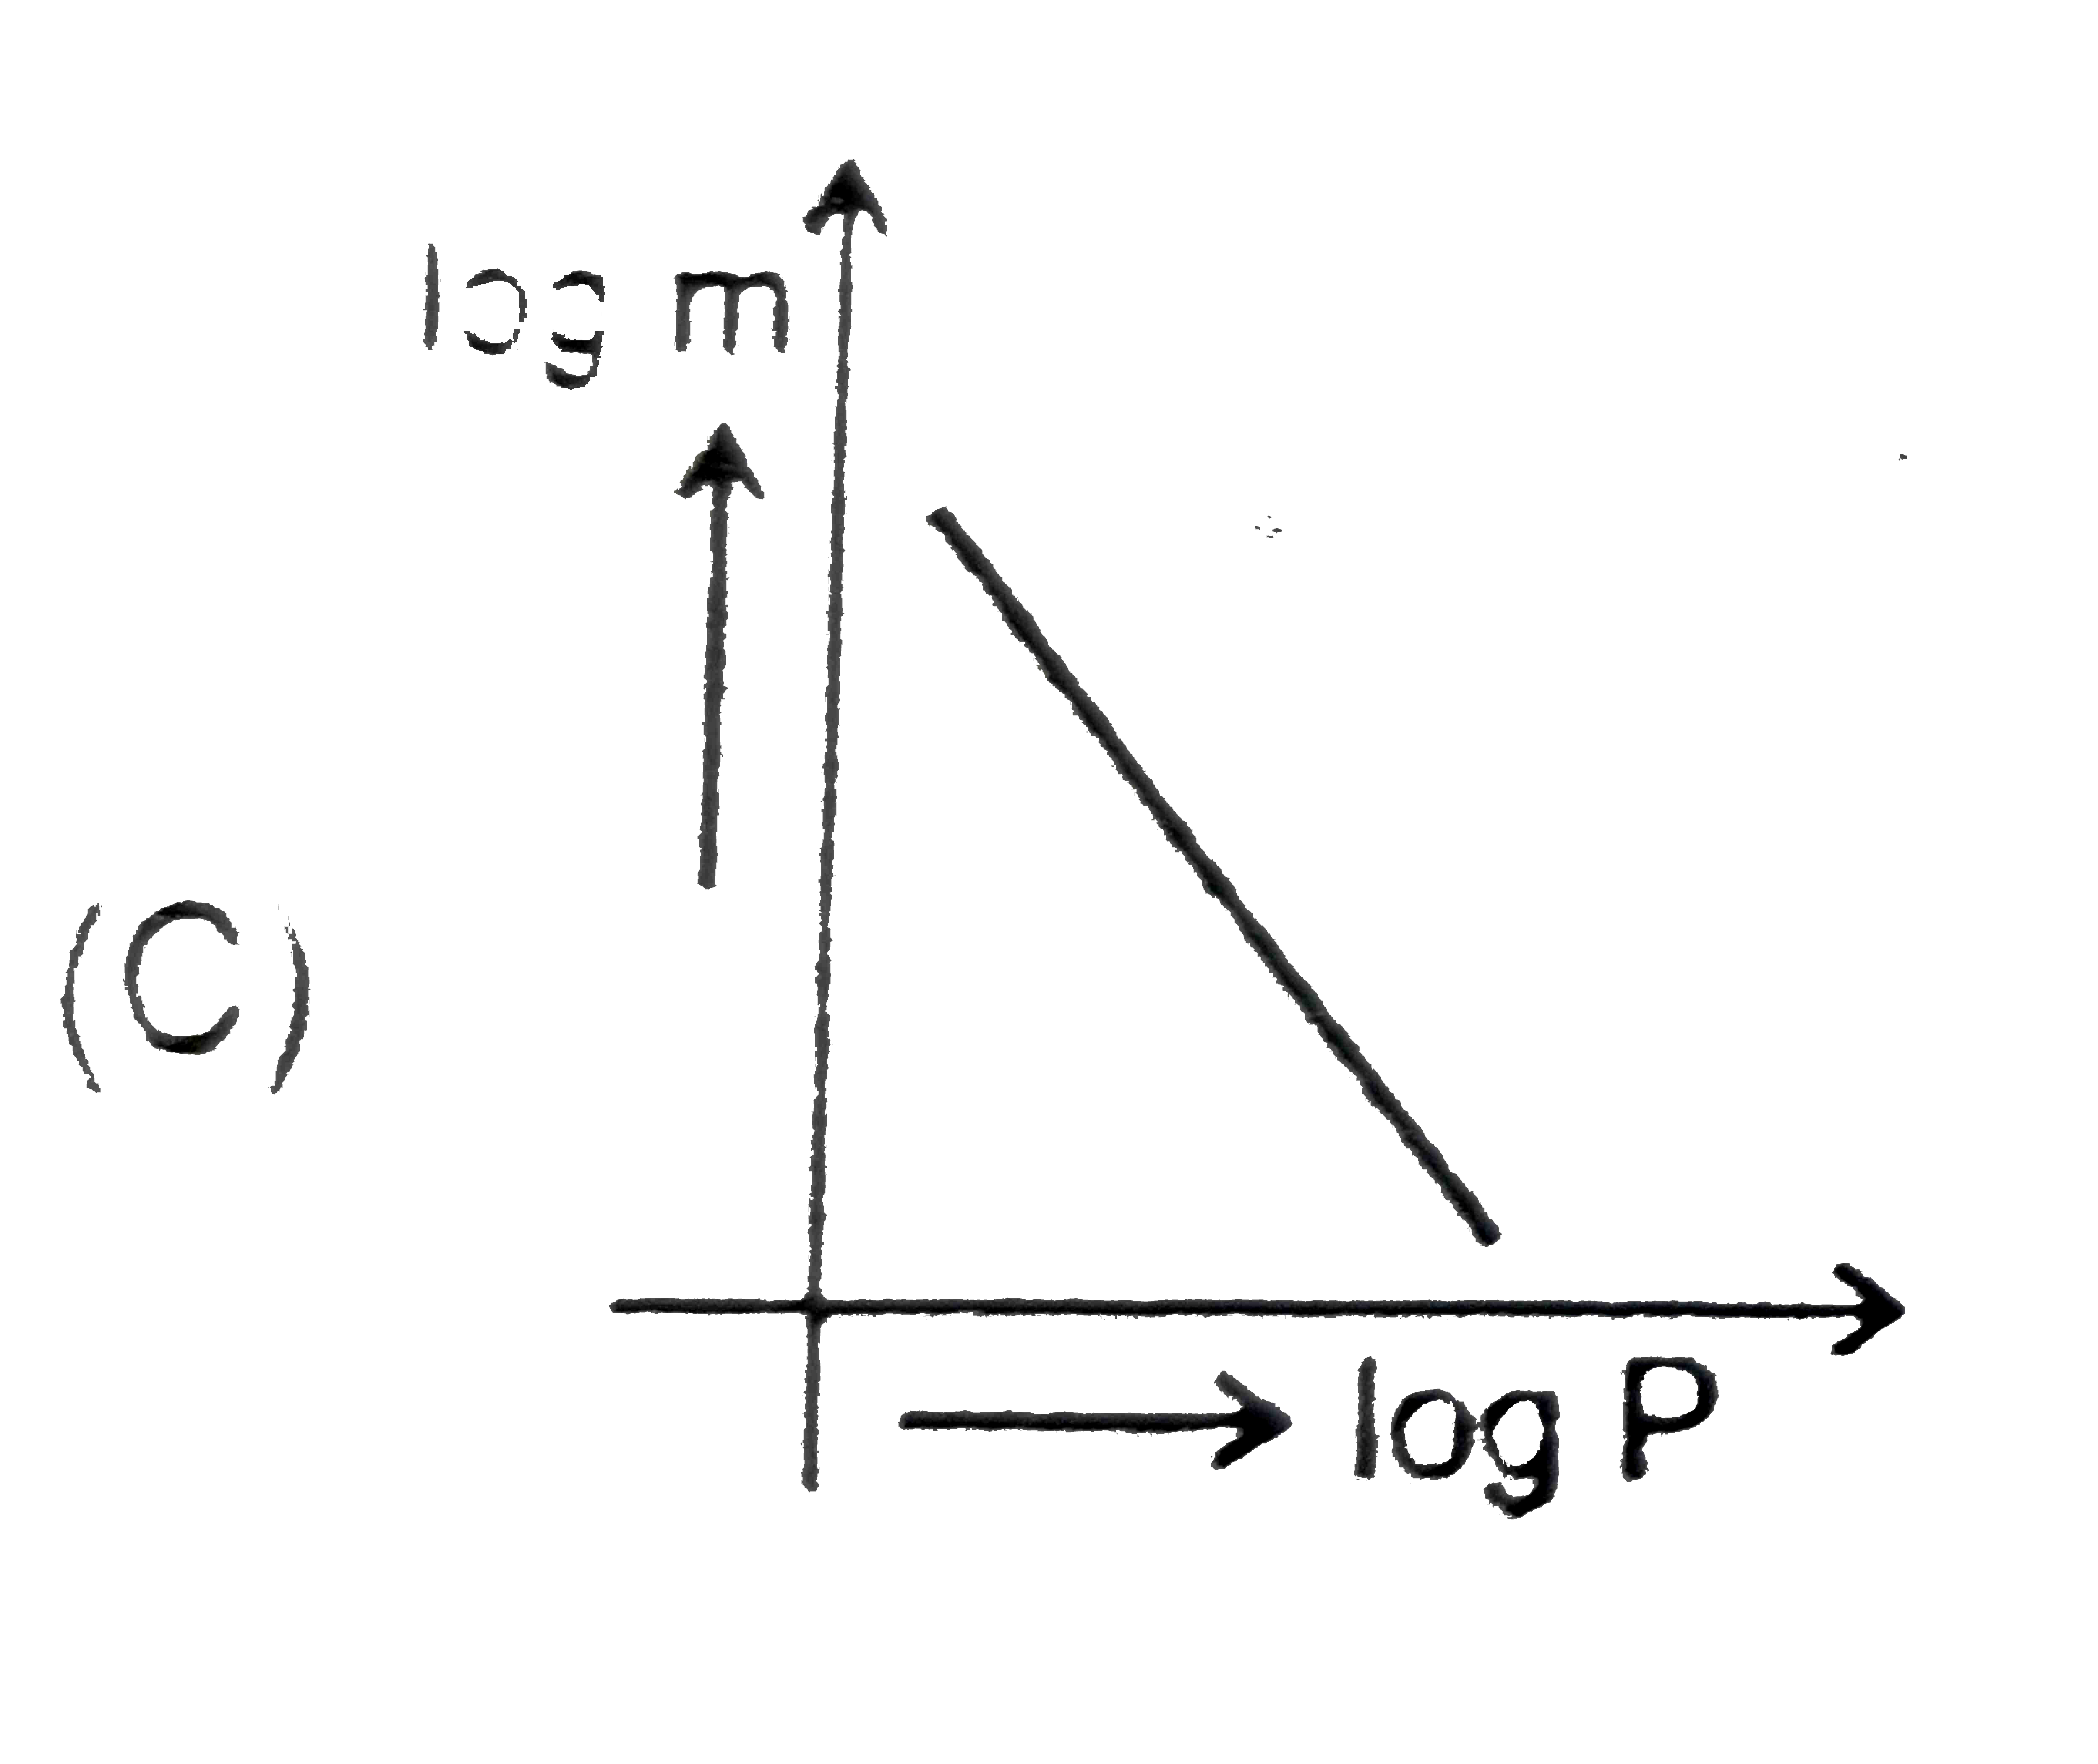 D
D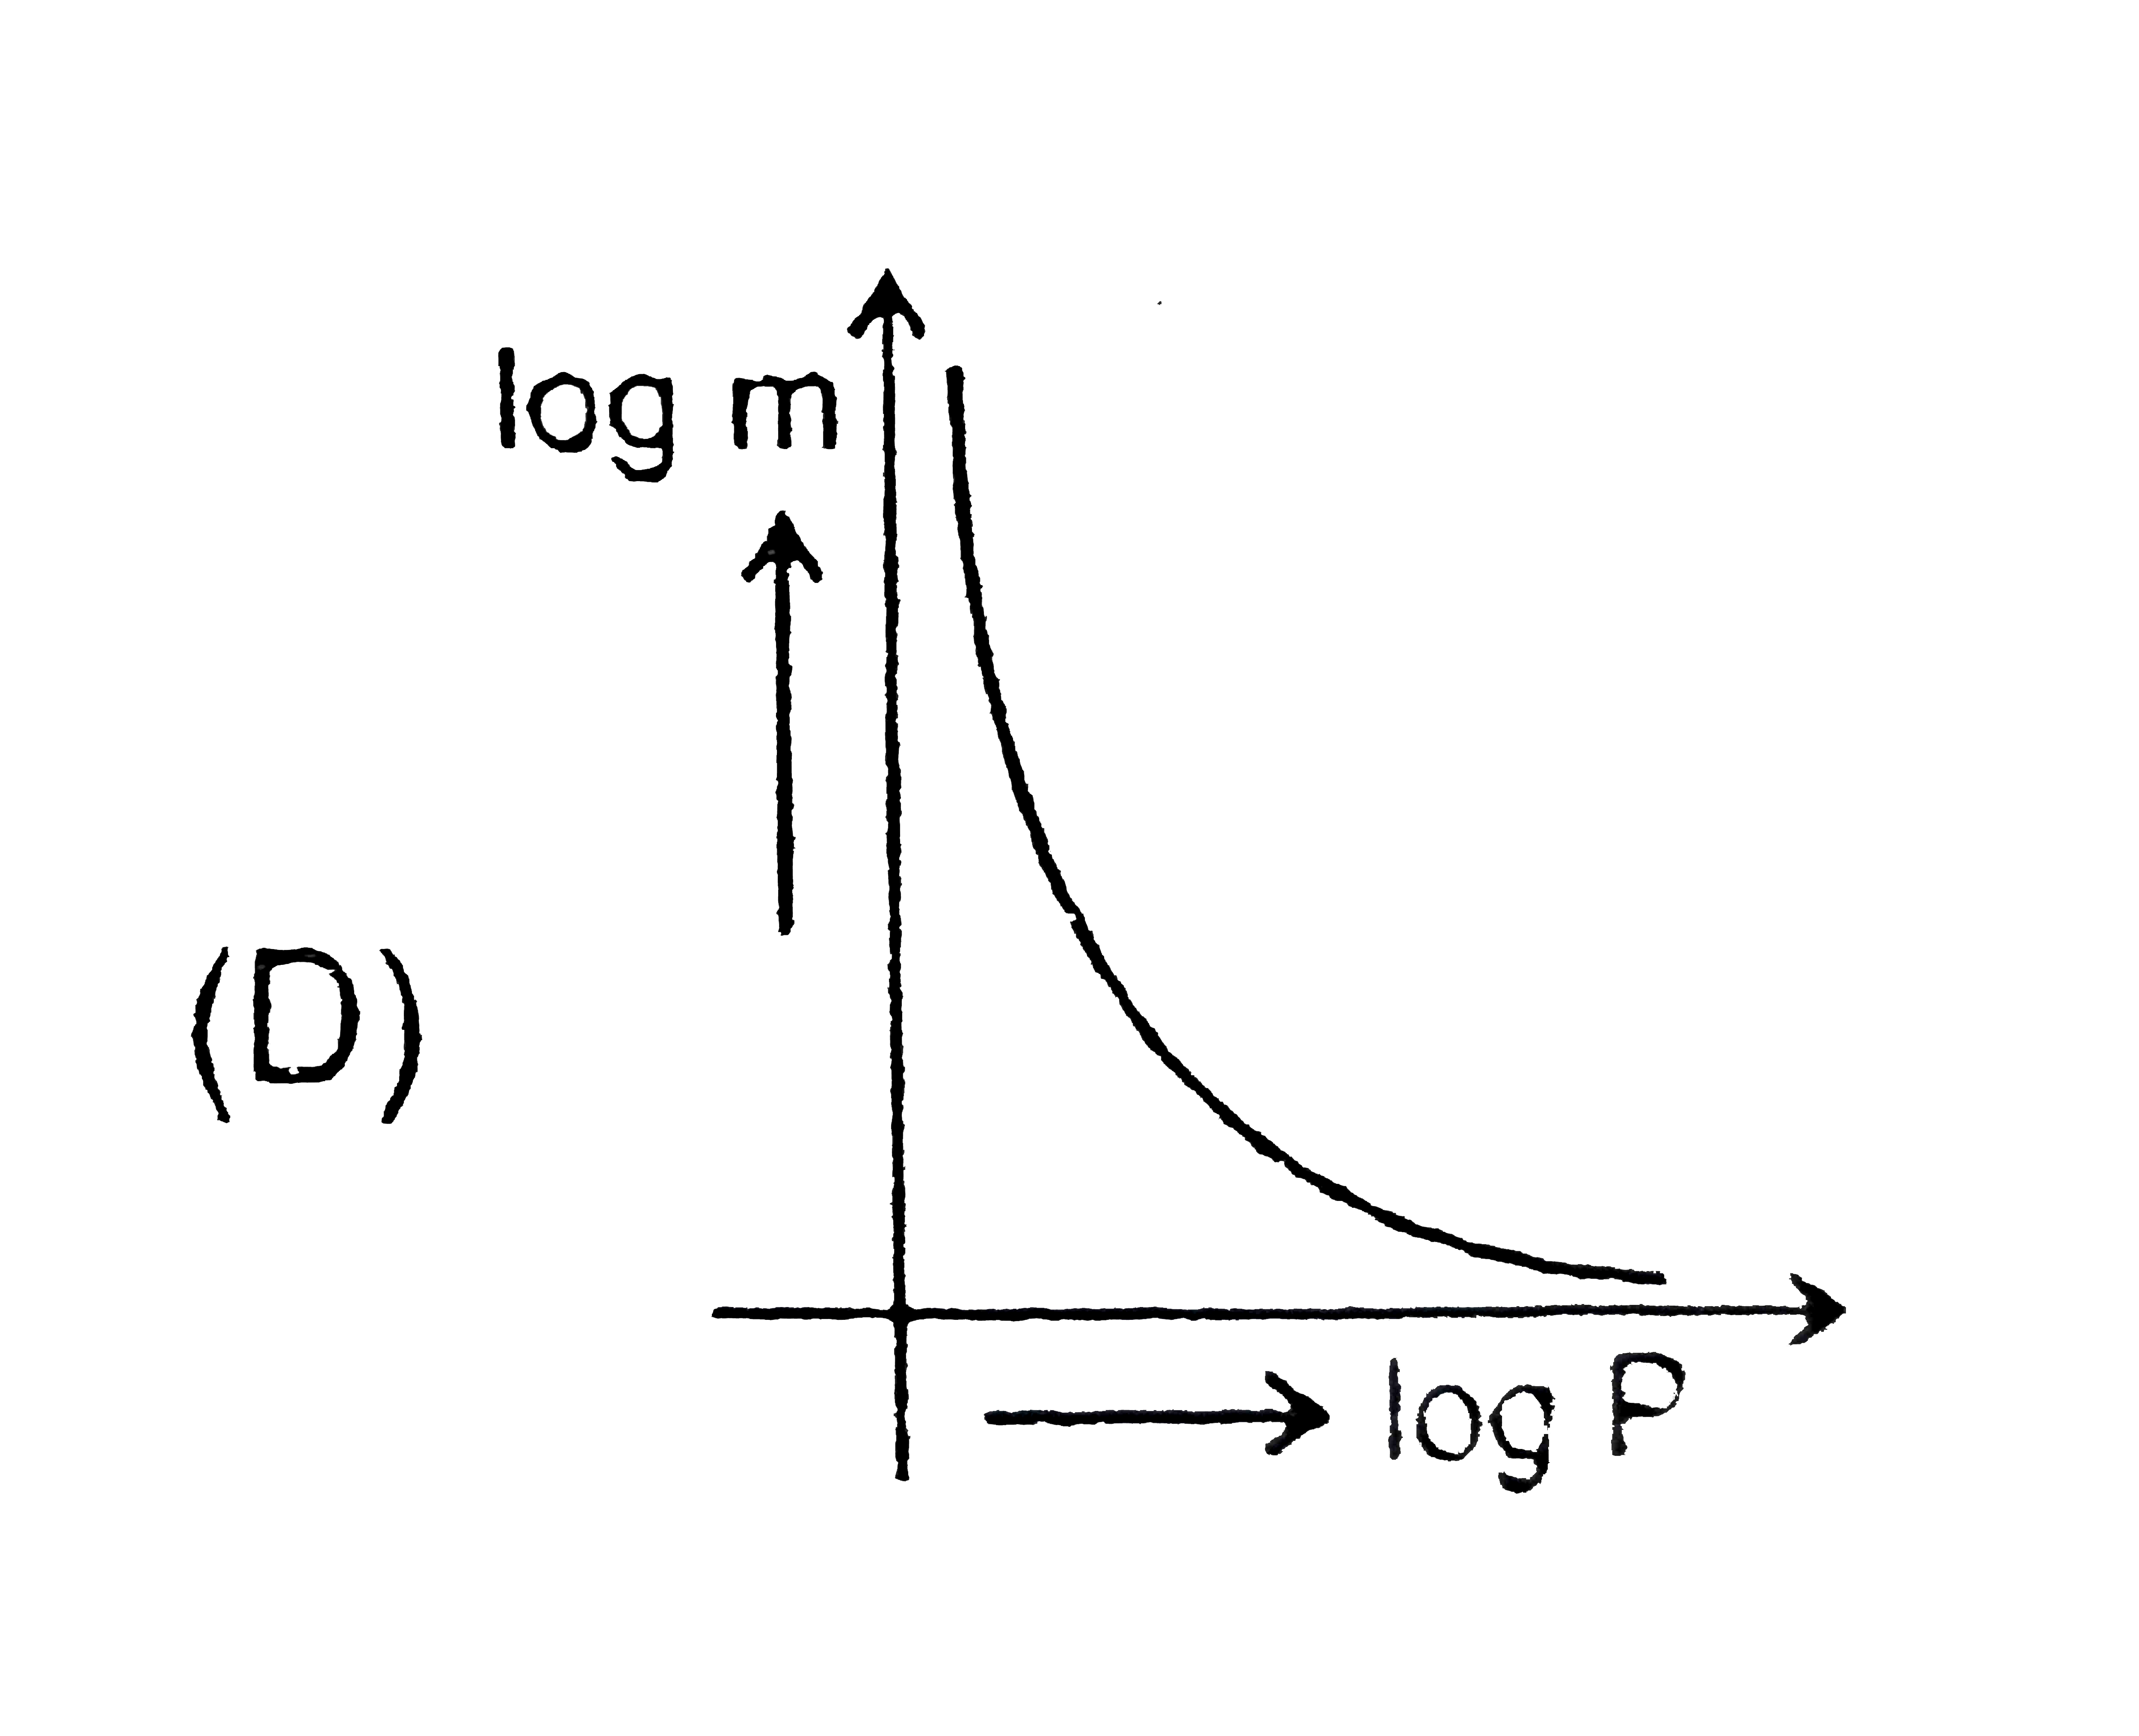
Which of the following curves represents a third order reaction ?
View SolutionWhich of the following curves represents a first order reaction.
View SolutionWhich of the following curves represent(s) Boyle's law?
View SolutionWhich of the following represents market demand curve ?

View SolutionWhich of the following graphs represent the behaviour of an ideal gas ?
View Solution
