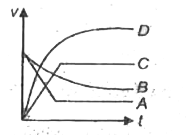
A small steel ball is dropped into a long cylinder containing glycerine.Which one of the following is the correct representation of the velocity time graph for the transit of the ball?
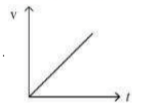
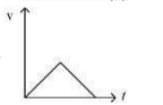
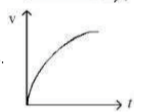
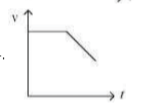
To solve the problem of determining the correct velocity-time graph for a small steel ball dropped into a long cylinder filled with glycerine, we can follow these steps:
Step 1: Understand the Initial Condition
When the steel ball is initially dropped into glycerine, it starts from rest. Therefore, at time t=0, the velocity v=0.
Step 2: Analyze the Motion
As the ball falls through the glycerine, it experiences two main forces:
- The gravitational force acting downward.
- The viscous drag force acting upward, which opposes the motion of the ball.
Initially, the gravitational force is greater than the viscous drag, so the ball will accelerate downwards, causing its velocity to increase.
Step 3: Consider the Effect of Viscosity
As the ball continues to fall, the velocity increases until the viscous drag force becomes equal to the gravitational force. At this point, the ball reaches a terminal velocity where it stops accelerating, and its velocity remains constant.
Step 4: Analyze the Terminal Velocity
After reaching terminal velocity, if the ball continues to move, it will maintain this constant velocity until it either reaches the bottom of the cylinder or comes to rest due to other factors (like hitting the bottom).
Step 5: Draw the Velocity-Time Graph
1. Start at the origin (0,0) where the ball is at rest.
2. Draw a curve that rises steeply at first (indicating acceleration) and then levels off as it approaches terminal velocity (indicating constant velocity).
3. If the ball eventually comes to rest (for example, if it hits the bottom), the graph will drop back to zero.
Conclusion
The correct representation of the velocity-time graph for the transit of the ball in glycerine will show an initial increase in velocity, followed by a plateau indicating constant velocity, and then a return to zero if it comes to rest.
When the steel ball is initially dropped into glycerine, it starts from rest. Therefore, at time t=0, the velocity v=0.
As the ball falls through the glycerine, it experiences two main forces:
- The gravitational force acting downward.
- The viscous drag force acting upward, which opposes the motion of the ball.
As the ball continues to fall, the velocity increases until the viscous drag force becomes equal to the gravitational force. At this point, the ball reaches a terminal velocity where it stops accelerating, and its velocity remains constant.
After reaching terminal velocity, if the ball continues to move, it will maintain this constant velocity until it either reaches the bottom of the cylinder or comes to rest due to other factors (like hitting the bottom).
1. Start at the origin (0,0) where the ball is at rest.
2. Draw a curve that rises steeply at first (indicating acceleration) and then levels off as it approaches terminal velocity (indicating constant velocity).
3. If the ball eventually comes to rest (for example, if it hits the bottom), the graph will drop back to zero.
The correct representation of the velocity-time graph for the transit of the ball in glycerine will show an initial increase in velocity, followed by a plateau indicating constant velocity, and then a return to zero if it comes to rest.
Topper's Solved these Questions
Similar Questions
A metallic ball at 40∘C is dropped in a vessel containing water at 20∘C. Which of the following statements corresponding to the above statement is correct?
View SolutionA ball is thrown downward with some velocity into a.viscous liquid. Which of the following curves represents correct variation for velocity versus time?
View Solution
Knowledge Check
Which one of the following is not the correct representation?
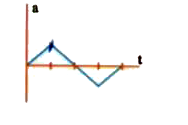
AE∘cell = Red. Pot. Of cathode + Oxide pot. of anodeBE∘cell = Red. Pot of cathode - Oxid. pot. of anodeCE∘cell = Red. Pot. Of cathode + Red. pot. of anodeDE∘cell = Red. Pot of cathode - Red. pot of anodeWhich of the following v Vs t graph are correct representation for the acceleration Vs time graph shown below
 A
A B
B C
C D
D
A rigid ball rolls without slipping on a surface shown below.

Which one of the following is the most likely representation of the distance traveled by the ball vs time graph?A B
B C
C D
D
A ball falls towards the earth. Which of the following is correct ?
View SolutionA spherical ball is dropped in a long column of viscous liquid. Which of the following graphs represent the variation of
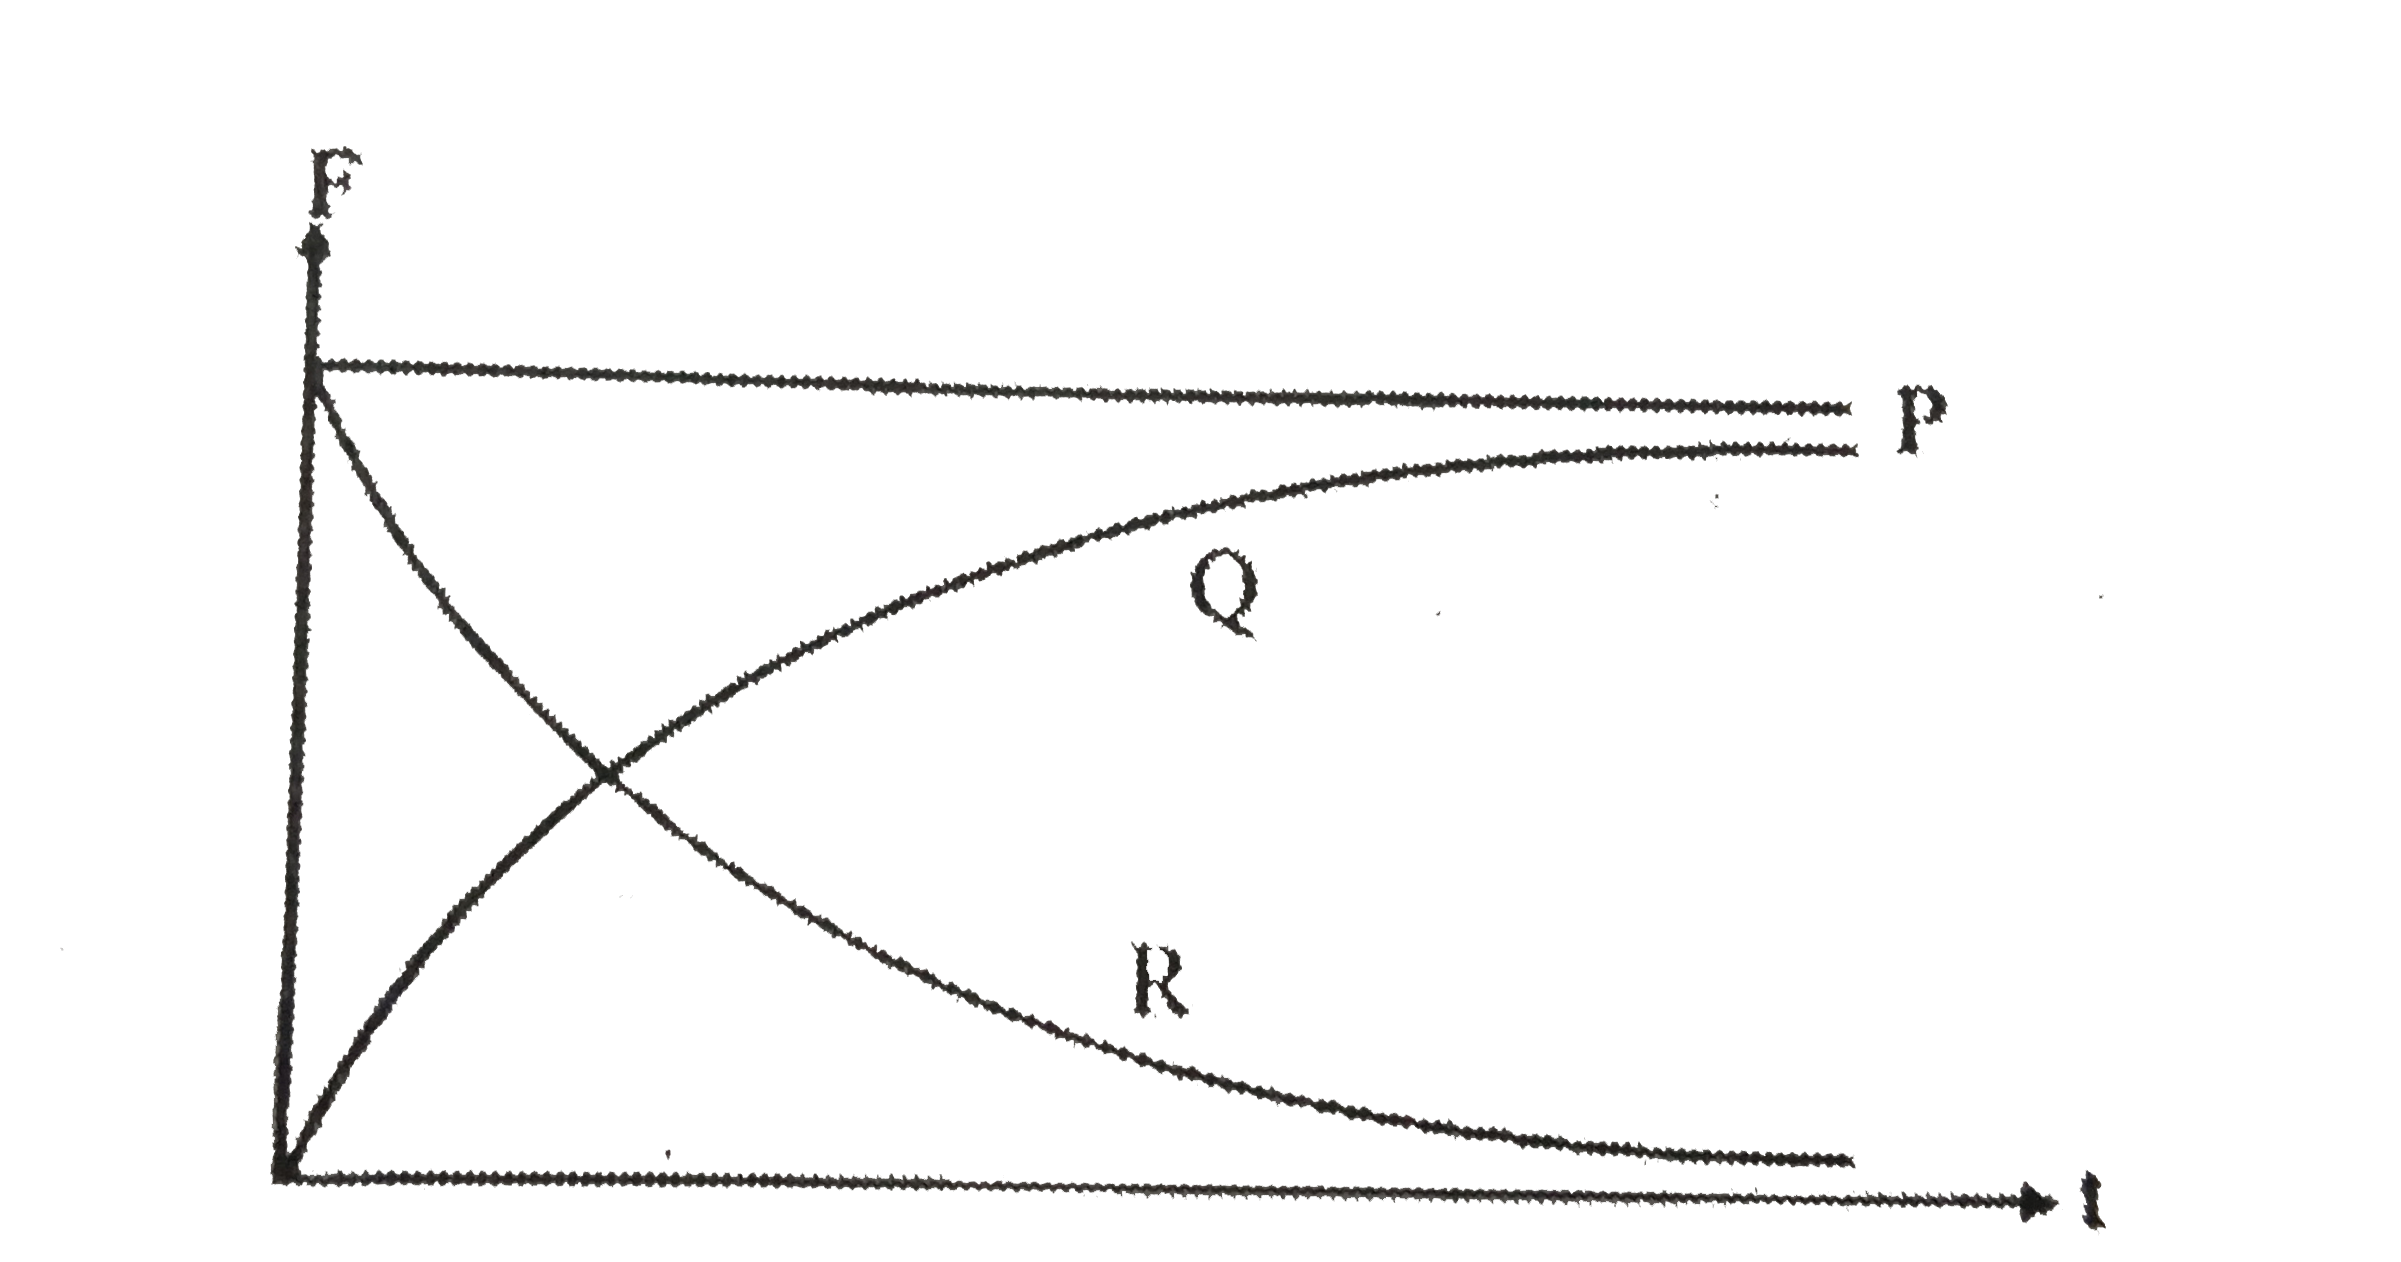
(l) gravitational force with time
(ii) viscous force with time
(iii) net force acting on the ball with time
View Solution_E01_122_Q01.png)
A spherical ball is dropped in a long column of viscous liquid. Which of the following graphs represents the variation of-
(i). Gravitaional force with time
(ii). Viscous force with time
(iii). Net force acting on the ball with time
View SolutionA ball falls towards the earth. Which of the following is correct ? .
View SolutionA spherical ball is dropped in a long column of viscous liquid. Which of the following graphs represent the variation of

(l) gravitational force with time
(ii) viscous force with time
(iii) net force acting on the ball with time
View Solution
