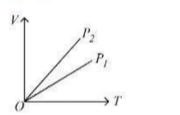
The given figure represents two isobaric processes for the same mass of an ideal gas,then

P2≥P1
P2>P1
P1>P2
P1=P2
Step by step video solution for The given figure represents two isobaric processes for the same mass of an ideal gas,then by Physics experts to help you in doubts & scoring excellent marks in Class 12 exams.
Updated on:21/07/2023Topper's Solved these Questions
Similar Questions
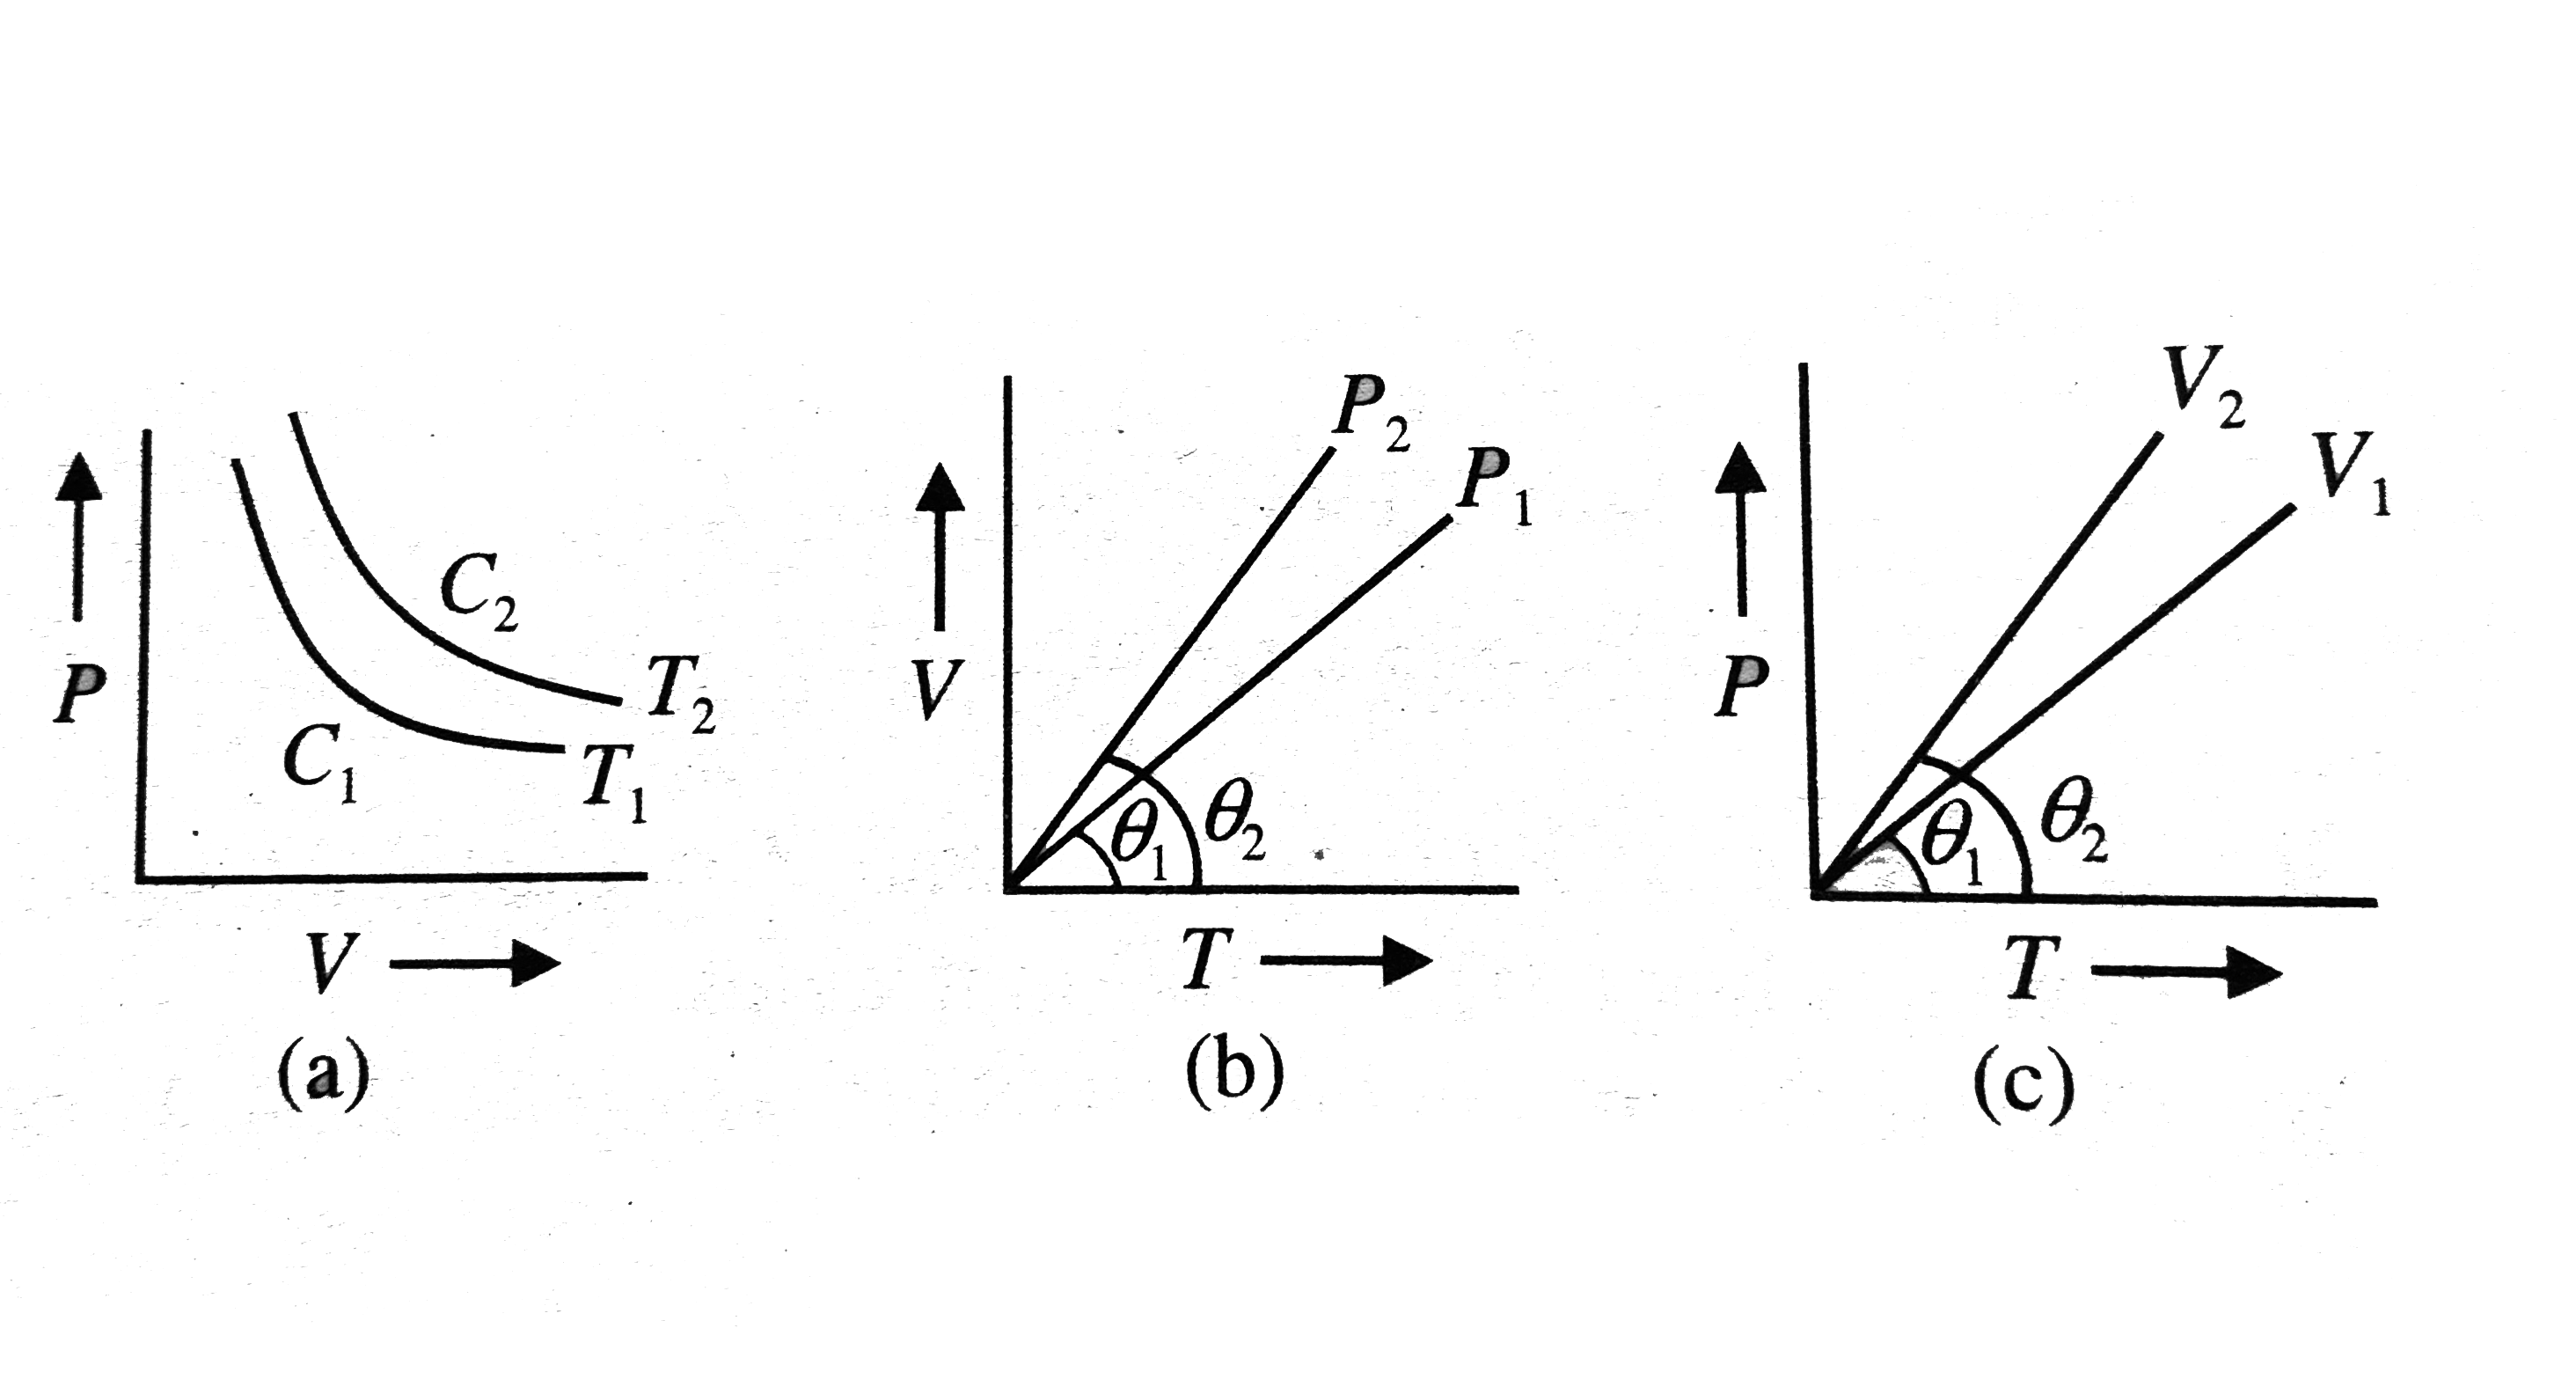
Explain whether (a) T2>T1, (b) P2>P1 and (c ) V2>V1 or otherwise in Fig., which represent in isothermal, isobaric, and isochoric processes for the same mass of an ideal gas, respedtively.

View SolutionThe figures given below depict different processes for a given amount of an ideal gas.

View Solution
Knowledge Check
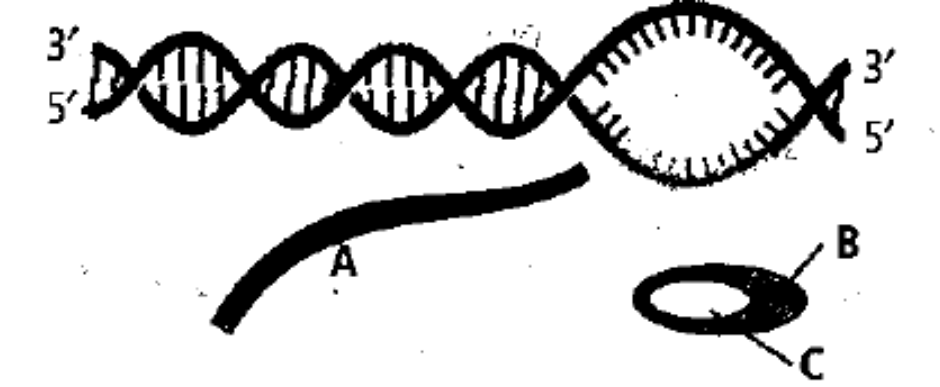
The given figure represents the process of transcription in bacteria.
 AA-DNA,B-RNA, C-Rho factorBA-RNA, B-RNA polymerase, C- Rho factorCA-RNA, B-RNA polymerase, C- sigma factorDA-DNA, B-DNA polymerase, C-Sigma factor
At constant temperature, in a given mass of an ideal gas -
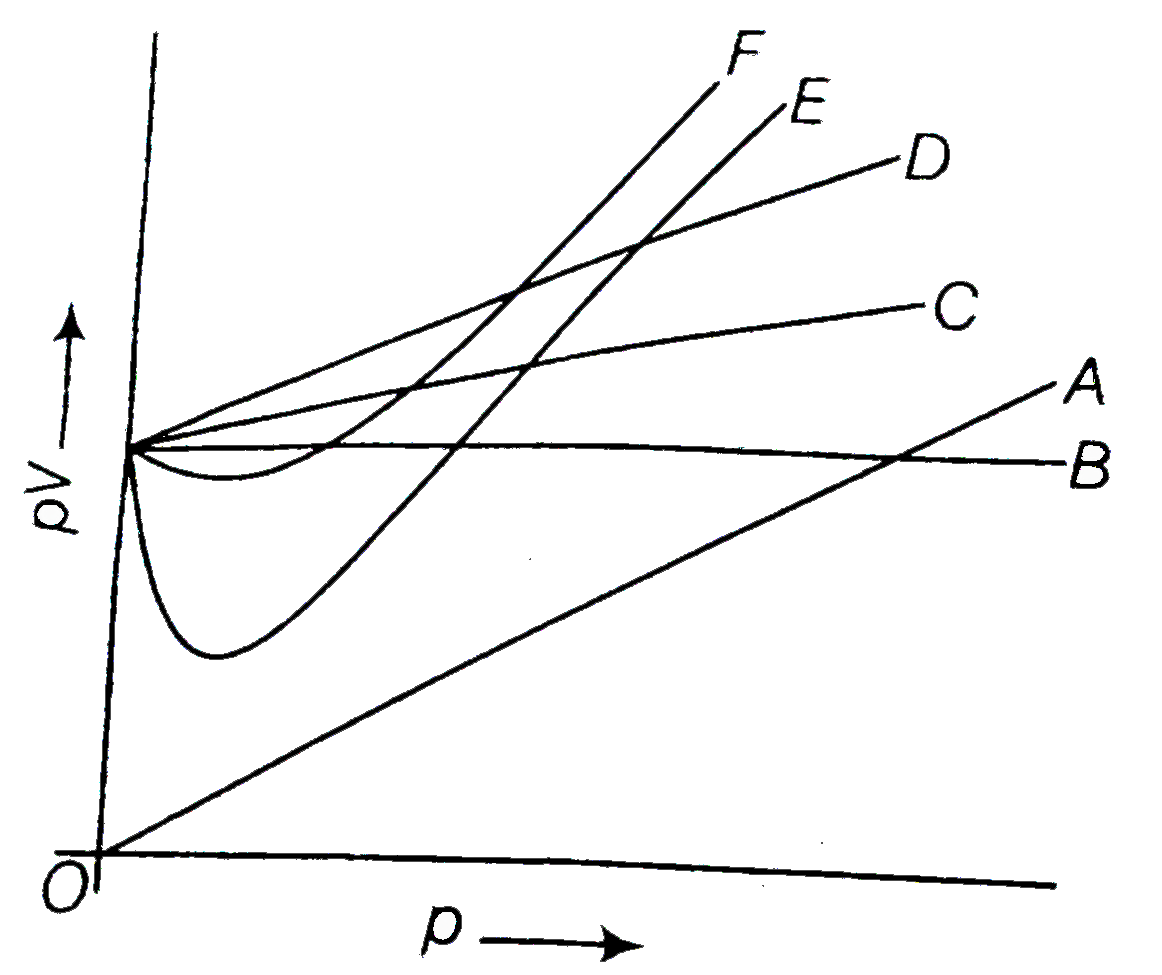
AThe ratio of pressure and volume always remains constantBVolume always remains constantCpressure always remains constantDThe product of pressure and volume always rmains constantWhich curve in figure represents the curve of ideal gas?
 AB onlyBC and D onlyCE and F onlyDA and B only
Which curve in figure represents the curve of ideal gas ?

View SolutionThe correct figure representing isothermal and adiabatic compression of an ideal gas from the same initial state is:
View SolutionAt constant temperature, in a given mass of an ideal gas -
View SolutionAt constant temperature, in a given mass of an ideal gas -
View SolutionWhen heat in given to a gas in an isobaric process, then
View Solution
