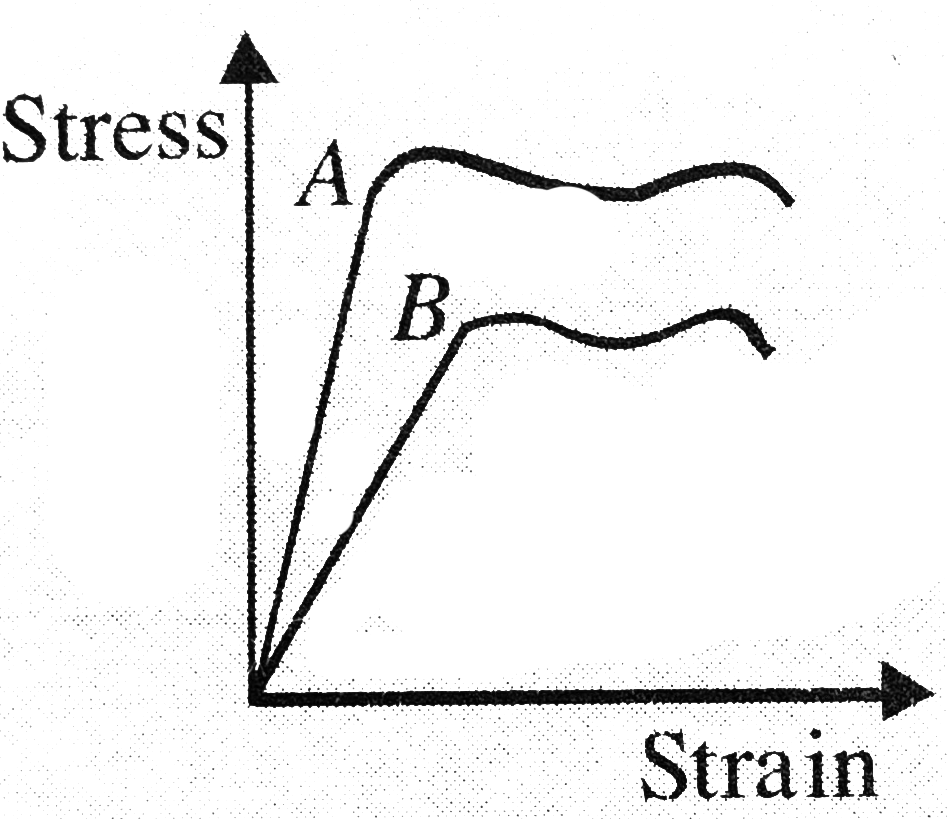
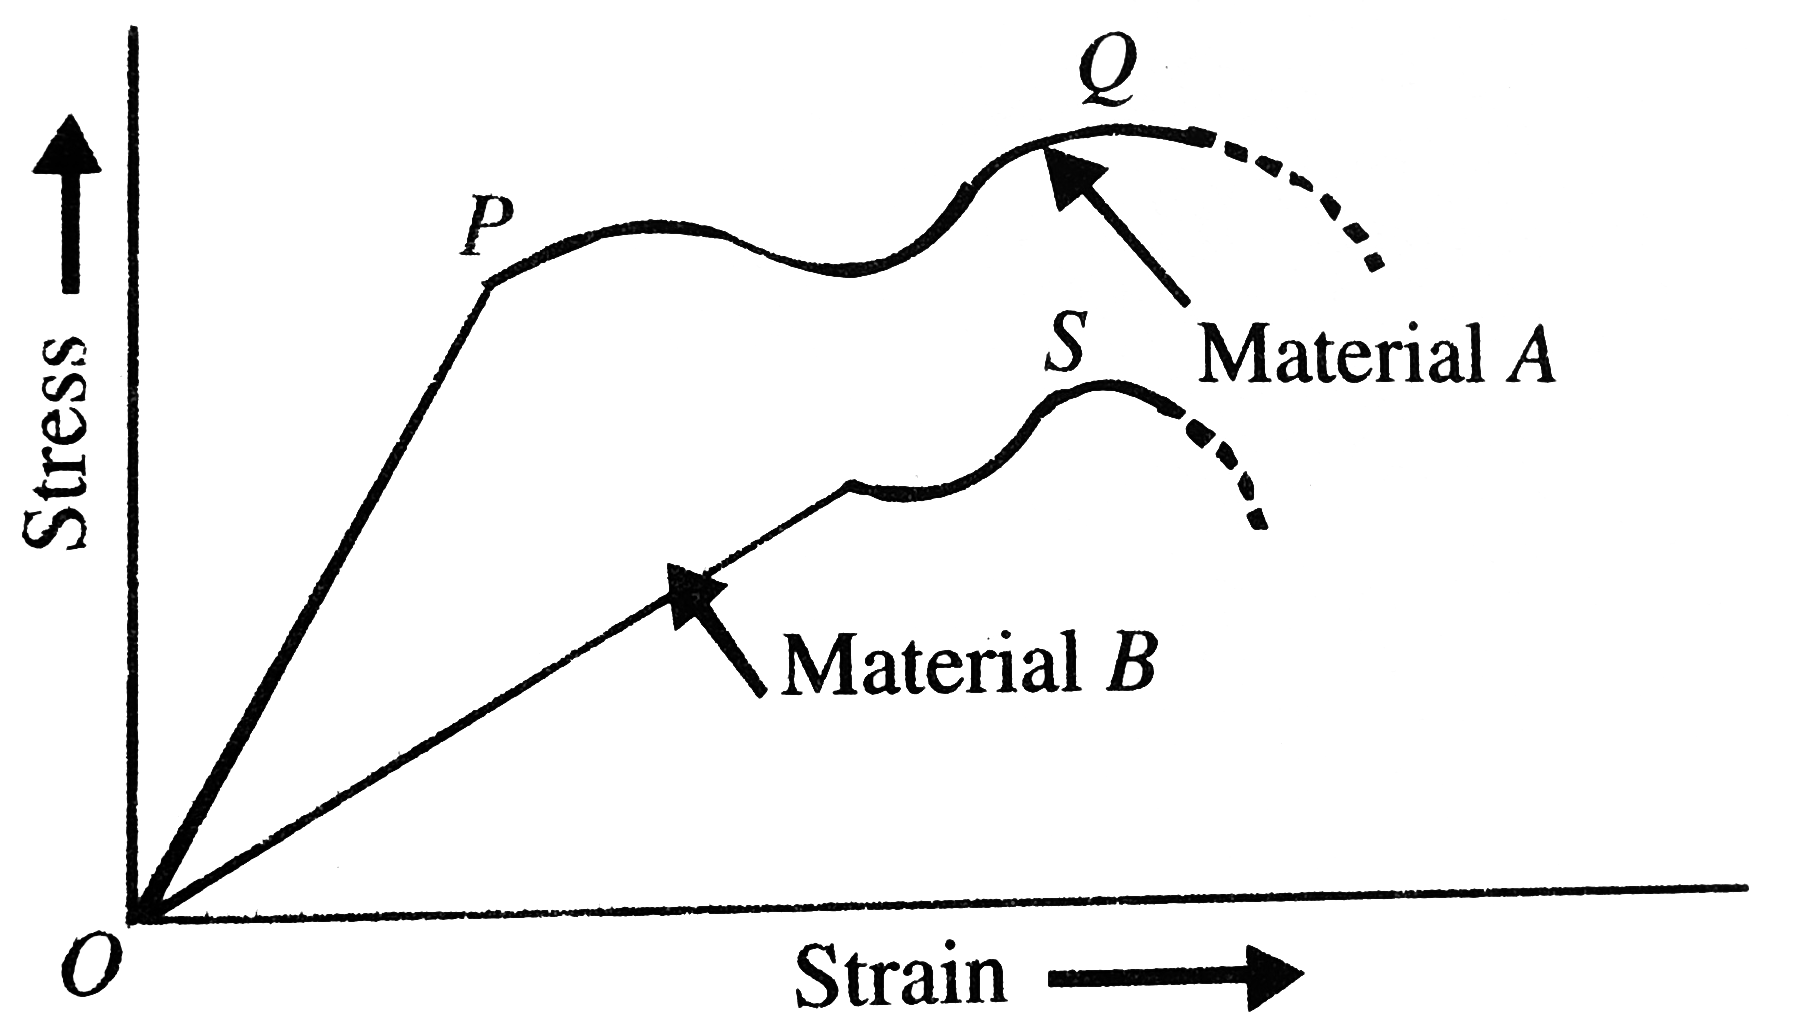
The stress- strain graphs for materials A and B are as shown. Choose the correct alternative
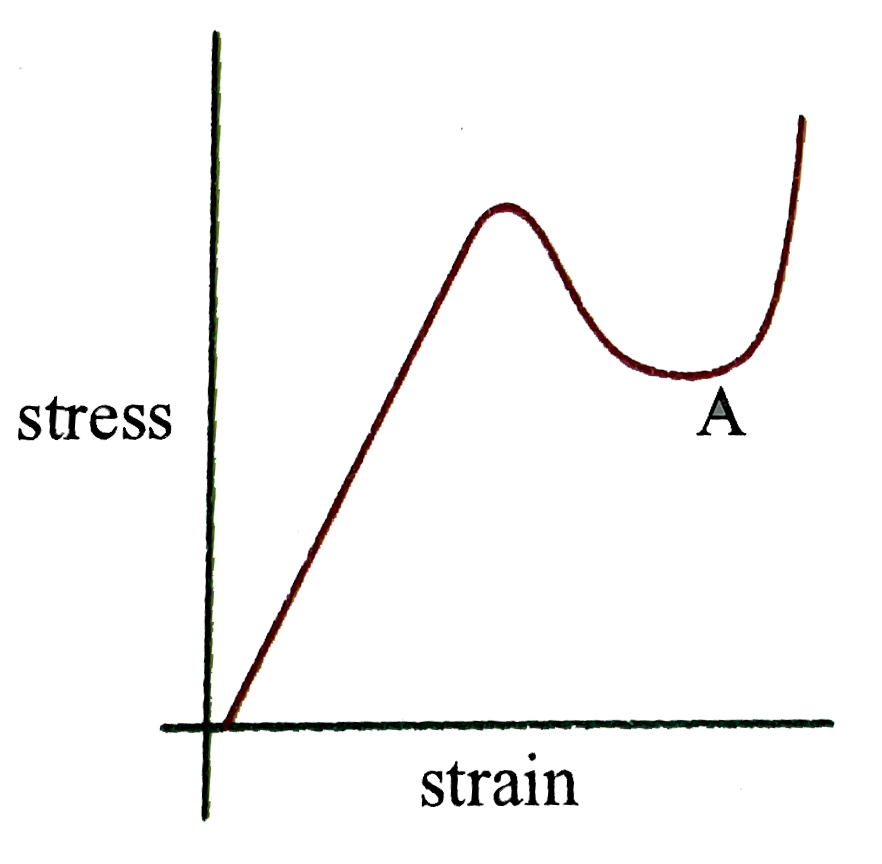
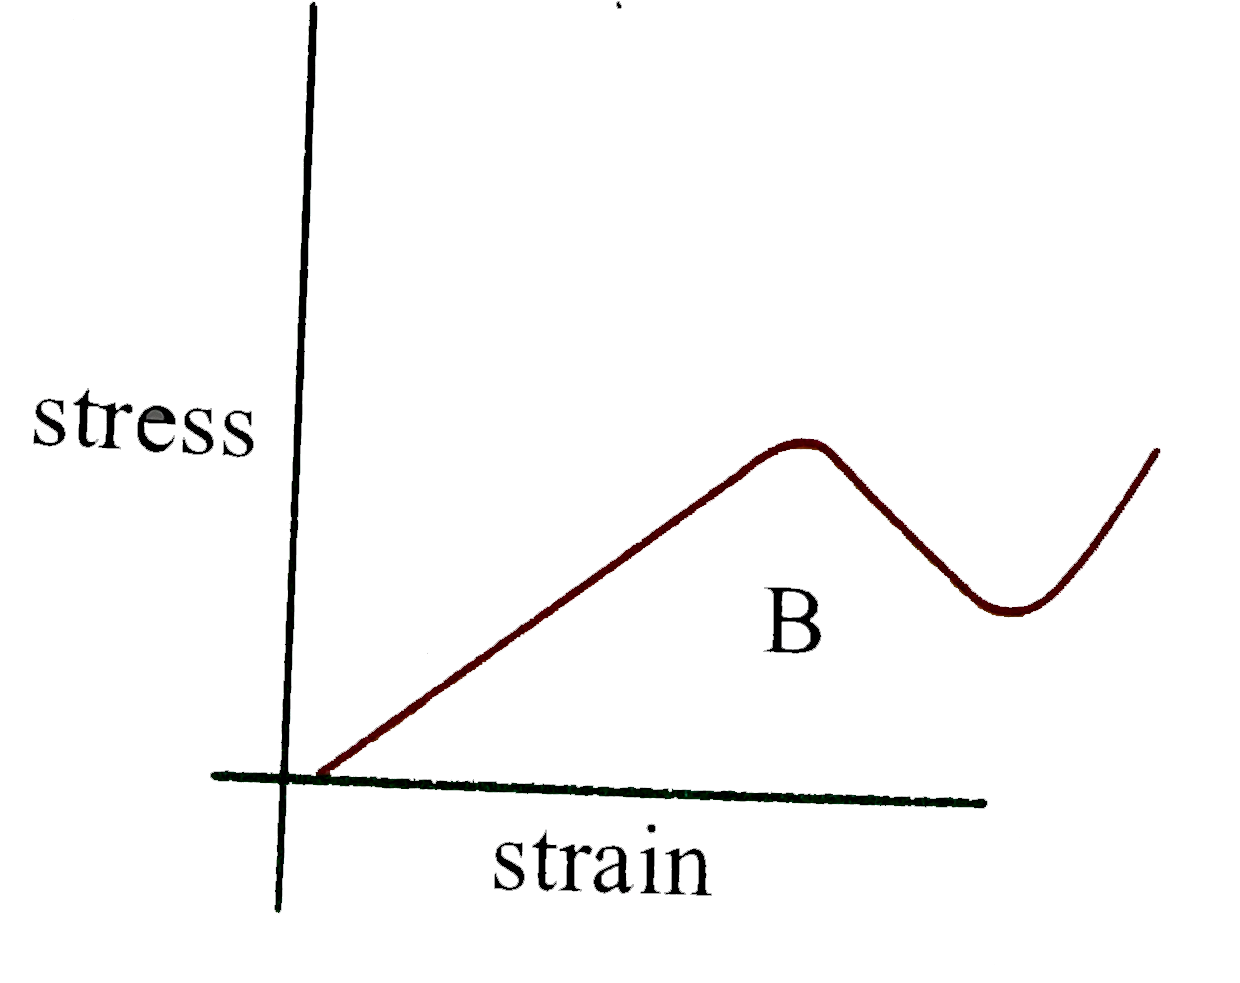
Material A is stronger than material B
Material B is stronger than material A
The Young's modulus of A is greater than or equal to that of B
The Young's modulus of B is greater than that of A
The correct Answer is:B
Step by step video & image solution for The stress- strain graphs for materials A and B are as shown. Choose the correct alternative by Physics experts to help you in doubts & scoring excellent marks in Class 12 exams.
Updated on:21/07/2023Topper's Solved these Questions
- MECHANICAL PROPERTIES OF SOLIDSBOOK - AAKASH INSTITUTECHAPTER - MECHANICAL PROPERTIES OF SOLIDSEXERCISE - Assignment (SECTION - B)
15 Videos
- MECHANICAL PROPERTIES OF SOLIDSBOOK - AAKASH INSTITUTECHAPTER - MECHANICAL PROPERTIES OF SOLIDSEXERCISE - Assignment (SECTION - C)
2 Videos
- MECHANICAL PROPERTIES OF SOLIDSBOOK - AAKASH INSTITUTECHAPTER - MECHANICAL PROPERTIES OF SOLIDSEXERCISE - Try Yourself
32 Videos
- MECHANICAL PROPERTIES OF FLUIDSBOOK - AAKASH INSTITUTECHAPTER - MECHANICAL PROPERTIES OF FLUIDSEXERCISE - SECTION - J
9 Videos
- Mock test 03BOOK - AAKASH INSTITUTECHAPTER - Mock test 03EXERCISE - EXAMPLE
37 Videos
Similar Questions
The stress-strain graphs for two materials A and B are shown in the figure. The graphs are drawn to the same scale.
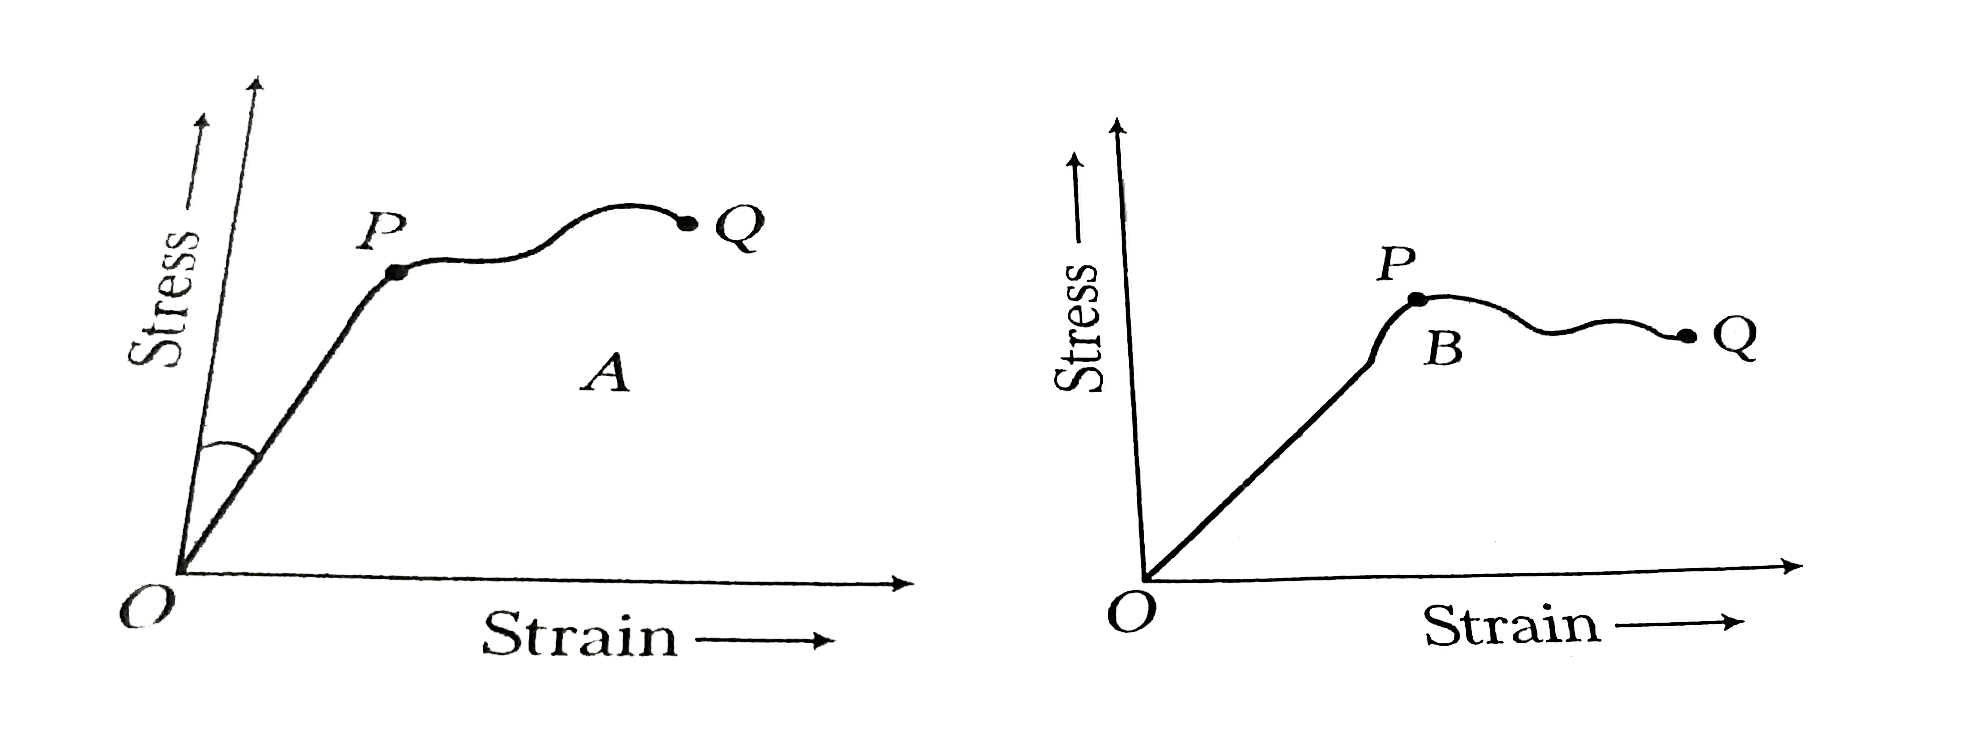
(a) Which material has a greater Young's modulus ?
(b) Which material is more ductile ?
(c) Which material is more brittle?
(d) Which of the two is the stronger material ?
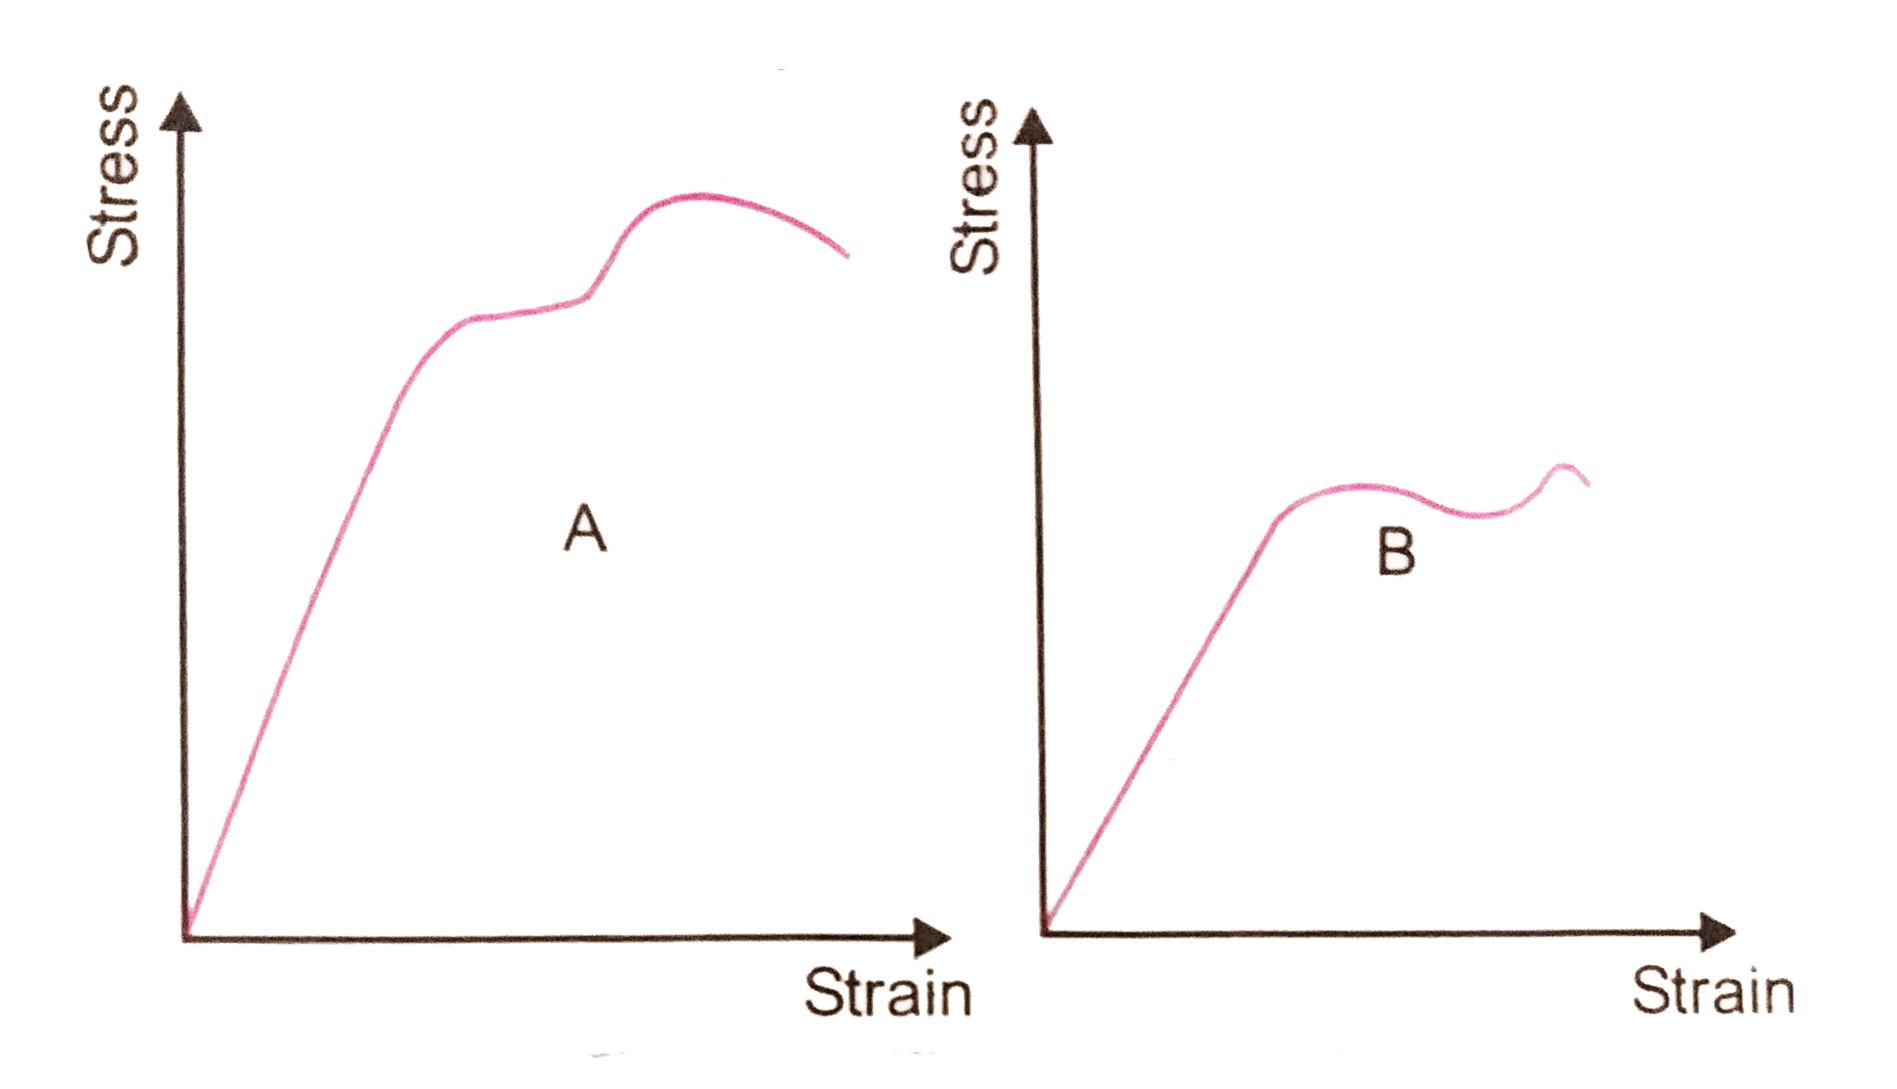
View SolutionThe stress versus strain graph for two materials A and B are shown in fig. the graph are on the same scale. ltbr> (a) Which materail has greater Young's modulus?
(b) which of the two is stronger materail?
View Solution
Knowledge Check
The stress and strain graphs for two materials, A and B are shown here. Answer the following:
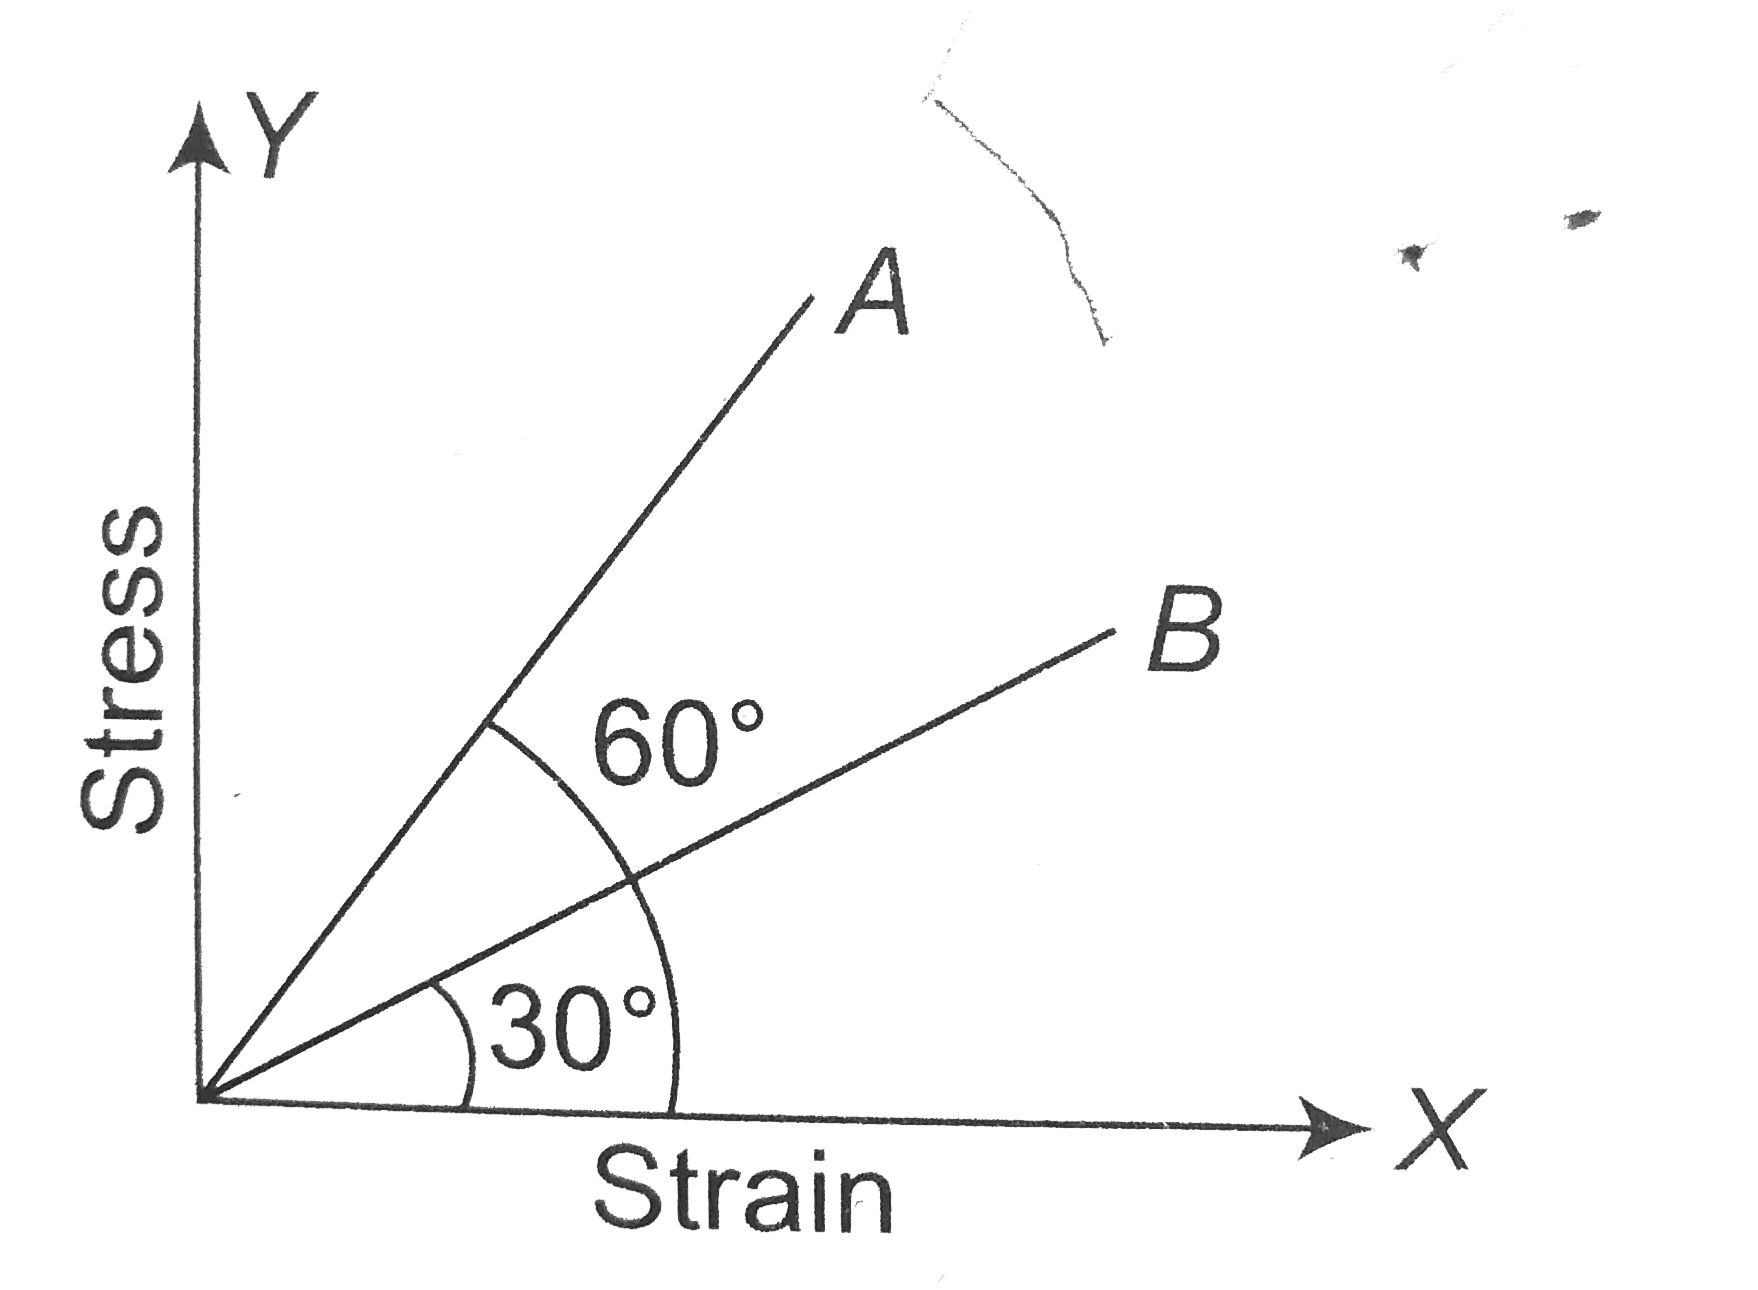
 give reasonsAWhich material has greater Young's modulus?BWhich material is more ductile?CWhich material is more brittle?DWhich material has greater tensile strength?
The stress versus strain graphs for wires of two materials A and B are as shown in the figure. If YA and YB are the Young's moduli of the materials thenAYB=2YABYA=YBCYB=3YADYA=3YBThe stress versus strain graphs for wires of two materials A and B are as shown in the figure. If YAandYB are the younng's moduli of the materials, then
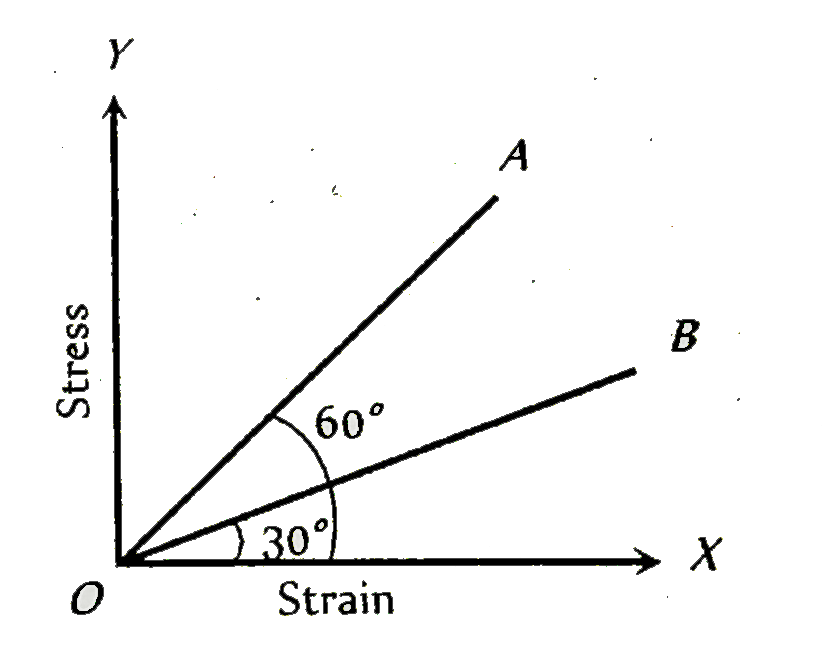 AYB=2YABYA=YBCYB=3YADYA=3YB
The stress-strain graphs for two materials A and are shown in figure. The graphs are drawn to the same scale. Select the correct statement
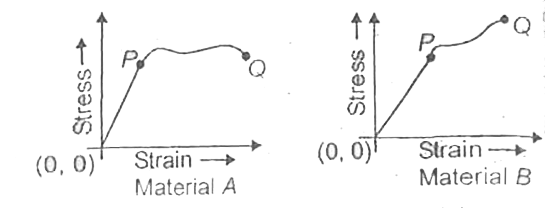
View SolutionFigure shows the stress-strain graphs for materials .A and B. From the graph it follows that
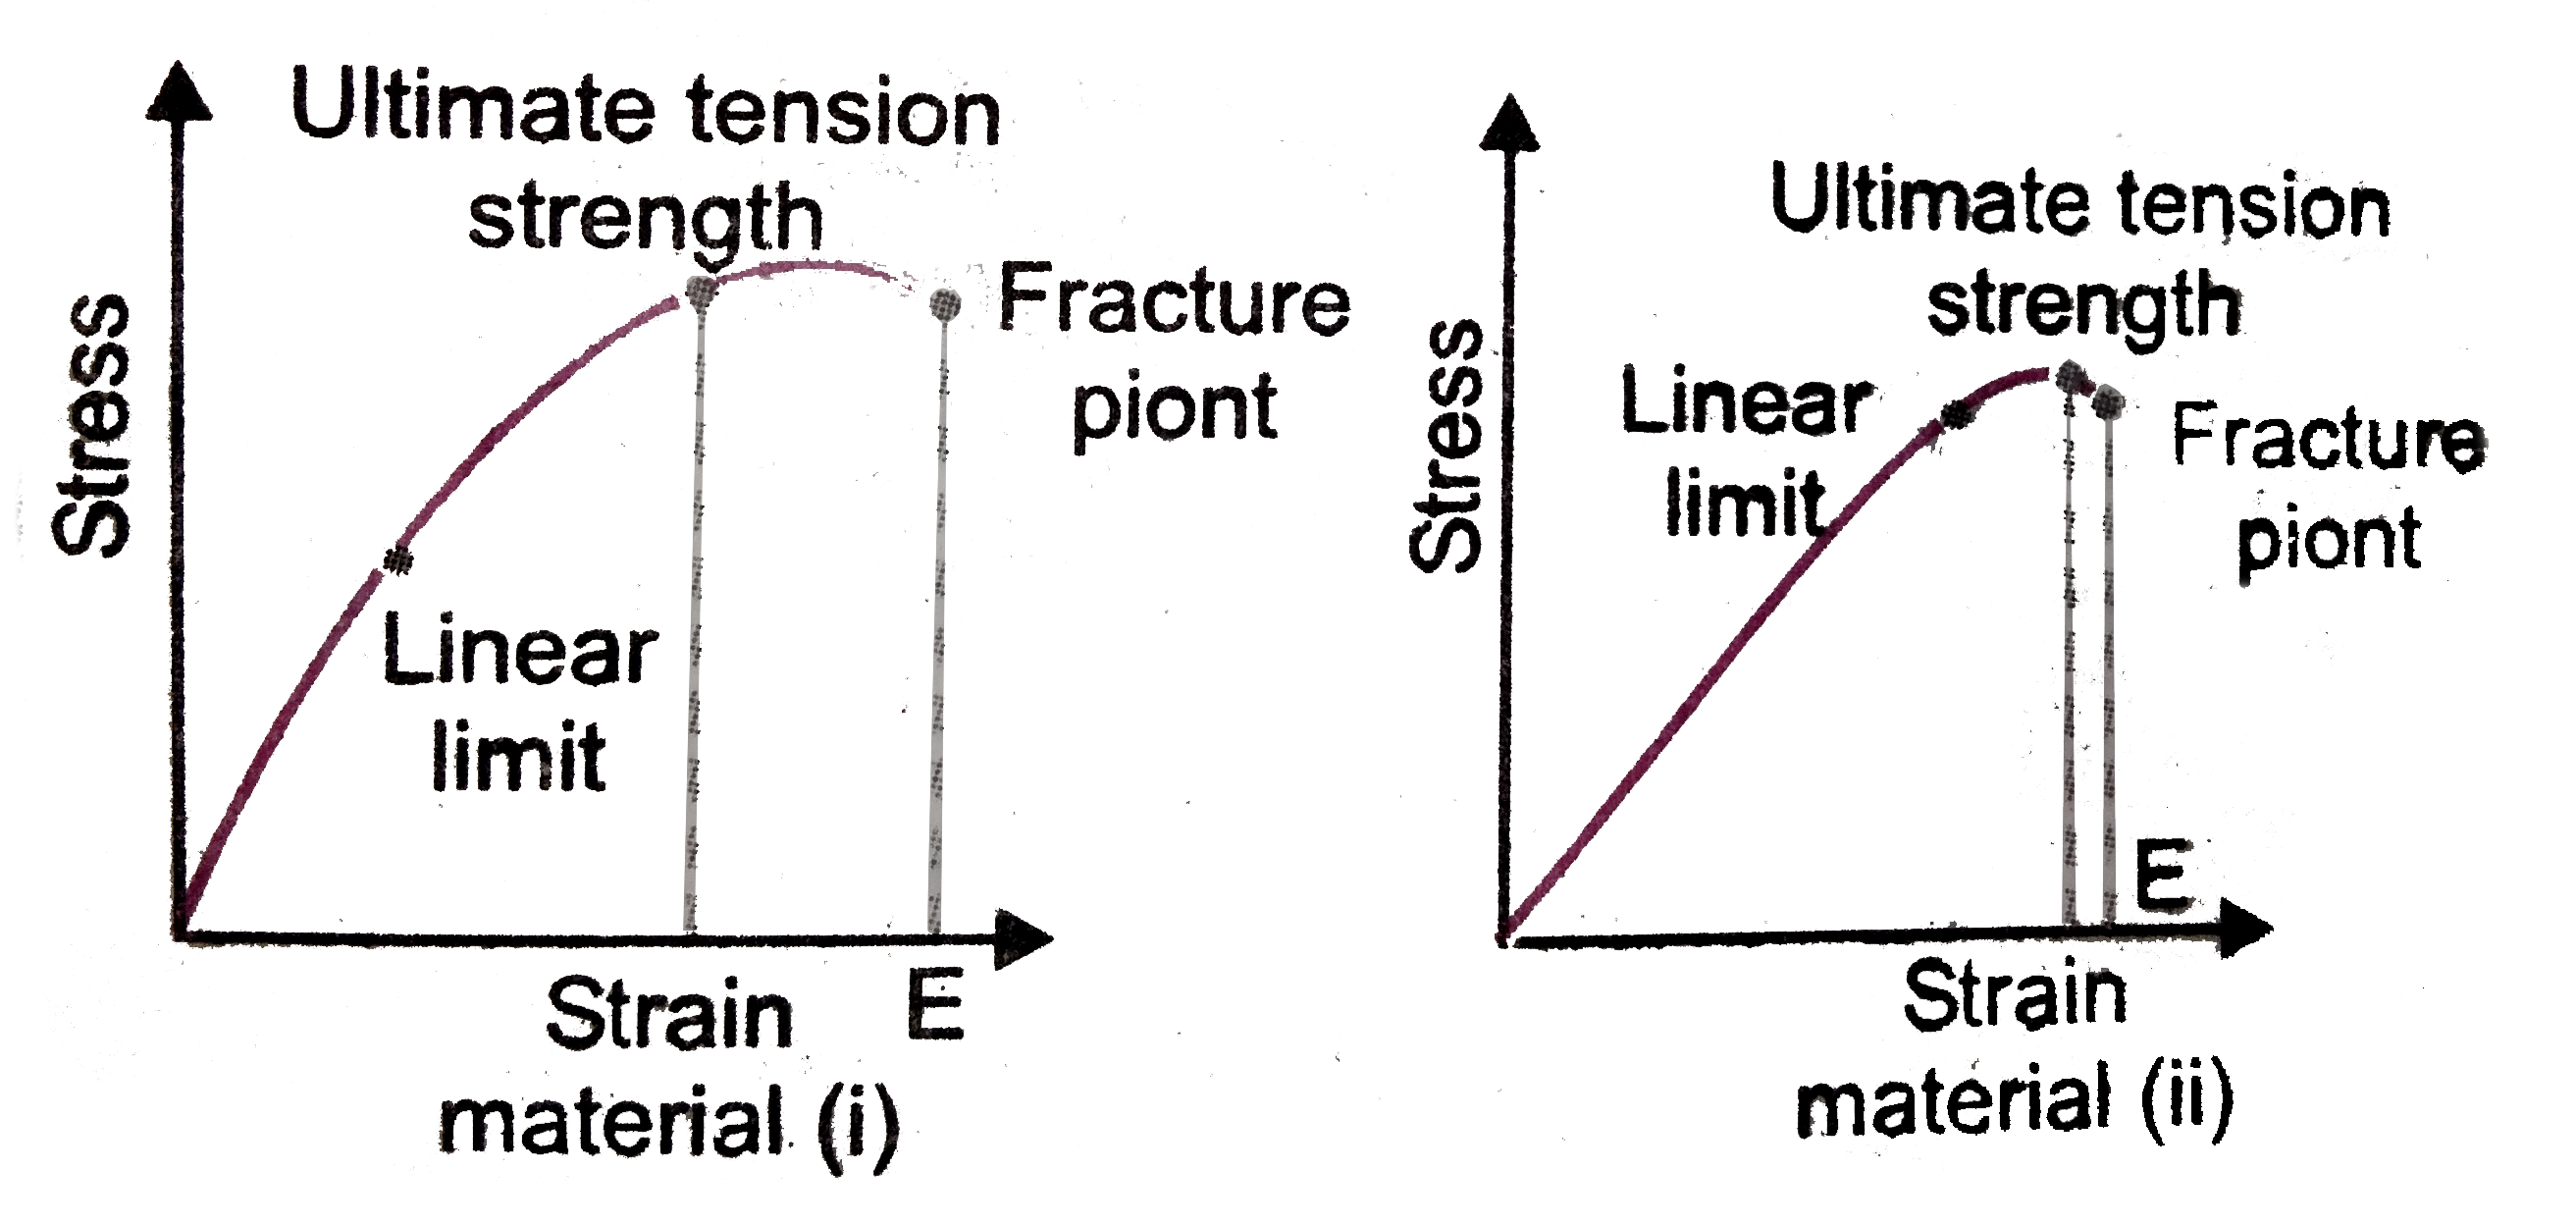
View SolutionThe stress-strain graphs for two materials are shown in Fig. 7(EP).3 (assume scale).
View Solution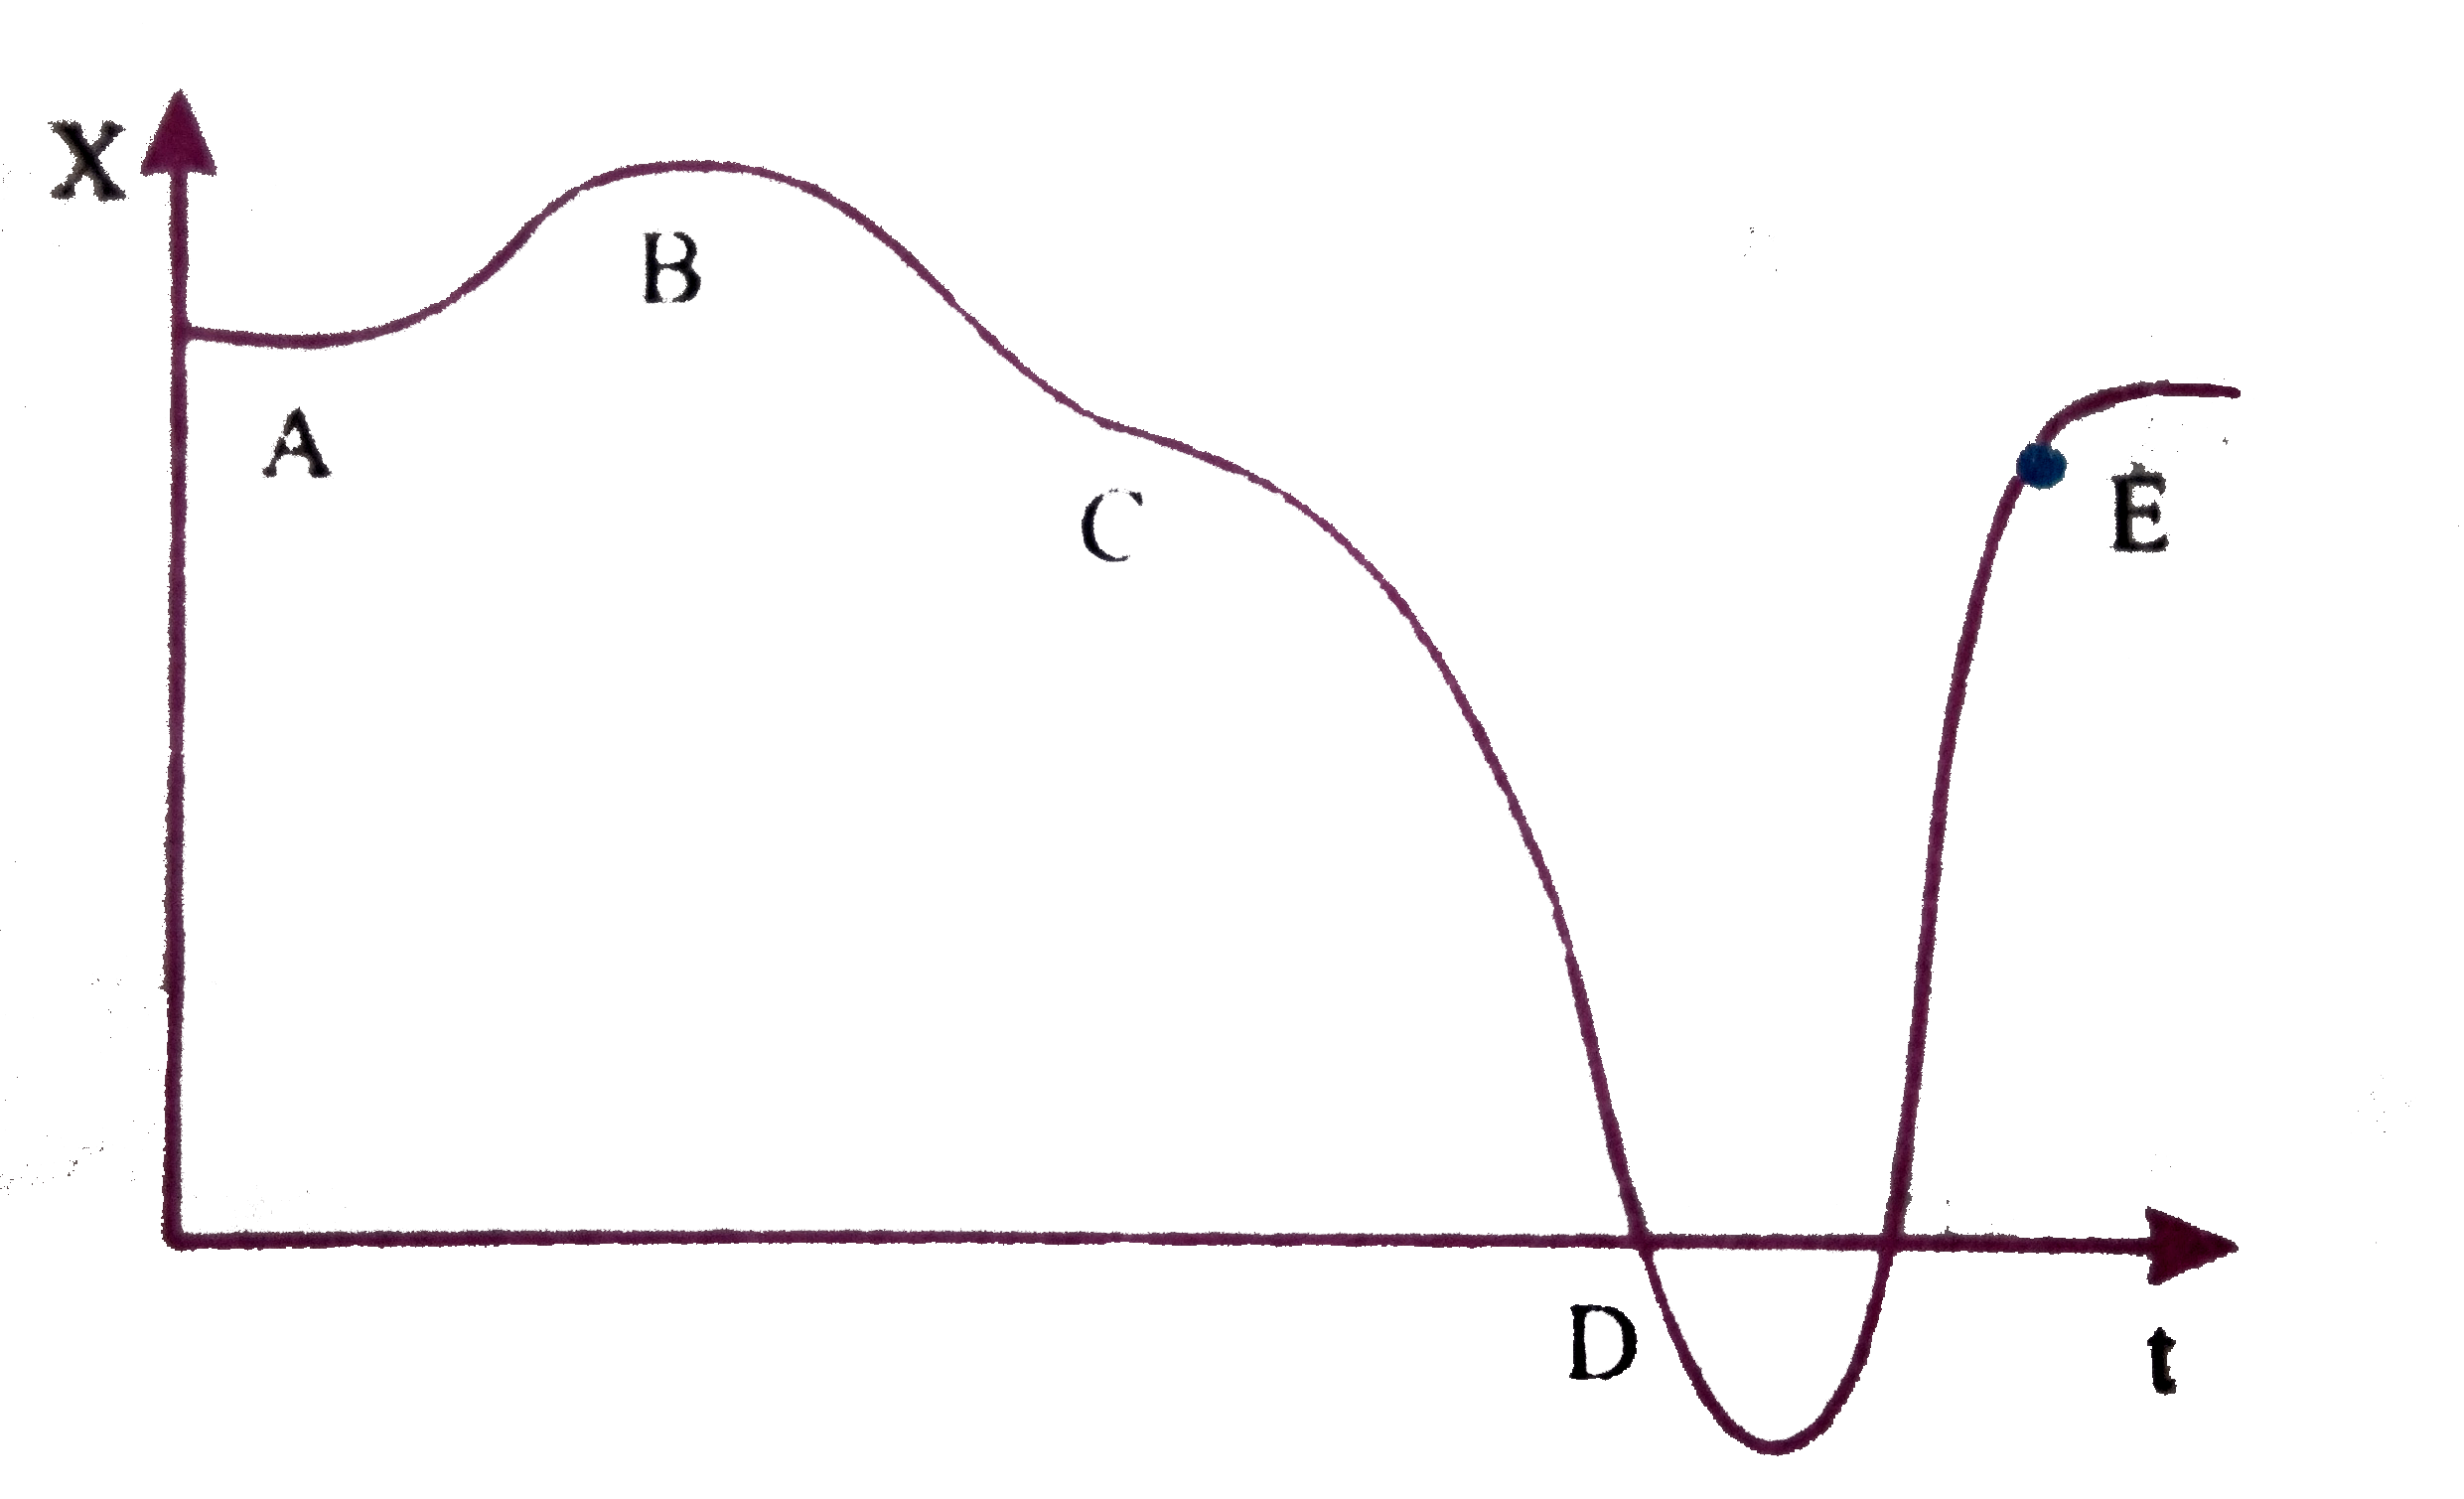
A graph of x versus t is shown in figure. Choose correct alternative from below.
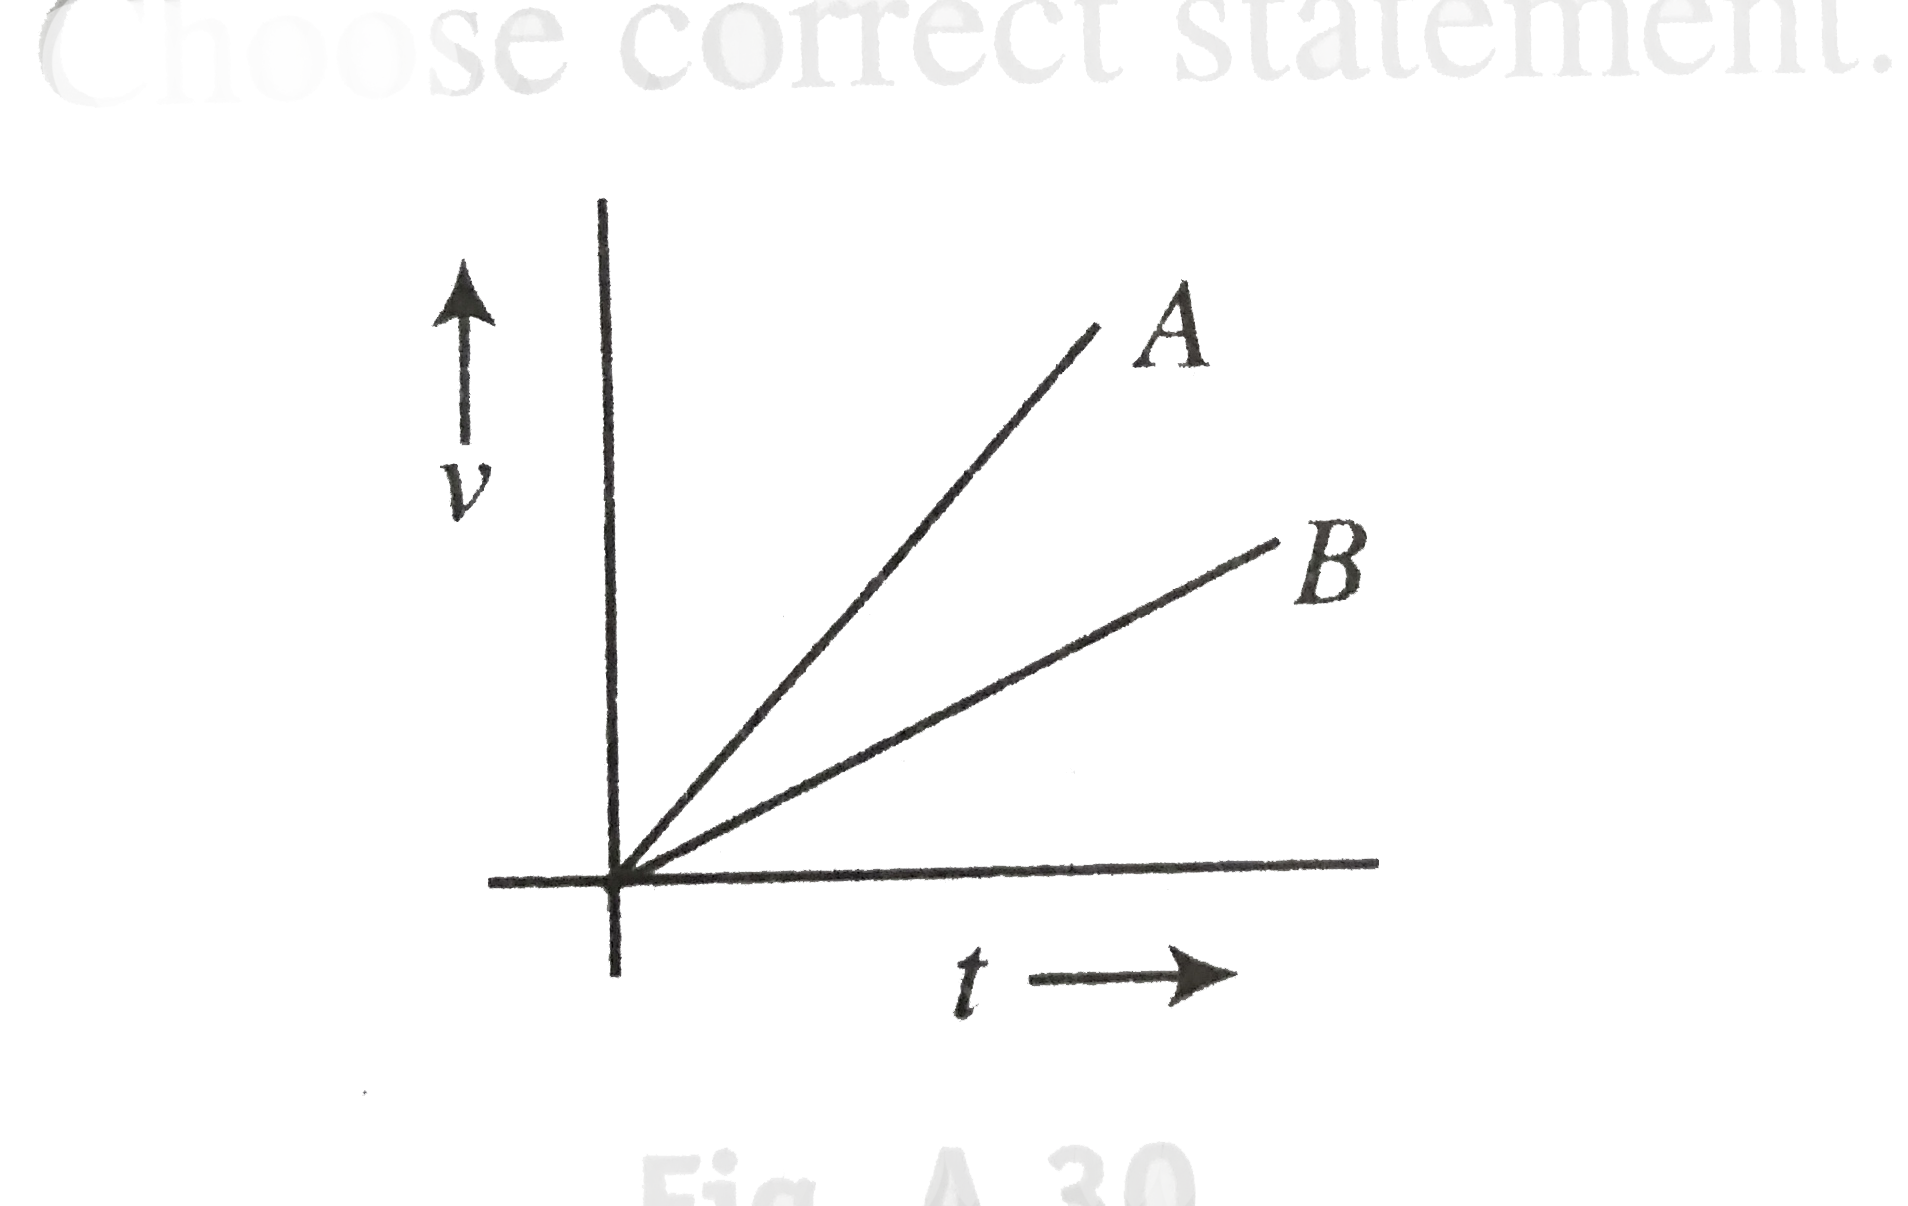
View SolutionThe velocity - time graph of two bodies A and B is shown in figure. Choose correct statement.
View Solution
