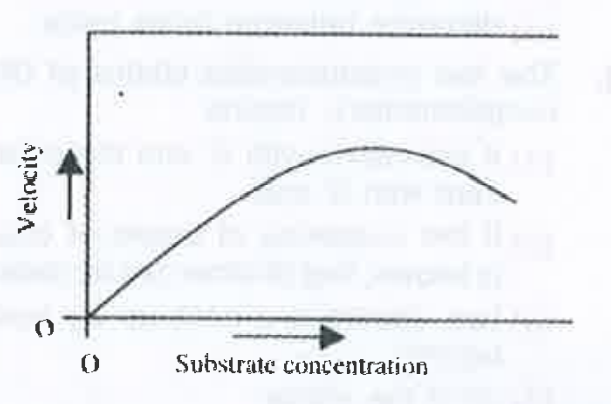
The shape of the curve obtained when substrate concentration is plotted against velocity of reaction
Rectangular hyperbola
Bell shaped curve
Sigmoid curve
None of the above
The correct Answer is:A
To determine the shape of the curve obtained when substrate concentration is plotted against the velocity of a reaction, we can follow these steps:
1. Understand the Variables:
- The x-axis will represent the substrate concentration.
- The y-axis will represent the velocity (rate) of the reaction.
2. Initial Reaction Phase:
- At low substrate concentrations, as the concentration increases, the velocity of the reaction also increases. This is because there are many active sites available on the enzyme for the substrate to bind.
3. Increasing Substrate Concentration:
- As we continue to increase the substrate concentration, the velocity keeps increasing but at a decreasing rate. This is due to the fact that more active sites on the enzyme are being occupied, and there are fewer available sites for additional substrate.
4. Saturation Point:
- Eventually, a point is reached where all active sites of the enzyme are occupied. At this saturation point, the velocity of the reaction reaches its maximum (Vmax). Further increases in substrate concentration do not increase the velocity; instead, the velocity becomes constant.
5. Shape of the Curve:
- The resulting graph will exhibit a characteristic shape that resembles a bell curve. Initially, it rises steeply, then starts to plateau as it approaches Vmax, forming the upper part of the bell shape.
6. Conclusion:
- Therefore, the shape of the curve obtained when substrate concentration is plotted against the velocity of the reaction is a bell-shaped curve.
Final Answer:
The shape of the curve is a bell-shaped curve.
---
- The x-axis will represent the substrate concentration.
- The y-axis will represent the velocity (rate) of the reaction.
- At low substrate concentrations, as the concentration increases, the velocity of the reaction also increases. This is because there are many active sites available on the enzyme for the substrate to bind.
- As we continue to increase the substrate concentration, the velocity keeps increasing but at a decreasing rate. This is due to the fact that more active sites on the enzyme are being occupied, and there are fewer available sites for additional substrate.
- Eventually, a point is reached where all active sites of the enzyme are occupied. At this saturation point, the velocity of the reaction reaches its maximum (Vmax). Further increases in substrate concentration do not increase the velocity; instead, the velocity becomes constant.
- The resulting graph will exhibit a characteristic shape that resembles a bell curve. Initially, it rises steeply, then starts to plateau as it approaches Vmax, forming the upper part of the bell shape.
- Therefore, the shape of the curve obtained when substrate concentration is plotted against the velocity of the reaction is a bell-shaped curve.
The shape of the curve is a bell-shaped curve.
Topper's Solved these Questions
- BOOK - AAKASH SERIESCHAPTER - BIOMOLECULESEXERCISE - EXERCISE - I (Enzymes -Introduction)13videos
BIOMOLECULES
- BOOK - AAKASH SERIESCHAPTER - BIOMOLECULESEXERCISE - EXERCISE - I (Chemical reactions)4videos
BIOMOLECULES
- BOOK - AAKASH SERIESCHAPTER - BIOLOGICAL CLASSIFICATIONEXERCISE - EXERCISE-III (Previous AIPMT/NEET Question)37videos
BIOLOGICAL CLASSIFICATION
- BOOK - AAKASH SERIESCHAPTER - CELL CYCLE AND CELL DIVISIONEXERCISE - Exercise-III18videos
CELL CYCLE AND CELL DIVISION
Similar Questions
The Shape of growth curve obtained when the length of an organ is plotted against the time is
View SolutionThe curve obtained when percentage saturation of Hb with O2 is plotted against pO2 is
View SolutionR.Q. of 4 is obtained when respiratory substrate is
View SolutionWhat does the graph indicate ?
The graph given below shows the effect of substrate concentration on the rate of reaction of the enzyme green- gram-phos-phatase.
 View Solution
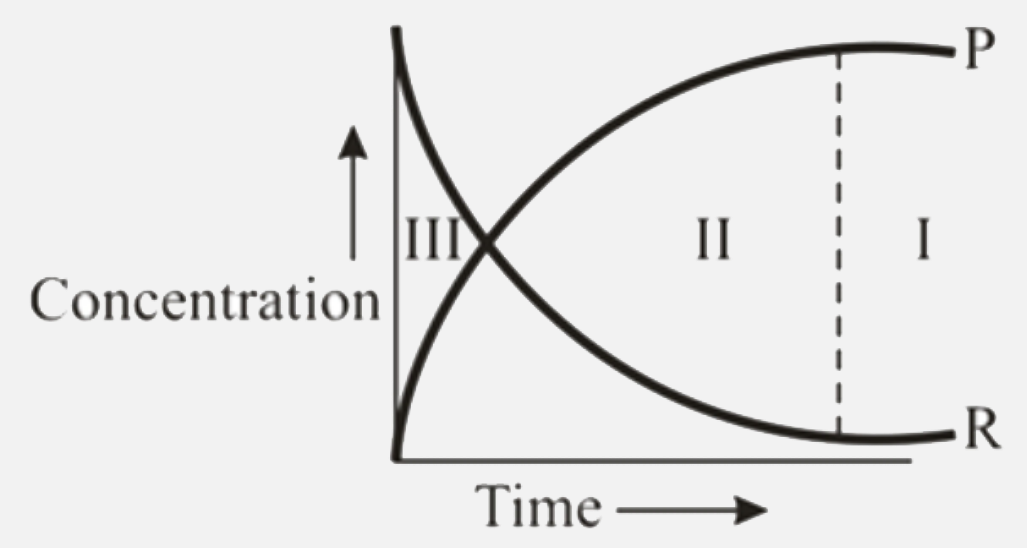
For the reaction R⇔P Variation of concentration is plotted against time

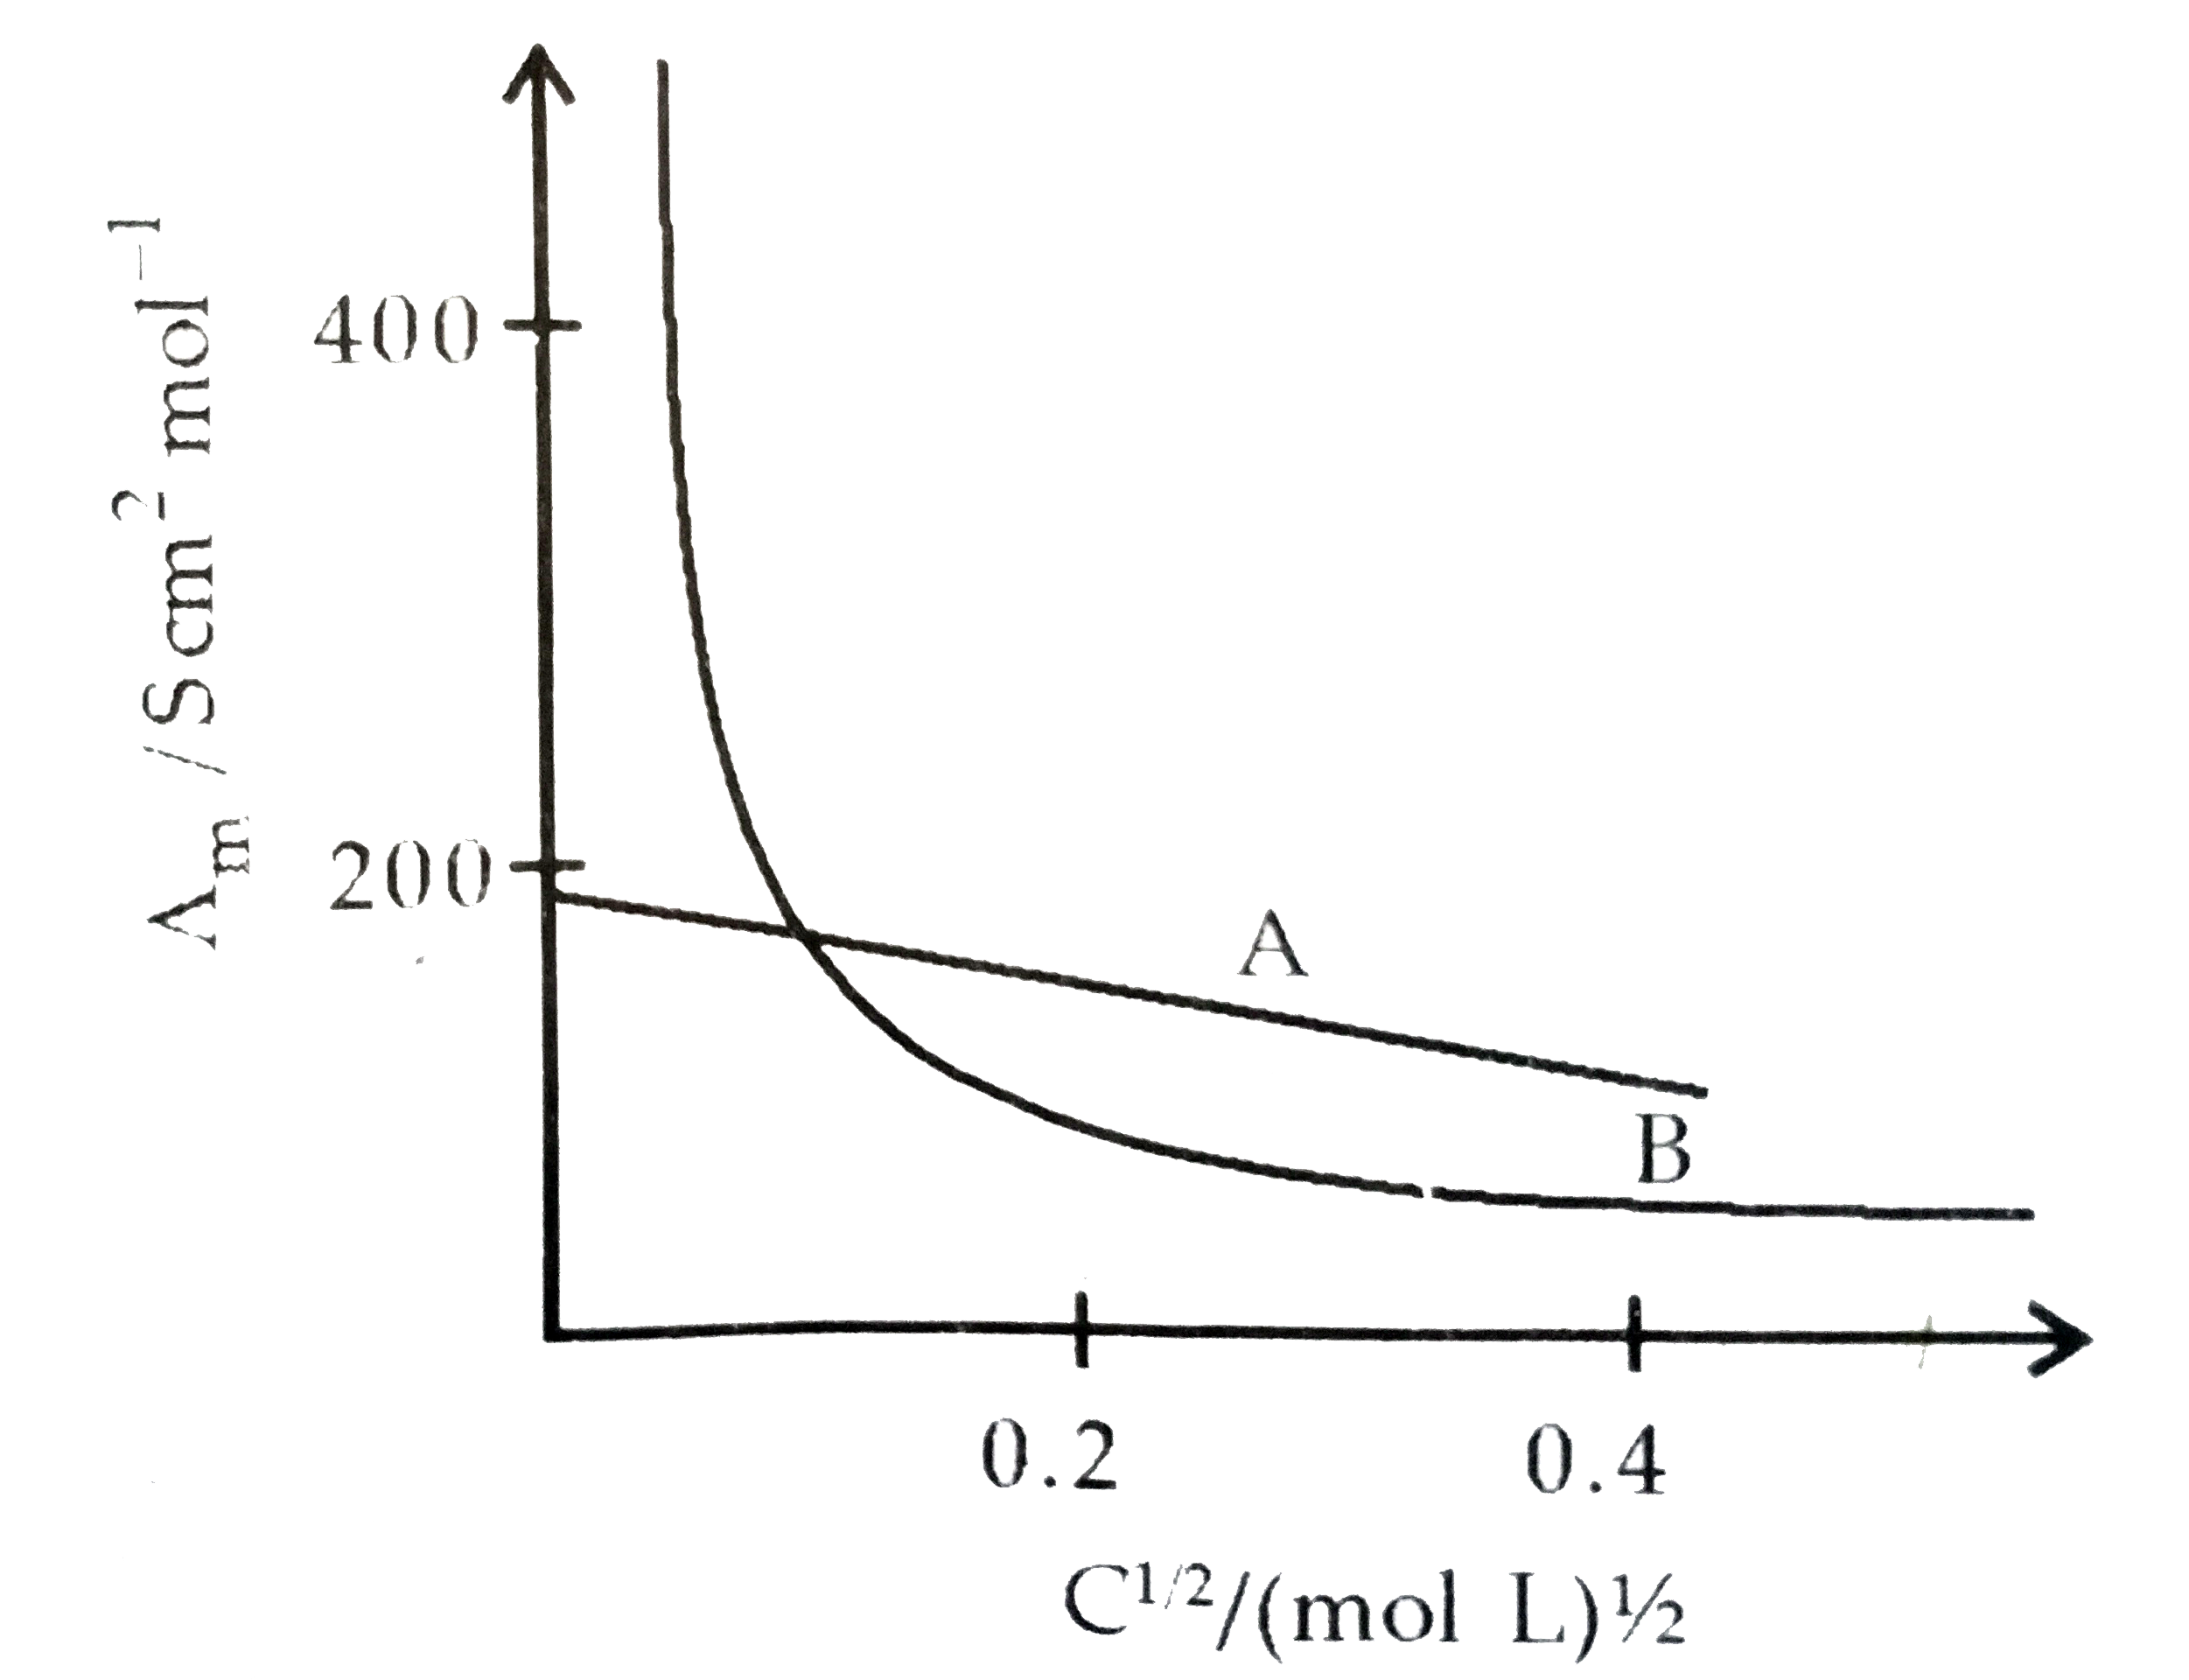
Which of the following regions show (s) equilibrium ?View SolutionThe following curve is obtained when molar conductivity (∧m) is plotted against the square root of concentration, c1/2 for two electrolytes A and B
(a) How do you account for the increase in the molar conductivity of the electrolyte A on dilution.

(b) As seen from the graph, the value of limiting molar conductivity (∧0m) for electrolyte B cannot be obtained graphically. How can this value be obtained?1View SolutionWhat is the shape of the curve obtained on plotting P against PV at constant temperature for an ideal gas ?
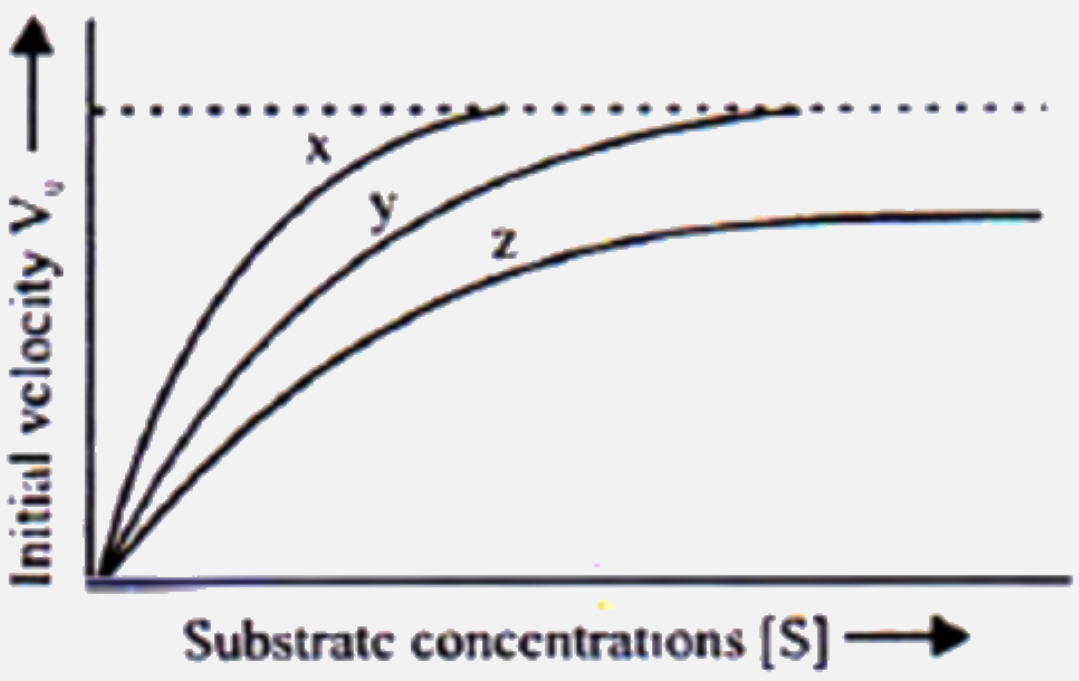
View SolutionThe Given figure shows three velocity-substrate concentration curves of an enzyme reaction. What do the curves X Y and Z depict respectively ?
 View Solution
When the temperature is increased then enzyme substrate reaction
View Solution(1) What is the shape of the curve obtained on plotting P against V at constant temperature for an ideal eas ?
(2) Which law is signified by the relation, V1T1=V2T2 ?View Solution
