Following represents the Maxwell distribution curve for an ideal gas at two temperature T1 and T2 . Which of the following option(s) is/are true?
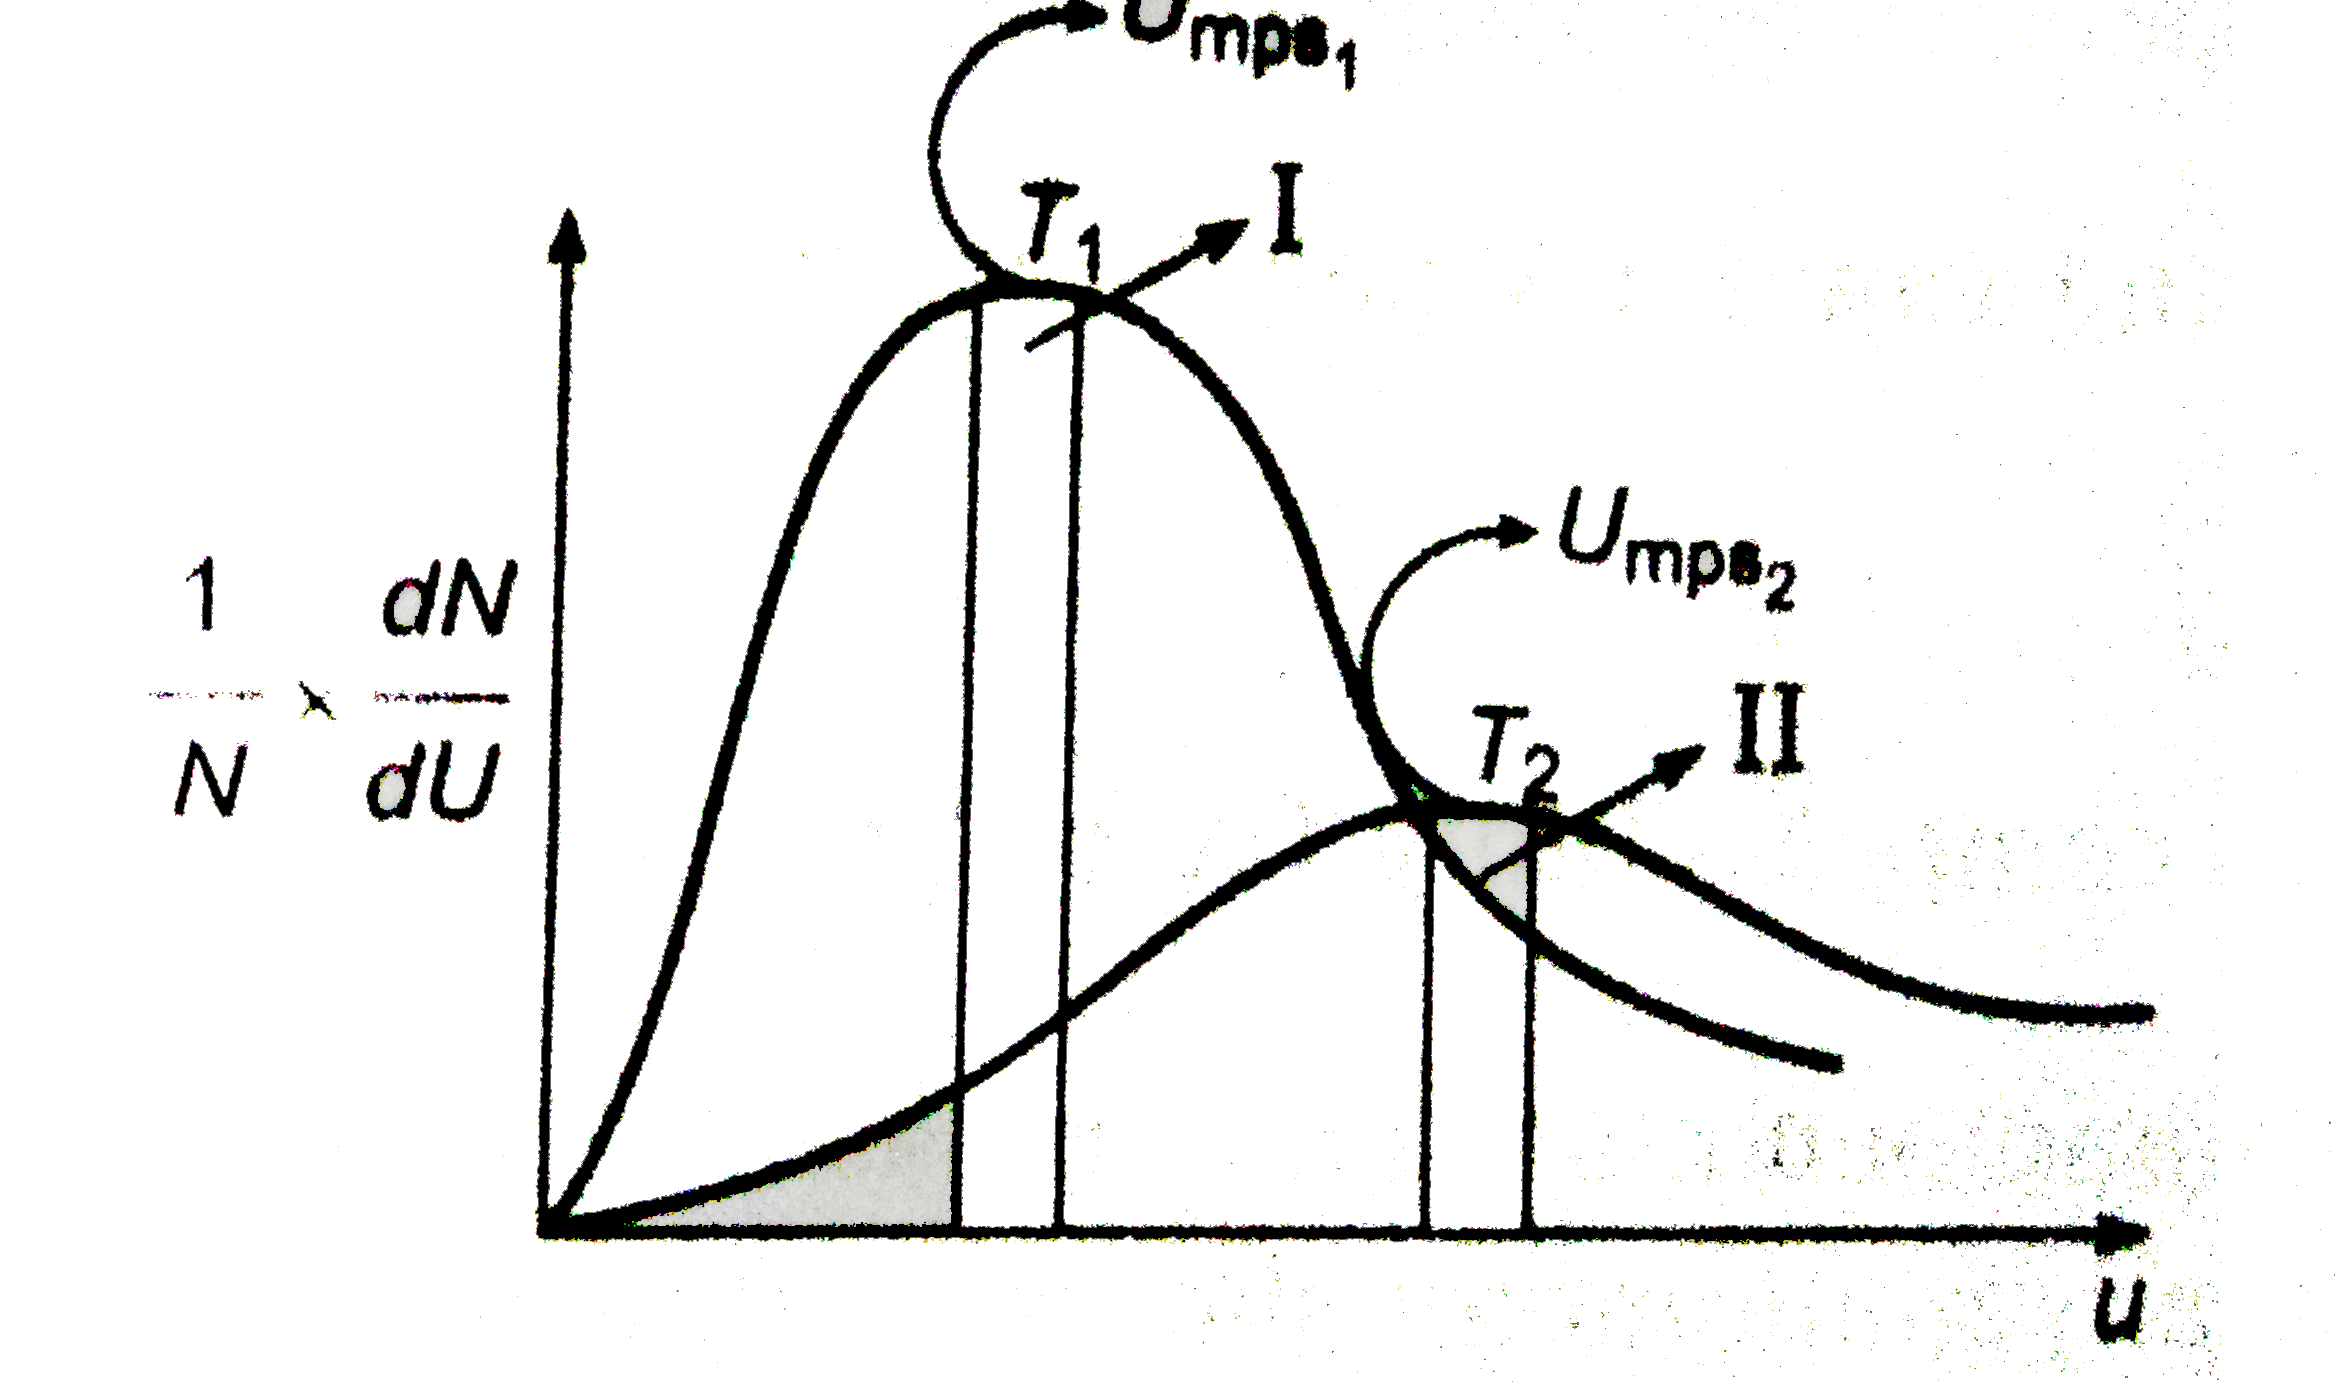
Total area under the two curves is independent to moles of gas
ump decrease as temperature decreases
T1>T2 and hence higher the temperature, sharper the curve
The fraction of molecules having speed ump decreases as temperature increases
The correct Answer is:a,b,d
(a,b,d) (A) ∵ area under the curve gives fraction of molecules and total area is constant.
(B) ump decreases with decrease in temperature.
(C) T2 is higher temperature
(D) As seen from graph, ∴ A,B,D
Topper's Solved these Questions
- GASEOUS STATEBOOK - NARENDRA AWASTHI ENGLISHCHAPTER - GASEOUS STATEEXERCISE - Match the Column
7 Videos
- GASEOUS STATEBOOK - NARENDRA AWASTHI ENGLISHCHAPTER - GASEOUS STATEEXERCISE - Assertion-ReasonType Questions
16 Videos
- GASEOUS STATEBOOK - NARENDRA AWASTHI ENGLISHCHAPTER - GASEOUS STATEEXERCISE - Level 3 Passage 3
4 Videos
- ELECTROCHEMISTRYBOOK - NARENDRA AWASTHI ENGLISHCHAPTER - ELECTROCHEMISTRYEXERCISE - Subjective problems
14 Videos
- IONIC EEQUILIBRIUMBOOK - NARENDRA AWASTHI ENGLISHCHAPTER - IONIC EEQUILIBRIUMEXERCISE - Subjective problems
1 Videos
Similar Questions
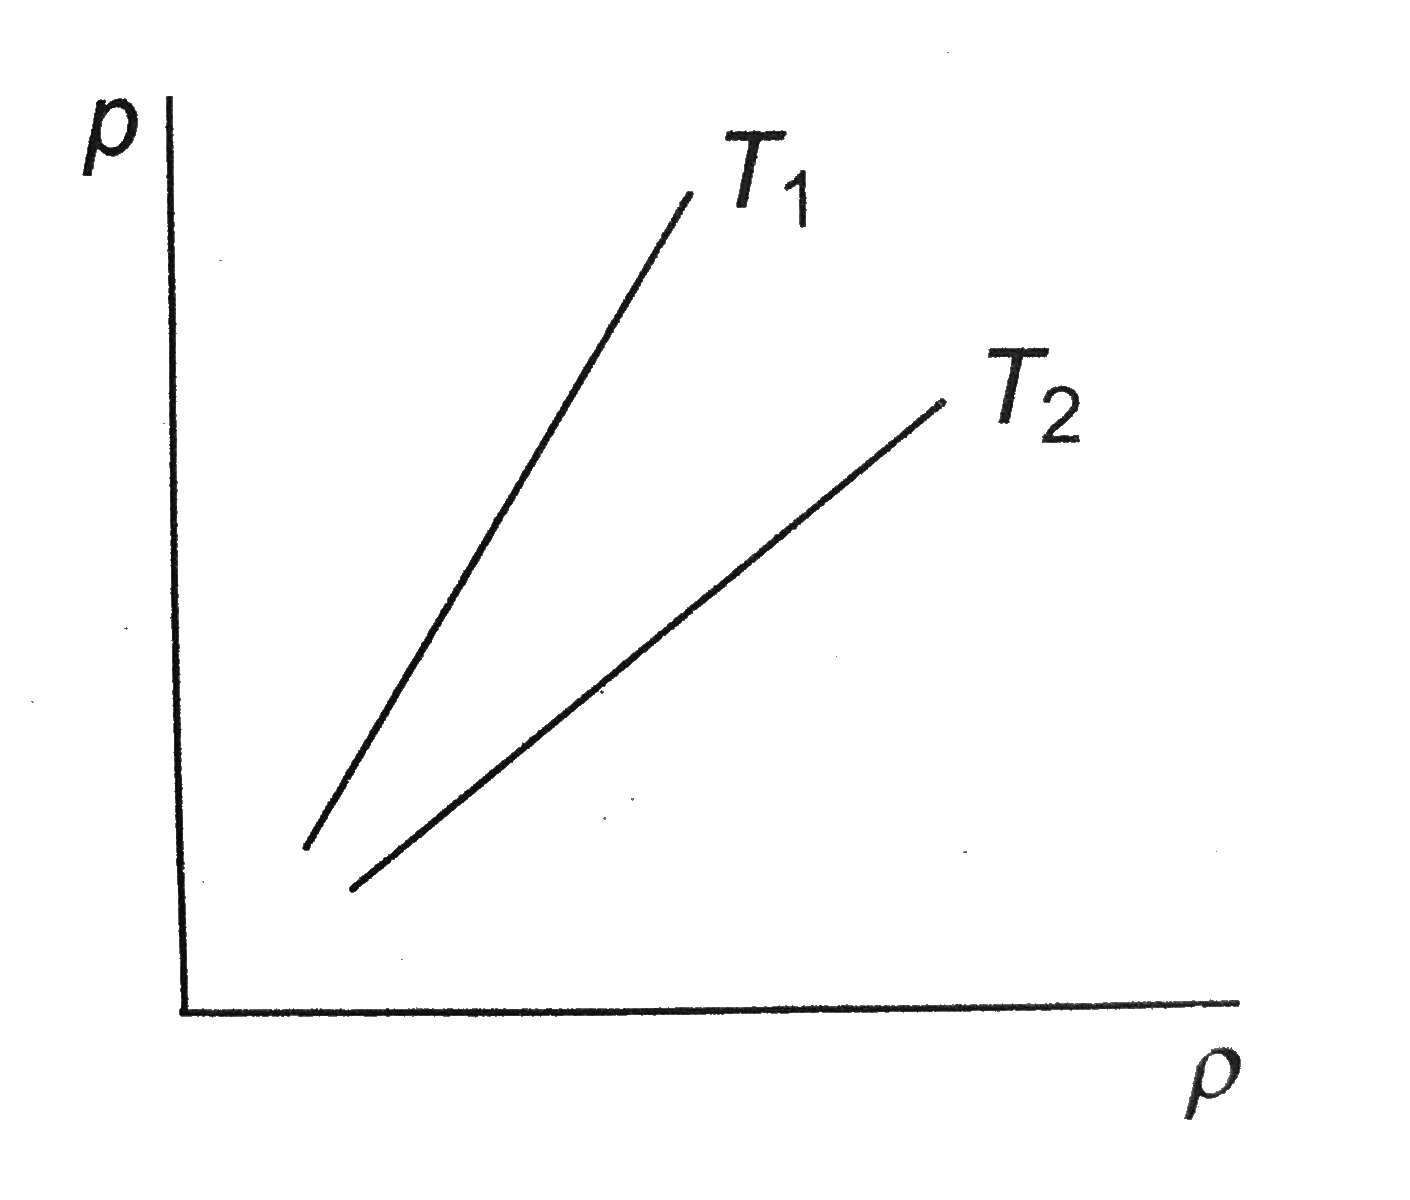
Figure shows graphs of pressure vs density for an ideal gas at two temperature T1andT2. Which of the following is correct?
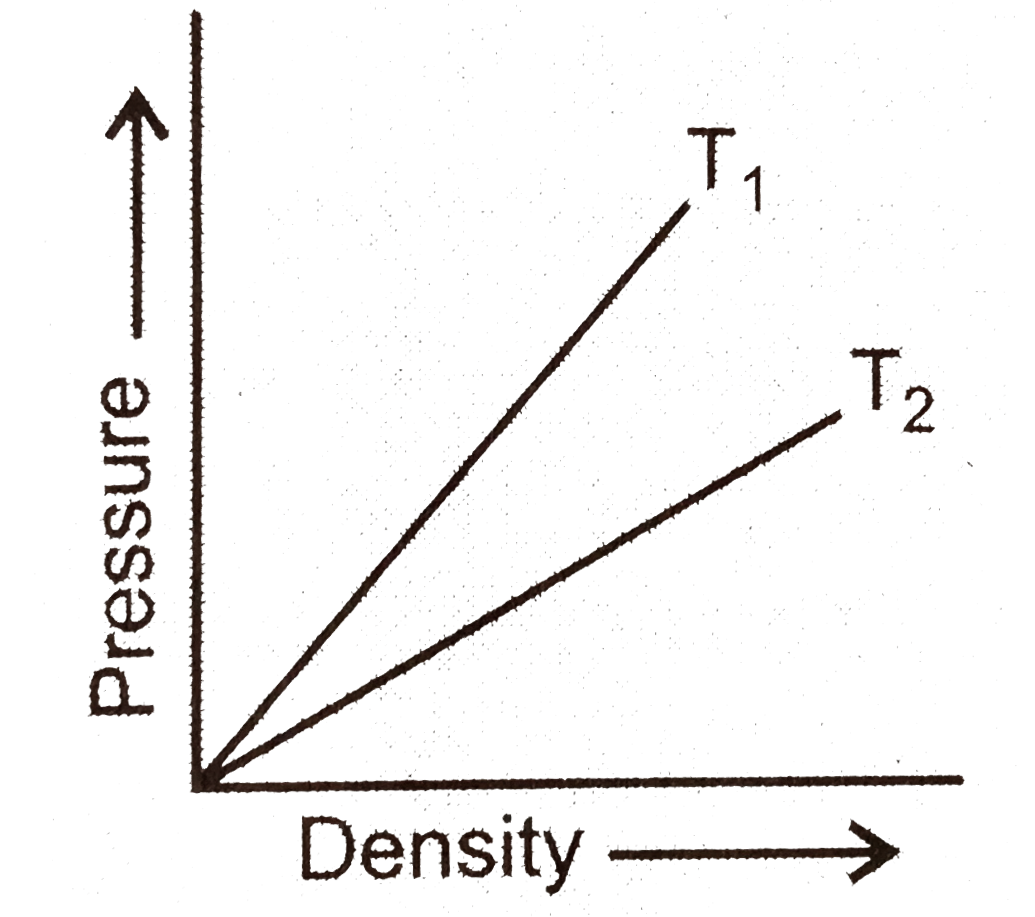
View SolutionFigure shows graphs of pressure versus density for an ideal gas at two temperatures T1 and T2 Which is correct ?
 .
.
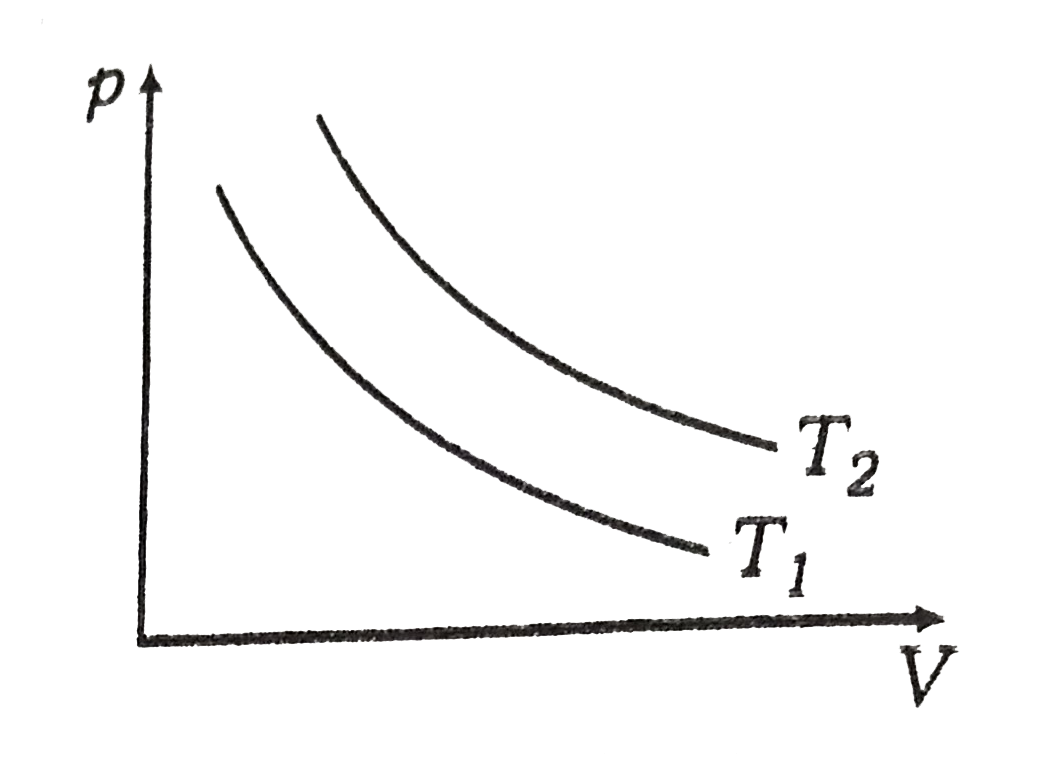
View SolutionThe adjoining fgure shows graph of pressure and volume of a gas at two temperatures T1 and T2 Which one the following is correct
View SolutionThe specific heat of an ideal gas varies with temperature T as
View SolutionShown below are the black body radiation curves at temperature T1 and T2(T2>T1). Which of the following plots is correct?
View SolutionWhich of the following expressions is true for an ideal gas ?
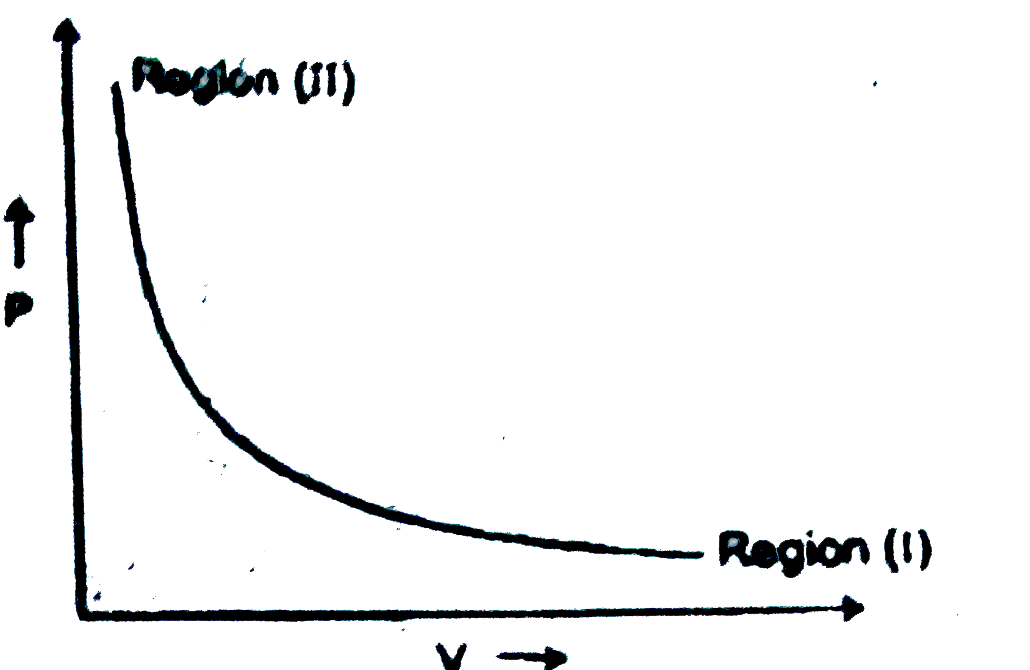
View SolutionFollowing graph represents a pressure (P) volume (V) relationship at a fixed temperature (T) for n moles of a real gas. The graph has two regions marked (I) and (II). Which of the following options is true.
View SolutionFollowing graph represents a pressure (P) volume (V) relationship at a fixed temperature (T) for n moles of a real gas. The graph has two regions marked (I) and (II). Which of the following options is true.
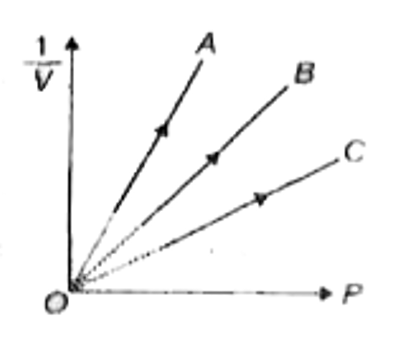
View SolutionFigure shows the isotherms of a fixed mass of an ideal gas at three temperatures TA,TB and TC , then
View SolutionWhich of the Maxwell distribution curves (obtained at different temperatures) shown in the following figure corresponds to the highest temperature of the gas ?
View Solution
