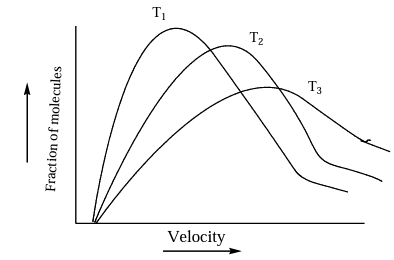
In the graph showing Maxwell,Boltzman distribution of energy…….
area under the curve must not change with increase in temperature
area under the curve increases with increase in temperature
area under the curve decreases with increases in temperature
with increase in temperature curve broadens and shifts to the right hand side.
The correct Answer is:(A),(D)

Graph (i) in this graph temperature increase but the area of curve does not change whether the curve does not change whether the curve is changed .(ii)It is clear from the graph as the temperature increases the graph shift towards right side and become broaden.
Topper's Solved these Questions
- CHEMICAL KINETICSBOOK - KUMAR PRAKASHANCHAPTER - CHEMICAL KINETICSEXERCISE - Section-D (Short Answer Type Question)
20 Videos
- CHEMICAL KINETICSBOOK - KUMAR PRAKASHANCHAPTER - CHEMICAL KINETICSEXERCISE - Section-D (Matching The columns)
4 Videos
- CHEMICAL KINETICSBOOK - KUMAR PRAKASHANCHAPTER - CHEMICAL KINETICSEXERCISE - Section-D (NCERT Exemplar Solution)(Multiple Choice Quetions)
20 Videos
- BOARD EXAM QUESTION PAPER MARCH - 2020 BOOK - KUMAR PRAKASHANCHAPTER - BOARD EXAM QUESTION PAPER MARCH - 2020 EXERCISE - PART -B
23 Videos
- CHEMISTRY IN EVERYDAY LIFEBOOK - KUMAR PRAKASHANCHAPTER - CHEMISTRY IN EVERYDAY LIFEEXERCISE - SECTION - E (MCQs ASKED IN GUJCET/BOARD EXAM)
37 Videos
Similar Questions
In the following graph of Maxwell - Boltzmann distribution of molecular velocities . Which of the following is the correct order of temperature ?

View SolutionIn the following graph of Maxwell - Boltzmann distribution of molecular velocities . Which of the following is the correct order of temperature ?

View Solution
Knowledge Check
In the graph showing Maxwell Boltzmann distribution of energy ................ .
Aarea under the curve increases with increase in temperatureBarea under the curve decreases with increase in temperatureCwith increase in temperature curve broadens and shifts to the right hand side.Das a gas cools to a lower temperature, the peak of the graph shifts to the leftIn the graph showing Maxwell, Boltzmann distribution of energy ……….. .
Aarea under the curves must not change with increase in temperatureBarea under the curve increase with increase in temperatureCarea under the curve decrease with increase in temperatureDwith increase in temperature curve boradens and shifts to the right hand sideAccording to Maxwell Boltzmann distribution of energy
Athe fraction of molecules with most probable kinetic energy decrease at higher temperaturesBthe fraction of molecules with most probable kinetic energy increases at higher temperaturesCmost probable kinetic energy decreases at higher temperaturesDmost probable kinetic energy decreases at higher temperatures.
Maxwell Boltzmann Distribution Of Speeds And Its Features
View SolutionDraw the graph showing distribution of kinetic energy of electrons emitted during beta decay.
View SolutionState Stefan's law. Sketch graphs showing the distribution of energy in the spectrum of black body radiation at three temperatures, and indicate which curve corresponds to the highest temperature.
View SolutionAccording to Maxwell Boltzmann distribution of energy
View SolutionThe maximum in the curves describing the Maxwell-Boltzmann distribution of speeds corresponds to
View Solution
