Variation of x/m vs P are plotted for a gas at different temperatures as shown below. The correct order of temperature is:
 Solution in Malayalam
Step by step video & image solution for Variation of x/m vs P are plotted for a gas at different temperatures as shown below. The correct order of temperature is: by Chemistry experts to help you in doubts & scoring excellent marks in Class 12 exams.
Updated on:21/07/2023Topper's Solved these Questions
- SURFACE CHEMISTRY BOOK - BRILLIANT PUBLICATIONCHAPTER - SURFACE CHEMISTRY EXERCISE - QUESTIONS (LEVEL - II)
24 Videos
- SURFACE CHEMISTRY BOOK - BRILLIANT PUBLICATIONCHAPTER - SURFACE CHEMISTRY EXERCISE - QUESTIONS (LEVEL - II) (ASSERTION REASON TYPE QUESTIONS)
6 Videos
- STEREOCHEMISTRY BOOK - BRILLIANT PUBLICATIONCHAPTER - STEREOCHEMISTRY EXERCISE - LEVEL-II (ASSERTION - REASON TYPE)
2 Videos
- THE D- AND F-BLOCK ELEMENTBOOK - BRILLIANT PUBLICATIONCHAPTER - THE D- AND F-BLOCK ELEMENTEXERCISE - LEVEL-II (ASSERTION-REASON TYPE)
40 Videos
Similar Questions
1.30 litre of O2 gas at 1 atm and 300 K is exposed to a solid surface of 3g in a container. After adsorption the pressure of O2 is reduced to 0.7 atm. What is the value of xm
View SolutionAssertion: Enzymes are proteins and enzyme catalysed reactions are called biological catalysis.
Reason: The activity of enzyme catalysis increase in presence of vitamins.
View SolutionAssertion : Meso tartaric acid is optically inactive
Reason : Meso tartaric acid has a plane of symmetry
View SolutionAssertion : Zn, Cd and Hg are not considered as transition metals.
Reason :d-orbitals in Zn, Cd and Hg are completely filled, both in ground state and in their available oxidation states.
View SolutionPlot density vs pressure for a fixed mass of an ideal gas at a constant temperature.
View SolutionWhy is the PV vs P plot for an ideal gas at a given temperature parallel to P axis?
View SolutionThe plots of the extent of adsroption (x/m) Vs pressure at different temperature are as follows, The correct order of increasing temp for curves I, II, III, IV are ,
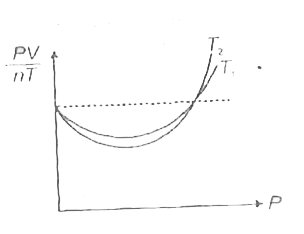
View SolutionThe figure shows the plot of PVnT vs P, for oxygen gas at two different temperatures then

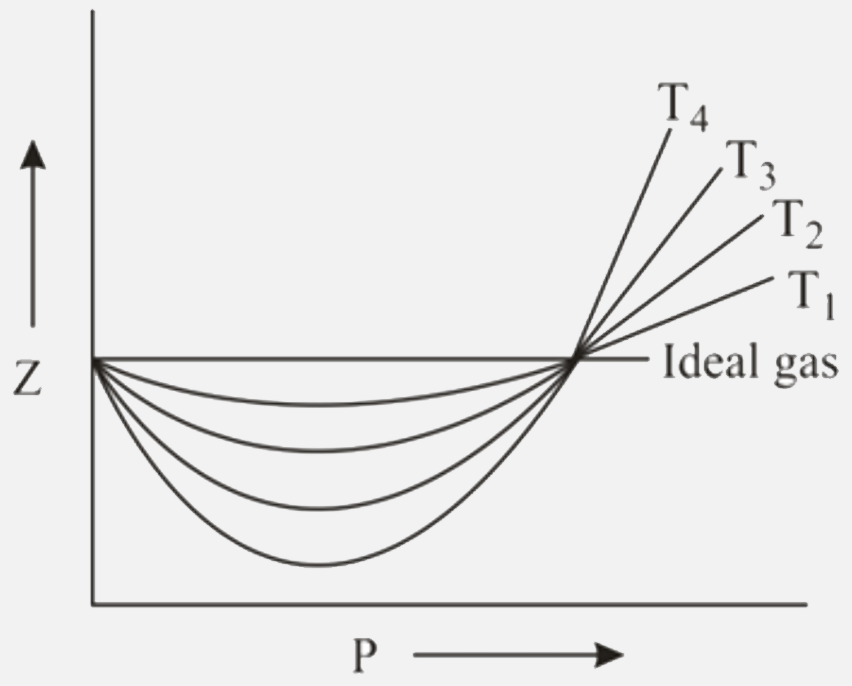
View SolutionCompressibility factor (Z) is plotted against pressure at different temperature for same gas

Which of the following is the correct order of temperature shown in the above plot ?
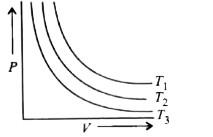
View SolutionThe graph of P vs V is given at different temperature The correct relationship is
View SolutionP vs V का ग्राफ विभिन्न तापों पर दिया गया है।

सही संबंध है -
View SolutionFor a chemical reaction variation in concentraction, ln[R] vs. time (min) plot is shown below : What is the order of the reaction?
View SolutionThe figure shows the plot of PVnT vs P, for oxygen gas at two different temperatures then

View SolutionAt constant temperature, the effect of change of pressure on volume of a gas was as given below

Plot the following graphs :
P vs V
View SolutionAt constant temperature, the effect of change of pressure on volume of a gas was as given below Plot the following graphs : P vs 1/V
View SolutionAt constant temperature, the effect of change of pressure on volume of a gas was as given below Plot the following graphs : PV vs P.
View Solution
