Write an analytic paragraph on the number of Corona Virus (COVID-19) cases across Indian states (as on May 1), 2020. Compare and contrast where relevant (first ten).
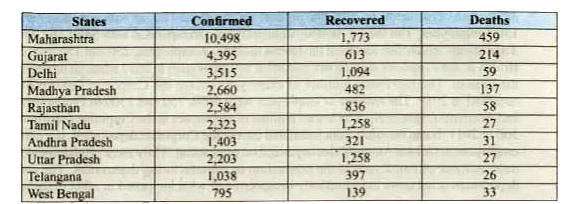
The given table lists the number of COVID-19 related deaths in various states of India as on May 1, 2020. The table also account the number of confirmed cases and the number of people who recovered coming out from the jaws of the deadly Corona Virus.
The overall picture may not appear as shocking as that of the USA and Europe. The Western state of Maharashtra reported the highest number of COVID-19 cases as of May 1, 2020, with 10,498 cases. Gujarat and the capital city Delhi trailed behind with 4,395 and 3515 confirmed cases respectively. Interestingly, while Maharashtra and Gujarat lead in the number of deaths, Madhya Pradesh overtakes Delhi in the number of deaths at 137, compared to Delhi.s modest figure of 59. Telangana shows the least number of confirmed cases (1038), as well as the number of deaths, coming at the bottom with just 26 deaths. Interestingly and mercifully, the most populous state of India, Uttar Pradesh recorded just 27 deaths, only one more than Telangana. In India, at least, the impact of Corona was quite subdued as compared to the USA and Europe. Maharashtra also topped the number of .recovered persons. with 1,773. Uttar Pradesh, Tamil Nadu and Delhi have satisfactory number of .recovered cases. at 1,258, 1,258 and 1,094 respectively. Overall, the situation in India due to COVID-19, is definitely a cause of concern but, in no way panicky. With continued .Lockdowns., it is hoped that India would come out victorious in its fight against COVID-19.
Topper's Solved these Questions
- BOOK - FULL MARKSCHAPTER - COMPOSITION - II (WRITING ANALYTICAL PARAGRAPH ON MAP/CHART/REPORT/ LINE GRAPH)EXERCISE - ANALYTIC STUDY OF REPORTS3videos
COMPOSITION - II (WRITING ANALYTICAL PARAGRAPH ON MAP/CHART/REPORT/ LINE GRAPH)
- BOOK - FULL MARKSCHAPTER - COMPOSITION - II (WRITING ANALYTICAL PARAGRAPH ON MAP/CHART/REPORT/ LINE GRAPH)EXERCISE - ANALYTIC STUDY OF MAPS3videos
COMPOSITION - II (WRITING ANALYTICAL PARAGRAPH ON MAP/CHART/REPORT/ LINE GRAPH)
- BOOK - FULL MARKSCHAPTER - COMPOSITION - II (WRITING ANALYTICAL PARAGRAPH ON MAP/CHART/REPORT/ LINE GRAPH)EXERCISE - PIE CHARTS4videos
COMPOSITION - II (WRITING ANALYTICAL PARAGRAPH ON MAP/CHART/REPORT/ LINE GRAPH)
- BOOK - FULL MARKSCHAPTER - CLOZE PASSAGEEXERCISE - Fill in the most appropriate option in each blank from those given below to complete the following passage.112videos
CLOZE PASSAGE
- BOOK - FULL MARKSCHAPTER - COMPOSITION-IEXERCISE - IV. OFFICIAL LETTERS ON ALL SITUATIONS (SOLVED EXAMPLES)29videos
COMPOSITION-I
Similar Questions
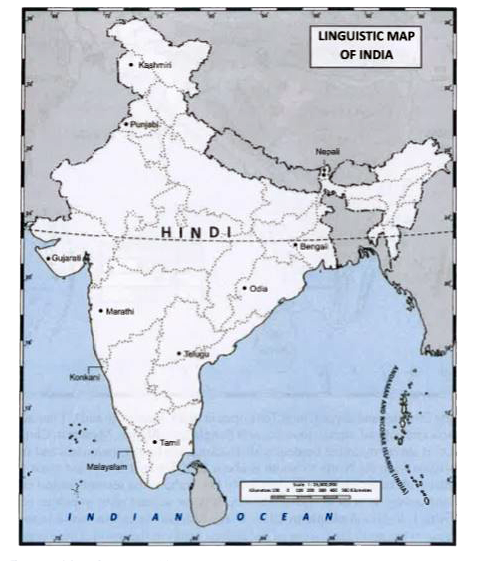
The map given above illustrates the main languages of India which are spoken in different parts of India. After studying the map write an analytic paragraph highlighting the number of major languages and the number of native speakers. Compare and contrast where relevant.
 View Solution
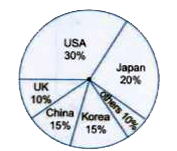
The following pie chart shows the foreign Direct Investment in India during 2019-2020. Write an analytic paragraph showing the general trends and the necessary details. Compare the segments where relevant.
 View Solution
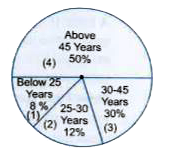
The following pie chart represents the distribution of the overseas tourists and their age profile respectively. Study the chart carefully and write an analytic paragraph (150- 200 words) giving the general trends and other necessary details. Don' forget to compare the segments where relevant.
 View Solution
In the graph given below we get a shocking picture of deaths in the USA due to Corona Virus that showed a constant upward trend in the month of April 2020. Write an analytic paragraph describing the general trend and other details after analysing the graph.
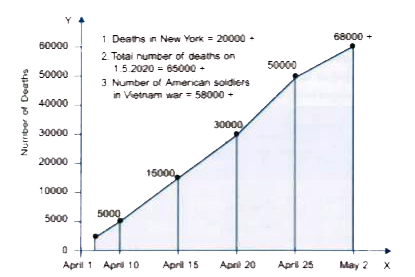 View Solution
The bar chart given below illustrates the total Foreign Direct Investment (FDI) into India from all over the world. Summarise and write an analytic paragraph selecting the main features and giving all the necessary details. Compare where you find it relevant.
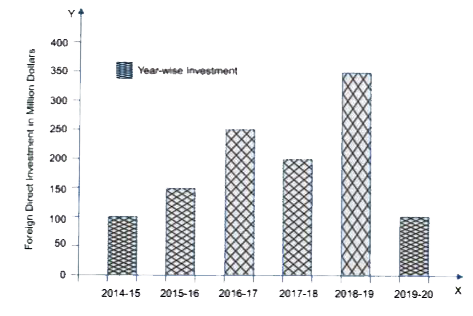 View Solution
The chart below shows the expenditure of two countries X and Y on consumer goods in 2020 in US million dollars.
Summarise and write an analytic paragraph highlighting main features and necessary details in 150-200 words. Compare where relevant.
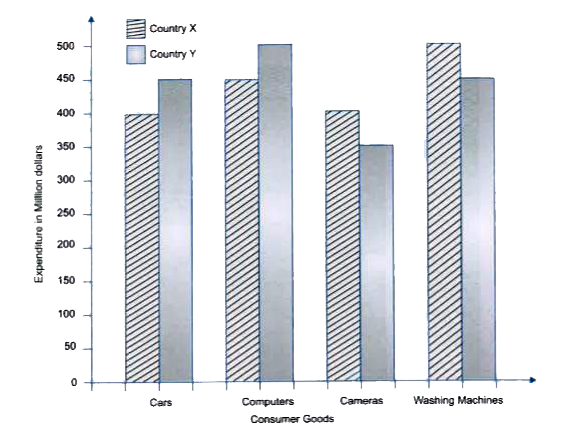 View Solution
The survey conducted by TOI involving 11000 respondents what people think about the lockdowns and the first things they would do if they are lifted. Summarise and write an analytic paragraph highlighting the general trends and other necessary details. Compare wherever relevant.
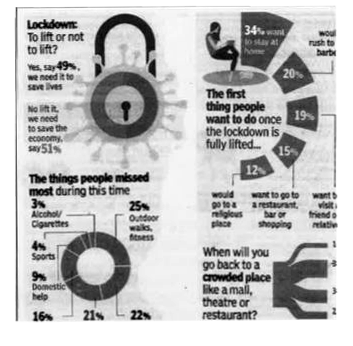 View Solution
Given above is the bar graph that represents the Total Sales Turnover of four major corporate giants of India. The figures shown record the total sales turnover in 3rd Quarter (September to December) and 4th Quarter (January to March). Summarise and write an analytic paragraph highlighting the general features and necessary details. Compare where you feel relevant.
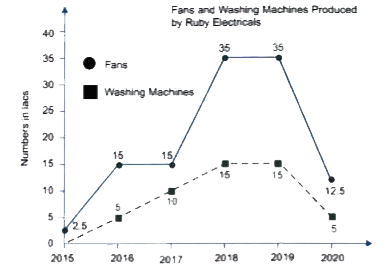
View SolutionThe line graph given below shows the number of Fans and Washing Machines produced by Ruby Electricals between 2015 and 2020. Summarise and write an analytic paragraph highlighting the main trends and the necessary details. Compare wherever relevant.
 View Solution
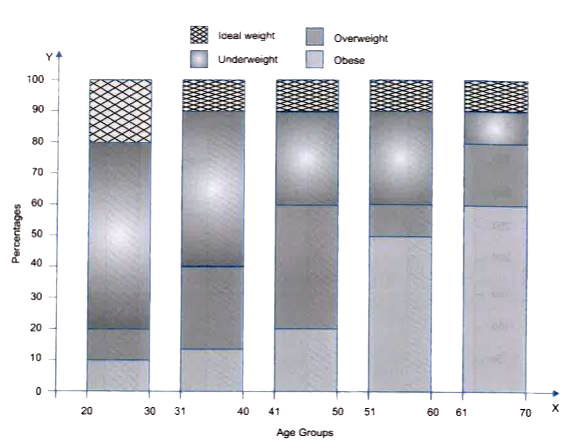
The chart given below illustrates the weight measurements of people in the United States of America in 2020. Summarise the information in an analytic paragraph of 150-200 words by selecting and reporting the main features. Make comparisons where relevant.
 View Solution

