(a) Define the terms , (i) threshold frequency and (ii) stopping potential in photoelectric effect.
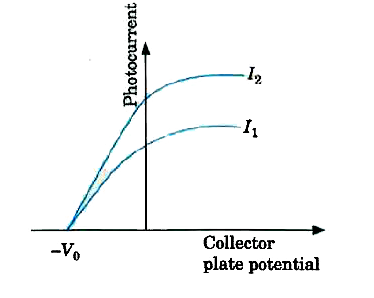
(b) Plot a graph of photocurrent versus anode potential for a radiation of frequency v and intensities .
.
Step-by-Step Solution
1. Threshold Frequency (ν₀):
- The threshold frequency is defined as the minimum frequency of the incident light required to eject photoelectrons from a material's surface. If the frequency of the incident light is below this threshold, no photoelectrons will be emitted, regardless of the intensity of the light. This is because the energy of the photons must be sufficient to overcome the work function (ϕ) of the material, which is the minimum energy needed to release an electron from the surface.
Mathematically:
E=hν
where E is the energy of the photon, h is Planck's constant, and ν is the frequency of the incident light. The threshold frequency can be expressed as:
ν₀ = \frac{ϕ}{h}
2. Stopping Potential (V₀):
- The stopping potential is the minimum potential difference required to stop the most energetic photoelectrons emitted from the surface of the material. When photoelectrons are emitted, they possess kinetic energy, and the stopping potential is the voltage that must be applied in the opposite direction to bring the kinetic energy of the electrons to zero.
Mathematically:
eV₀=KEmax
where e is the charge of the electron, V₀ is the stopping potential, and KEmax is the maximum kinetic energy of the emitted photoelectrons, given by:
KEmax=hν−ϕ
(b) Graph of Photocurrent vs. Anode Potential:
1. Setting Up the Axes:
- The x-axis represents the anode potential (V), and the y-axis represents the photocurrent (I).
2. Plotting the Graph:
- For a fixed frequency ν, we consider two different intensities I1 and I2 where I1<I2.
- At low anode potentials, the photocurrent increases as the potential increases, allowing more electrons to reach the anode.
- The photocurrent will reach a saturation point where all emitted electrons contribute to the current. This saturation current will be higher for the higher intensity I2 due to more photons being available to eject more electrons.
3. Characteristics of the Graph:
- Both curves for I1 and I2 will start from the origin and rise steeply at first, then level off as they approach saturation.
- The stopping potential (where the current drops to zero) will be the same for both intensities since the frequency is constant, meaning the maximum kinetic energy of the electrons is the same.
Graph Representation:
- Draw two curves on the graph:
- Curve for intensity I1 (lower saturation current).
- Curve for intensity I2 (higher saturation current).
- Both curves should have the same stopping potential.
- The threshold frequency is defined as the minimum frequency of the incident light required to eject photoelectrons from a material's surface. If the frequency of the incident light is below this threshold, no photoelectrons will be emitted, regardless of the intensity of the light. This is because the energy of the photons must be sufficient to overcome the work function (ϕ) of the material, which is the minimum energy needed to release an electron from the surface.
E=hν
where E is the energy of the photon, h is Planck's constant, and ν is the frequency of the incident light. The threshold frequency can be expressed as:
ν₀ = \frac{ϕ}{h}
- The stopping potential is the minimum potential difference required to stop the most energetic photoelectrons emitted from the surface of the material. When photoelectrons are emitted, they possess kinetic energy, and the stopping potential is the voltage that must be applied in the opposite direction to bring the kinetic energy of the electrons to zero.
eV₀=KEmax
where e is the charge of the electron, V₀ is the stopping potential, and KEmax is the maximum kinetic energy of the emitted photoelectrons, given by:
KEmax=hν−ϕ
- The x-axis represents the anode potential (V), and the y-axis represents the photocurrent (I).
- For a fixed frequency ν, we consider two different intensities I1 and I2 where I1<I2.
- At low anode potentials, the photocurrent increases as the potential increases, allowing more electrons to reach the anode.
- The photocurrent will reach a saturation point where all emitted electrons contribute to the current. This saturation current will be higher for the higher intensity I2 due to more photons being available to eject more electrons.
- Both curves for I1 and I2 will start from the origin and rise steeply at first, then level off as they approach saturation.
- The stopping potential (where the current drops to zero) will be the same for both intensities since the frequency is constant, meaning the maximum kinetic energy of the electrons is the same.
- Draw two curves on the graph:
- Curve for intensity I1 (lower saturation current).
- Curve for intensity I2 (higher saturation current).
- Both curves should have the same stopping potential.
Topper's Solved these Questions
- DUAL NATURE OF RADIATION AND MATTER BOOK - MODERN PUBLICATIONCHAPTER - DUAL NATURE OF RADIATION AND MATTER EXERCISE - Revision Exercises (Long Answer Questions)
3 Videos
- DUAL NATURE OF RADIATION AND MATTER BOOK - MODERN PUBLICATIONCHAPTER - DUAL NATURE OF RADIATION AND MATTER EXERCISE - Revision Exercises (Numerical Problems)
20 Videos
- DUAL NATURE OF RADIATION AND MATTER BOOK - MODERN PUBLICATIONCHAPTER - DUAL NATURE OF RADIATION AND MATTER EXERCISE - Revision Exercises (Fill in the Blanks)
11 Videos
- CURRENT ELECTRICITYBOOK - MODERN PUBLICATIONCHAPTER - CURRENT ELECTRICITYEXERCISE - Chapter Practice Test
15 Videos
- ELECTRIC CHARGES AND FIELDS BOOK - MODERN PUBLICATIONCHAPTER - ELECTRIC CHARGES AND FIELDS EXERCISE - Chapter Practice Test
15 Videos
Similar Questions
Knowledge Check
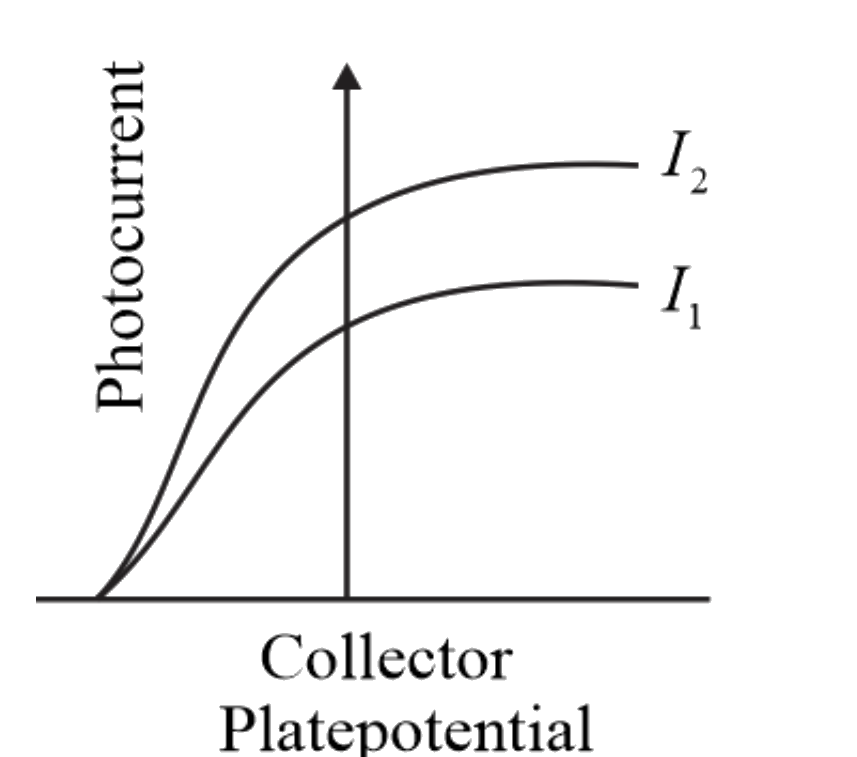
From the following graph of photocurrent against collector plate potential, for two different intensities of light I1andI2 one can conclude.
 AI1=I2BI1>I2CI1<I2DComparison is not possible
The act of photoelectric effect taking place with a certain photosensitive metal depends upon
(i) frequency annd
(ii) intensity of the incident radiation.Aboth (i) and (ii) are correctBonly (i) is correctConly (ii) is correctDneigher (i) nor (ii) is correct.
From the following graph of photocurrent against collector plate potential for two different intensities of light I1andI2 one can , conclude

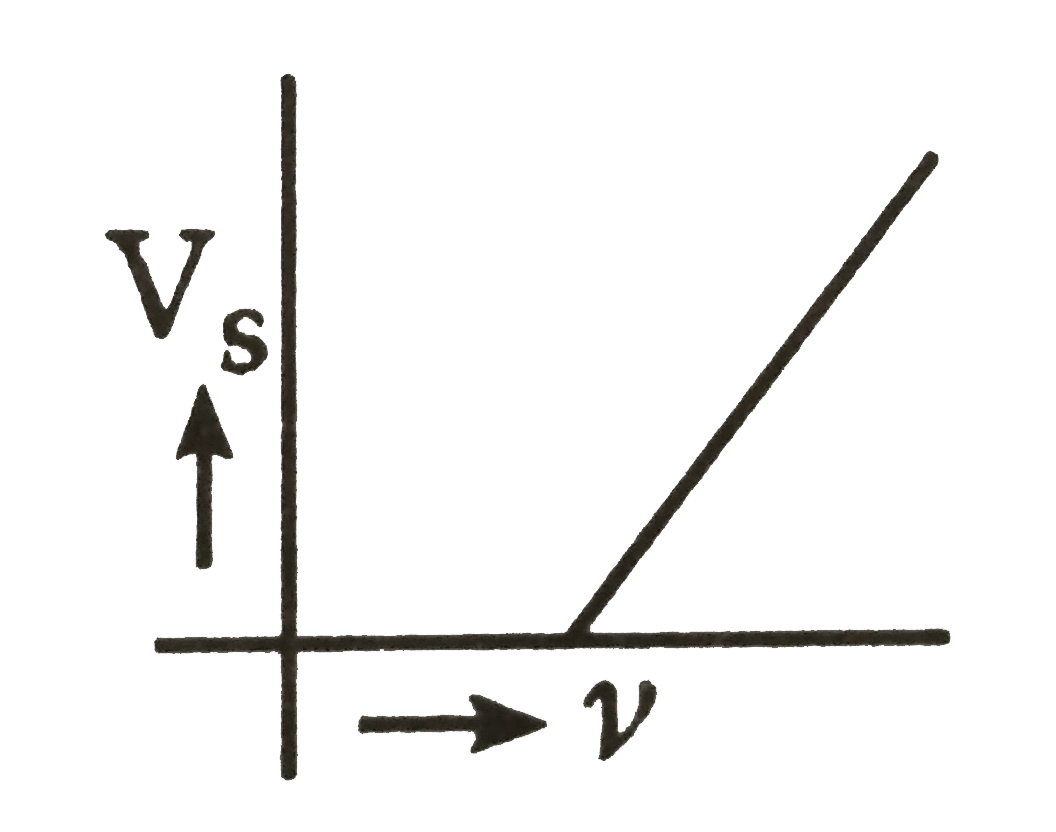
View SolutionDefine photoelectric effect. Draw a graph to show the variation of stopping potential with frequency of incident radiation on a metal plate.
View SolutionIn photoelectric effect the slope of straight line graph between stopping potential (Vs) and frequency of incident light (v) gives

View SolutionThe slope of the stopping potential versus frequency graph for photoelectric effect is equal to:
View SolutionDefine the following terms : (i) Order of reaction
(ii) Threshold energy.
View SolutionDoes the 'stopping potential' in photoelectric emission depend upon
(i) the intensity of the incident radiation in a photocell. ?
(ii) The frequency of the incident radiation ?
View Solution
