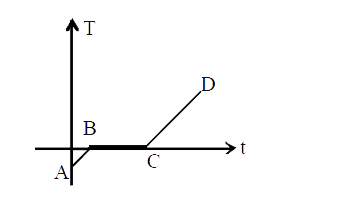
A solid substance is at 30∘C . To this substance heat energy is supplied at a constant rate. Then temperature versus time graph is as shown in the figure. The substance is in liquid state for the portion (of the graph)
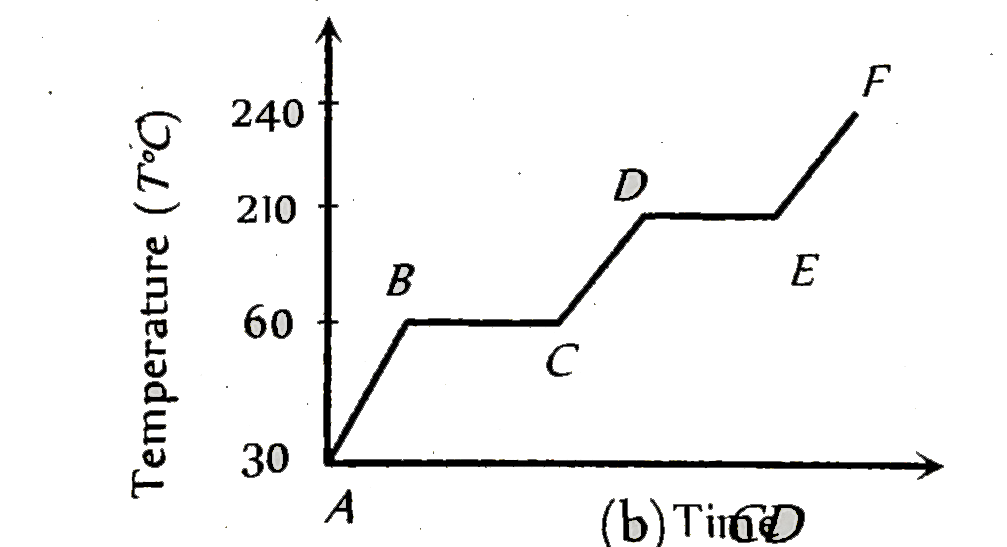
BC
CD
ED
EF
The correct Answer is:B
Step by step video, text & image solution for A solid substance is at 30^(@)C . To this substance heat energy is supplied at a constant rate. Then temperature versus time graph is as shown in the figure. The substance is in liquid state for the portion (of the graph) by Physics experts to help you in doubts & scoring excellent marks in Class 11 exams.
Updated on:21/07/2023Topper's Solved these Questions
- THERMOMETRY, THERMAL EXPANSION AND CALORIMETRY BOOK - ERRORLESS CHAPTER - THERMOMETRY, THERMAL EXPANSION AND CALORIMETRY EXERCISE - Assertion & Reason
14 Videos
- THERMOMETRY, THERMAL EXPANSION AND CALORIMETRY BOOK - ERRORLESS CHAPTER - THERMOMETRY, THERMAL EXPANSION AND CALORIMETRY EXERCISE - Self Evaluation Test
15 Videos
- THERMOMETRY, THERMAL EXPANSION AND CALORIMETRY BOOK - ERRORLESS CHAPTER - THERMOMETRY, THERMAL EXPANSION AND CALORIMETRY EXERCISE - Critical Thinking
27 Videos
- THERMODYNAMICSBOOK - ERRORLESS CHAPTER - THERMODYNAMICSEXERCISE - All Questions
304 Videos
- TRANSMISSION OF HEATBOOK - ERRORLESS CHAPTER - TRANSMISSION OF HEATEXERCISE - ET Self Evaluation Test
23 Videos
Similar Questions
Knowledge Check
Which of the substances A, B or C has the highest specific heat ? The temperature vs time graph is shown
 AABBCCDAll have equal specific heat
A solid material is supplied heat at a constant rate. The temperature of material is changing with heat input as shown in the figure. What does the slope of DE represent ?
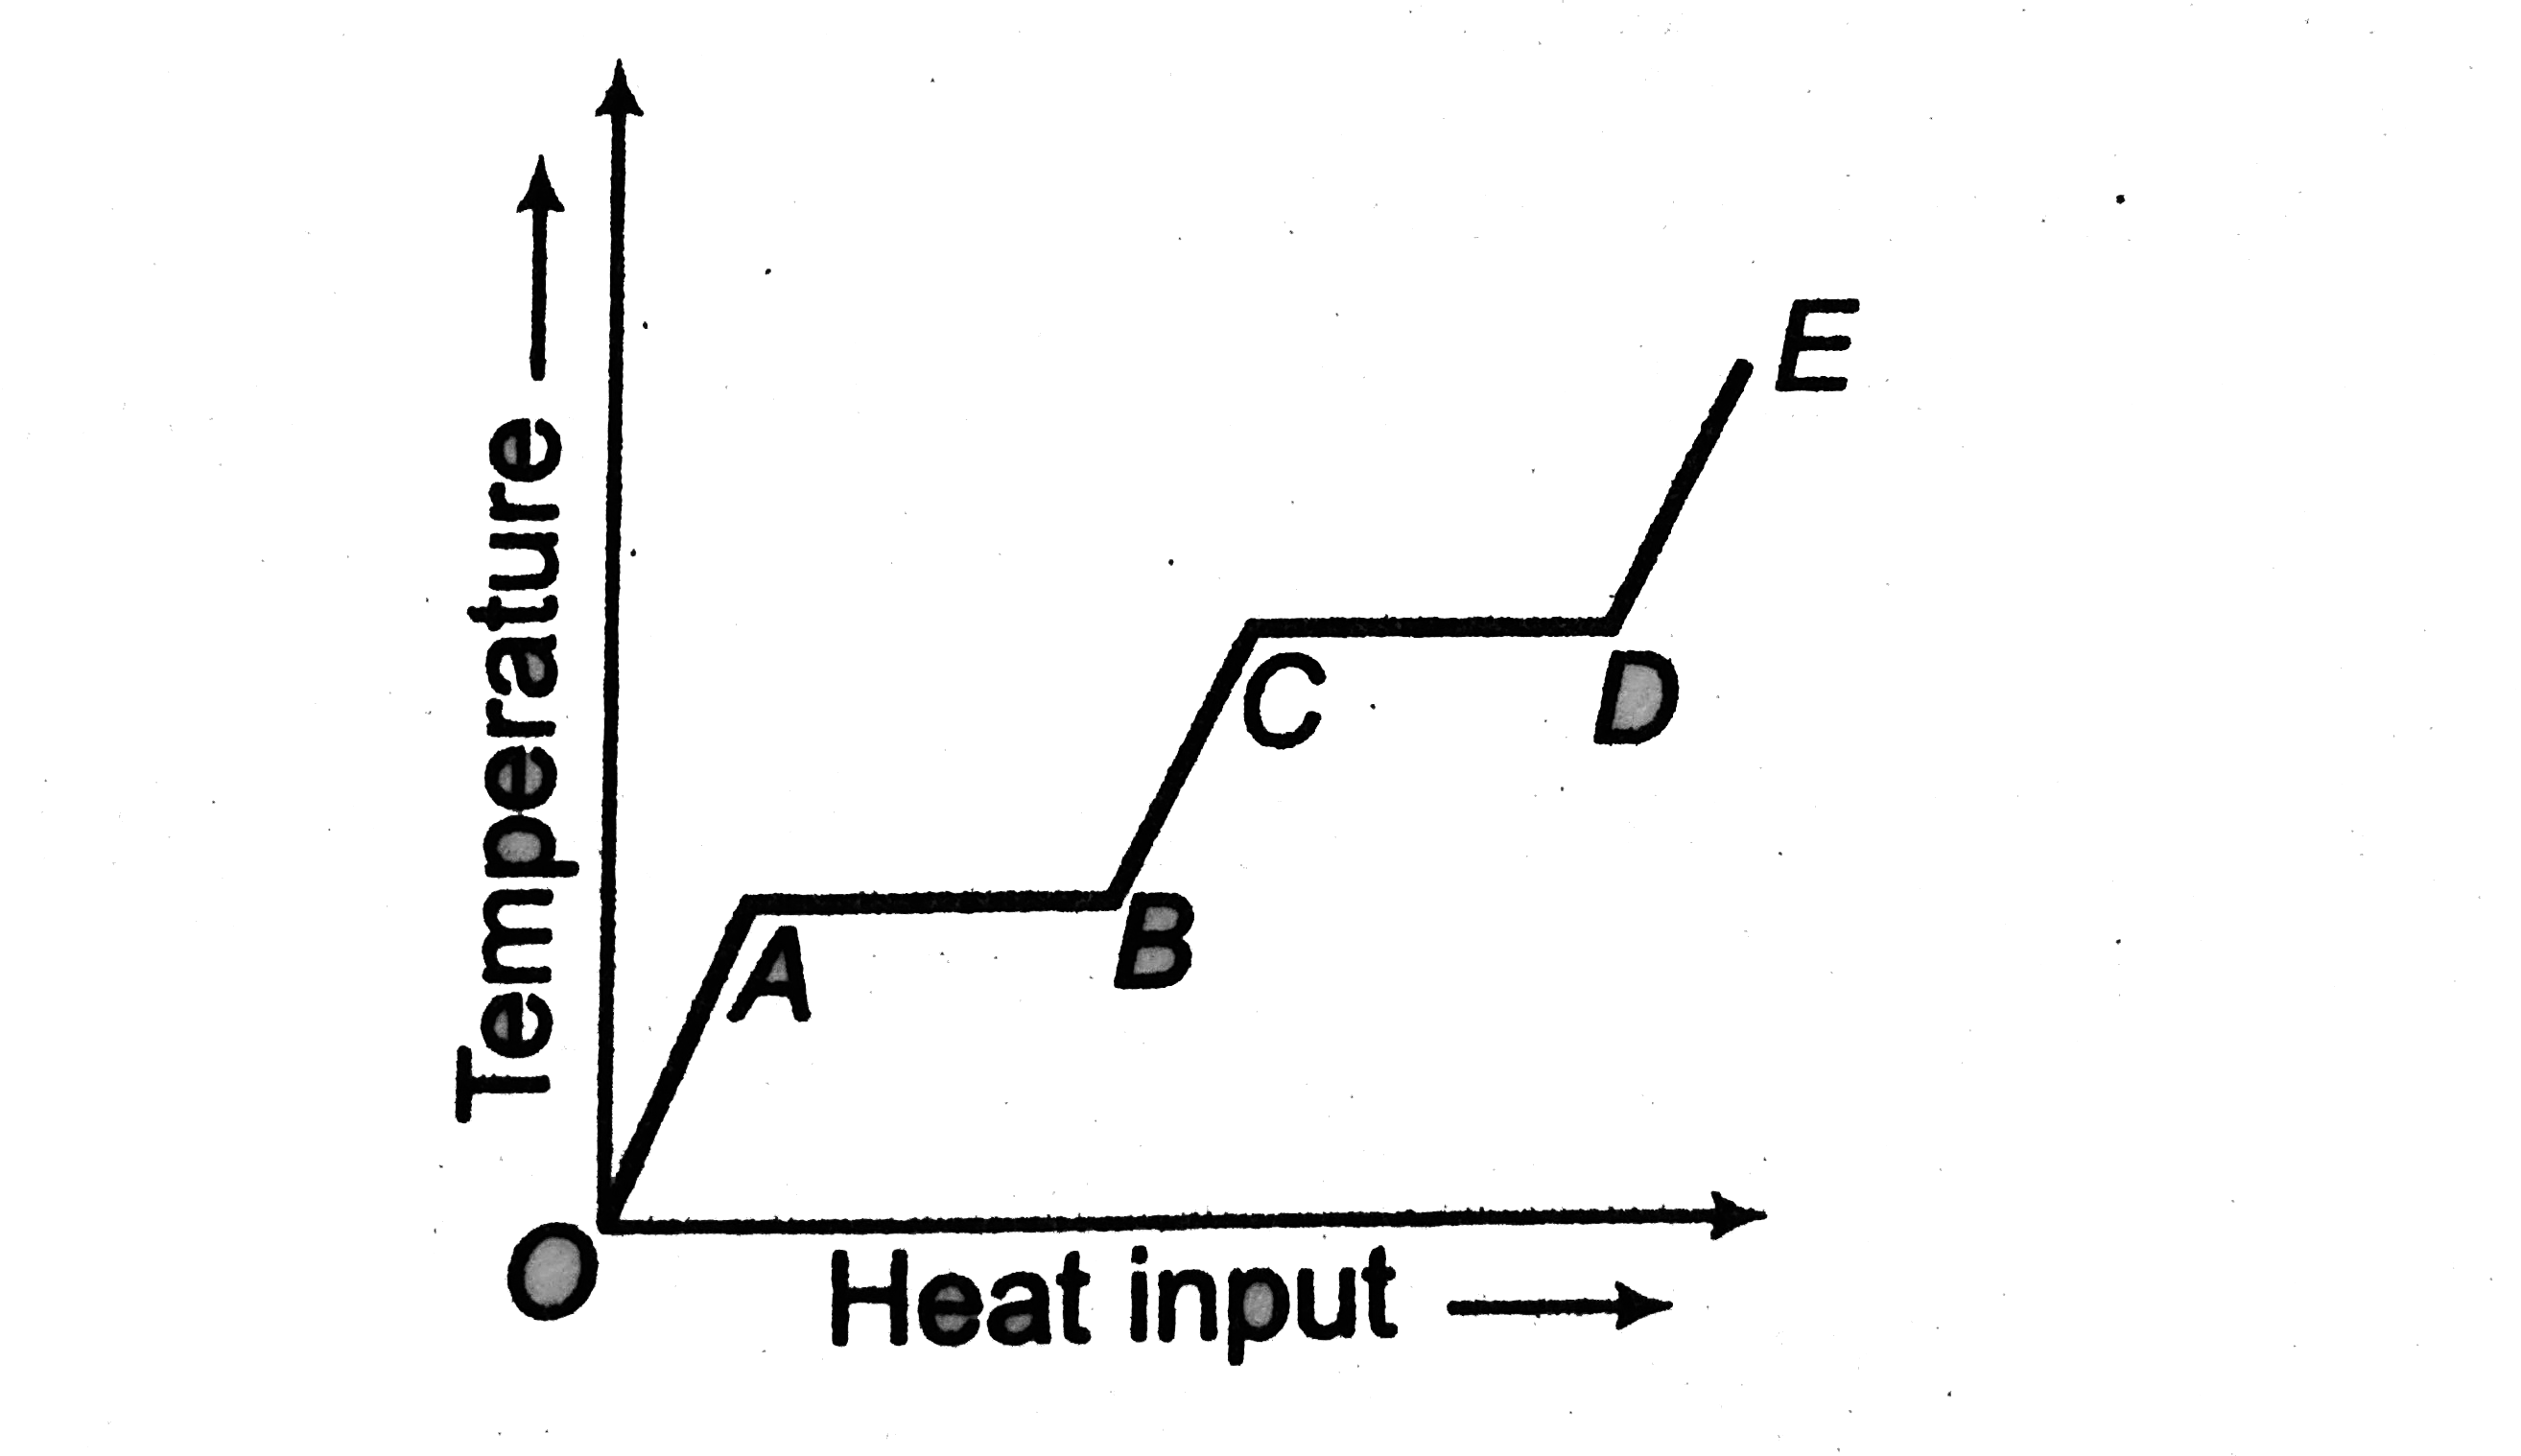 ALatent heat of liquidBLatent heat of vaporizationCHeat capacity of vapourDInverse of heat capacity of vapour
At room temperature a substance exists in the solid state only when
Athermal motion dominates over intermolecular forceBthermal motion is balanced by the intermoleuclar forcesCthermal motion is susperseded by the intermolecular forcesDconstituent particles are ions
In the above problem if heat is supplied at a constant rate of q=10cal/min, then plot temperature versus time graph.
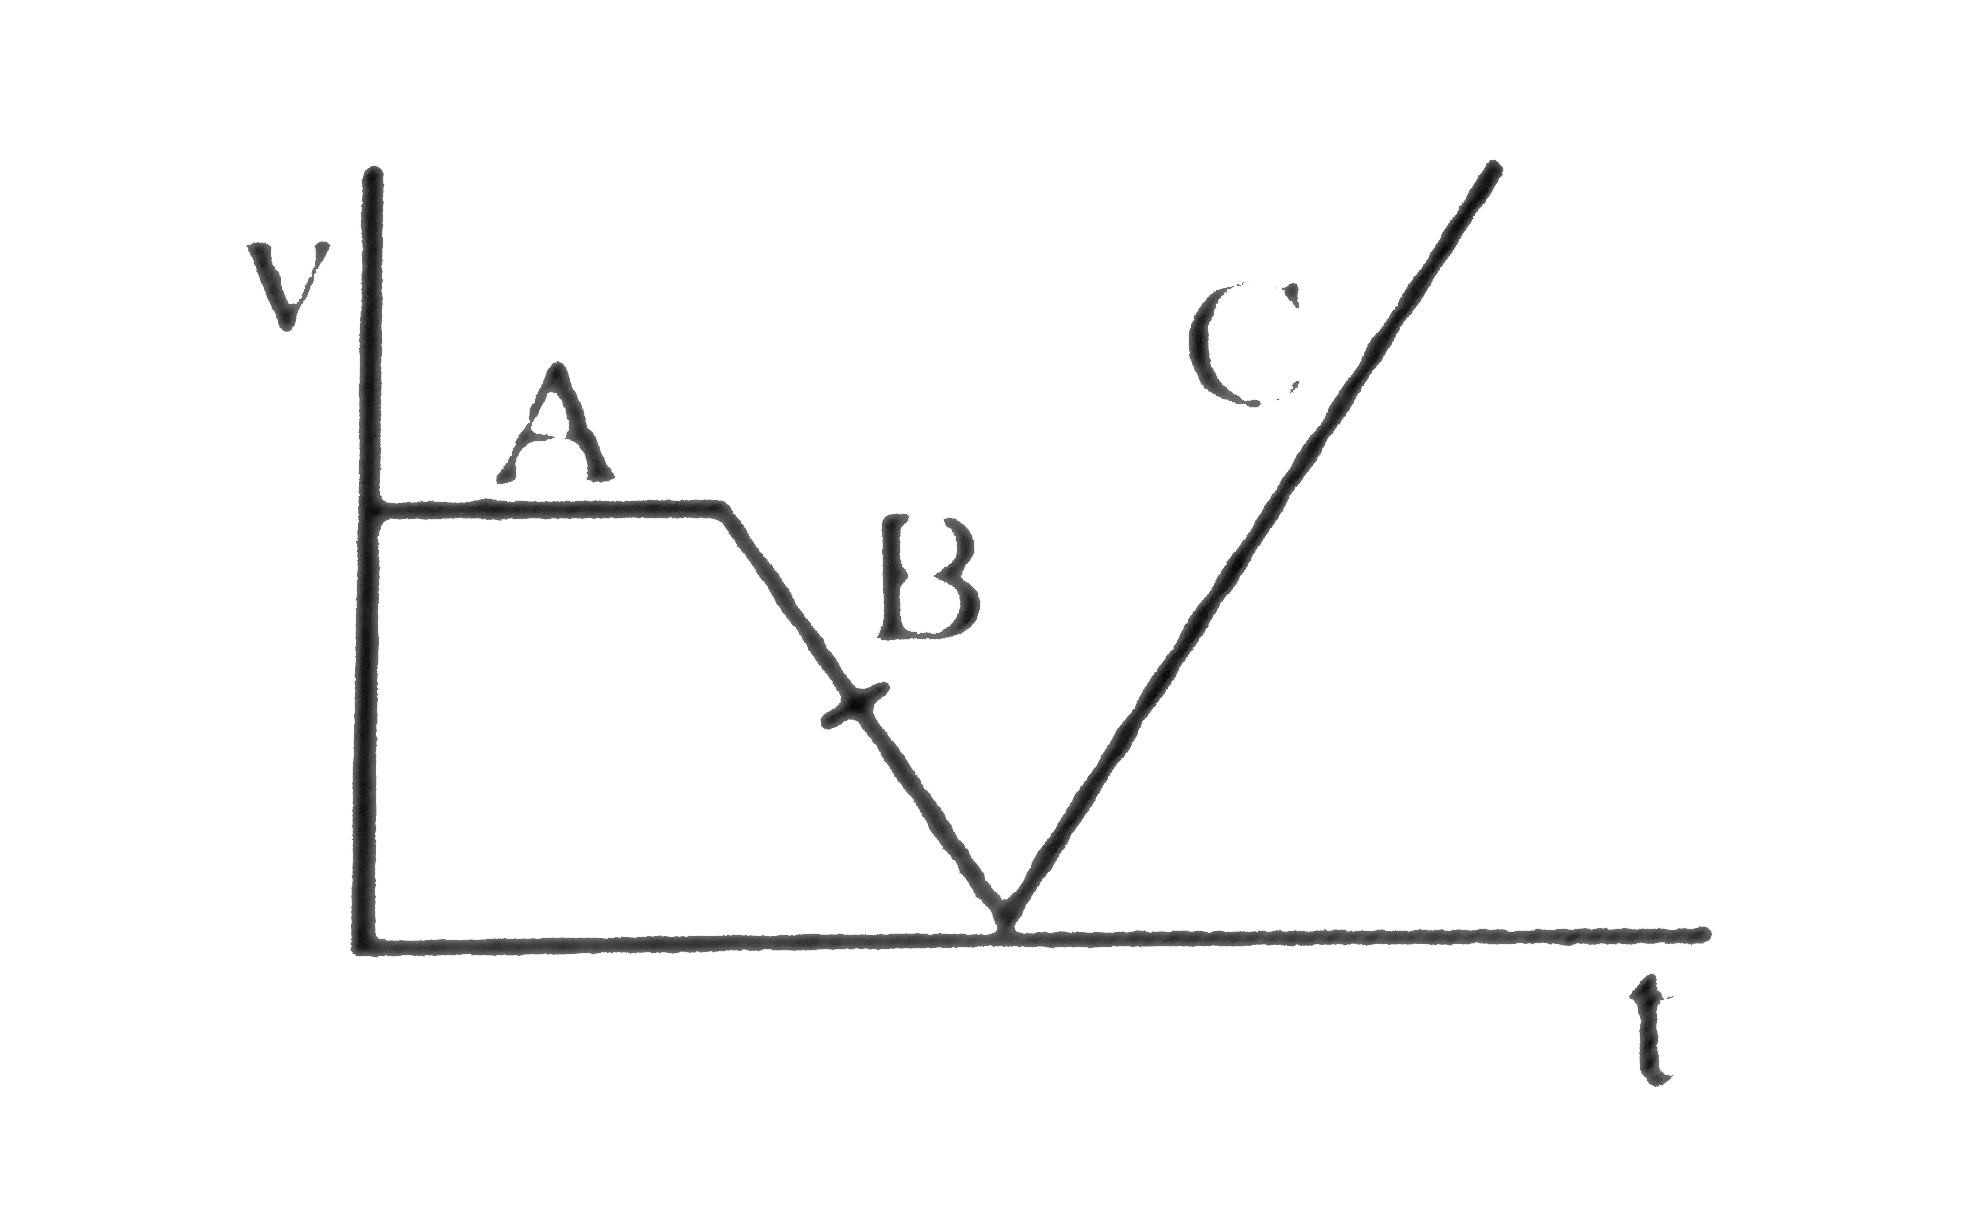
View SolutionVelocity versus time graph of a body is shown in figure. It explains that
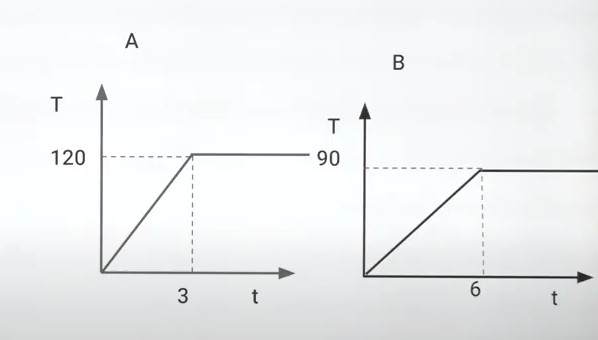
View SolutionTemperature vs. time graphs are given below for 2 substances. Compare specific heat capacity
View SolutionHeat energy can be supplied to a substance without increasing its temperature.
View SolutionA particle starts to move along a straight line. The acceleration versus time graph of particle is as shown in figure. The correct velocity versus time graph is :
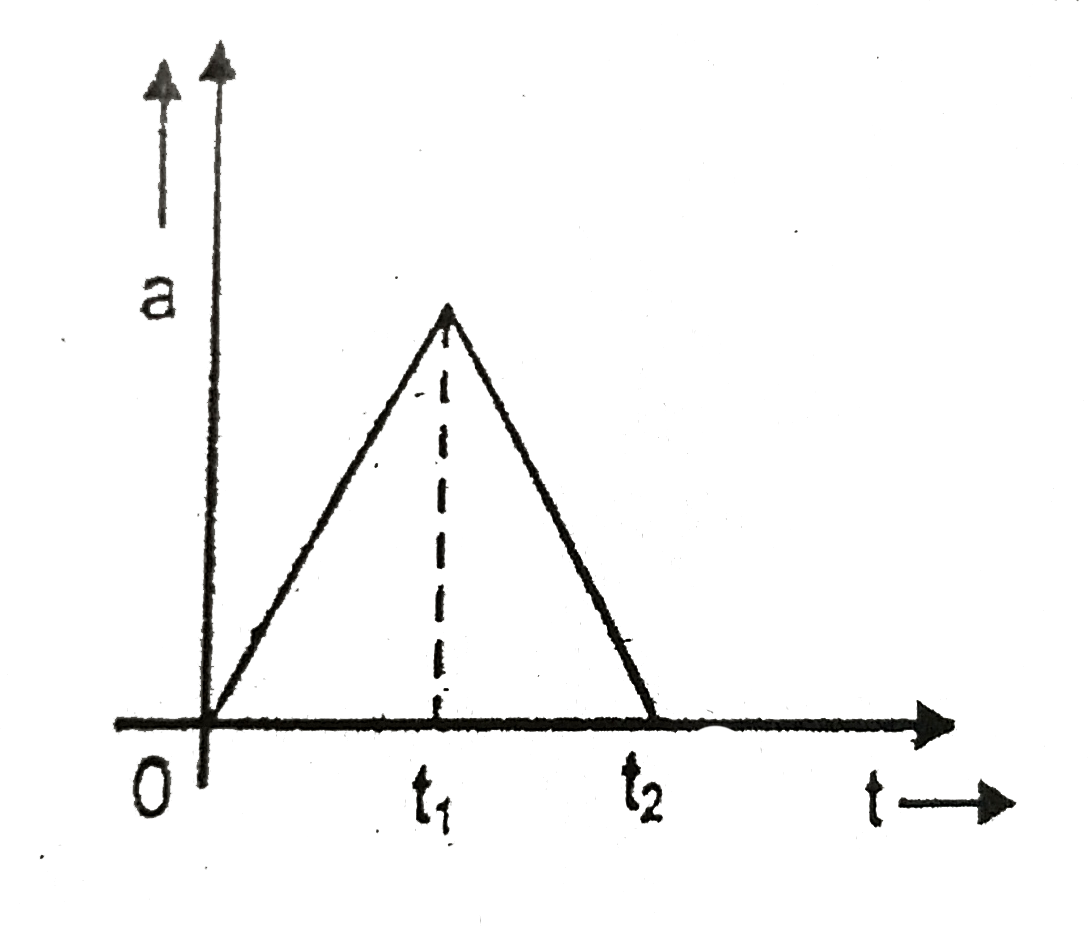
View Solution

