According to Einstein's photoelectric equation, the plot of the maximum kinetic energy of the emitted photoelectrons from a metal versus frequency of the incident radiation gives a straight line whose slope
depends on the intensity of incident radiation.
depends on the nature of the metal and also on the intensity of incident radiation.
is same for all metals and independent of the intensity of the incident radiation.
depends on the nature of the metal.
The correct Answer is:C
To solve the question regarding the slope of the plot of the maximum kinetic energy of emitted photoelectrons versus the frequency of incident radiation according to Einstein's photoelectric equation, we can follow these steps:
Step 1: Understand Einstein's Photoelectric Equation
Einstein's photoelectric equation is given by:
E=hν=ϕ+KE
Where:
- E is the energy of the incident photon,
- h is Planck's constant,
- ν is the frequency of the incident radiation,
- ϕ is the work function of the metal,
- KE is the maximum kinetic energy of the emitted photoelectrons.
Step 2: Rearranging the Equation
We can rearrange the equation to express the maximum kinetic energy (KE) in terms of frequency (ν):
KE=hν−ϕ
Step 3: Identify the Form of the Equation
The equation KE=hν−ϕ can be compared to the linear equation of the form y=mx+c, where:
- y is the maximum kinetic energy (KE),
- x is the frequency (ν),
- m (the slope) is h (Planck's constant),
- c (the y-intercept) is −ϕ (the negative work function).
Step 4: Determine the Slope
From the rearranged equation, we see that the slope of the line (when plotting KE against ν) is equal to Planck's constant h.
Step 5: Conclusion
Thus, the slope of the graph represents Planck's constant (h).
Final Answer
The slope of the plot of the maximum kinetic energy of the emitted photoelectrons versus the frequency of the incident radiation is equal to Planck's constant h.
---
Einstein's photoelectric equation is given by:
- E is the energy of the incident photon,
- h is Planck's constant,
- ν is the frequency of the incident radiation,
- ϕ is the work function of the metal,
- KE is the maximum kinetic energy of the emitted photoelectrons.
We can rearrange the equation to express the maximum kinetic energy (KE) in terms of frequency (ν):
The equation KE=hν−ϕ can be compared to the linear equation of the form y=mx+c, where:
- y is the maximum kinetic energy (KE),
- x is the frequency (ν),
- m (the slope) is h (Planck's constant),
- c (the y-intercept) is −ϕ (the negative work function).
From the rearranged equation, we see that the slope of the line (when plotting KE against ν) is equal to Planck's constant h.
Thus, the slope of the graph represents Planck's constant (h).
The slope of the plot of the maximum kinetic energy of the emitted photoelectrons versus the frequency of the incident radiation is equal to Planck's constant h.
Topper's Solved these Questions
- BOOK - NCERT FINGERTPS ENGLISHCHAPTER - DUAL NATURE OF RADIATION AND MATTER EXERCISE - PARTICLE NATURE OF LIGHT : THE PHOTON19videos
DUAL NATURE OF RADIATION AND MATTER
- BOOK - NCERT FINGERTPS ENGLISHCHAPTER - DUAL NATURE OF RADIATION AND MATTER EXERCISE - WAVE NATURE OF MATTER37videos
DUAL NATURE OF RADIATION AND MATTER
- BOOK - NCERT FINGERTPS ENGLISHCHAPTER - DUAL NATURE OF RADIATION AND MATTER EXERCISE - EXPERIMENTAL STUDY OF PHOTOELECTRIC EFFECT11videos
DUAL NATURE OF RADIATION AND MATTER
- BOOK - NCERT FINGERTPS ENGLISHCHAPTER - CURRENT ELECTRICITYEXERCISE - Assertion And Reason15videos
CURRENT ELECTRICITY
- BOOK - NCERT FINGERTPS ENGLISHCHAPTER - ELECTRIC CHARGES AND FIELDSEXERCISE - Assertion And Reason15videos
ELECTRIC CHARGES AND FIELDS
Similar Questions
Knowledge Check
- Question 1 - Select One
According to Einstein's photoelectric equation , the graph between the kinetic energy of photoelectrons ejected and the frequency of incident radiation is
A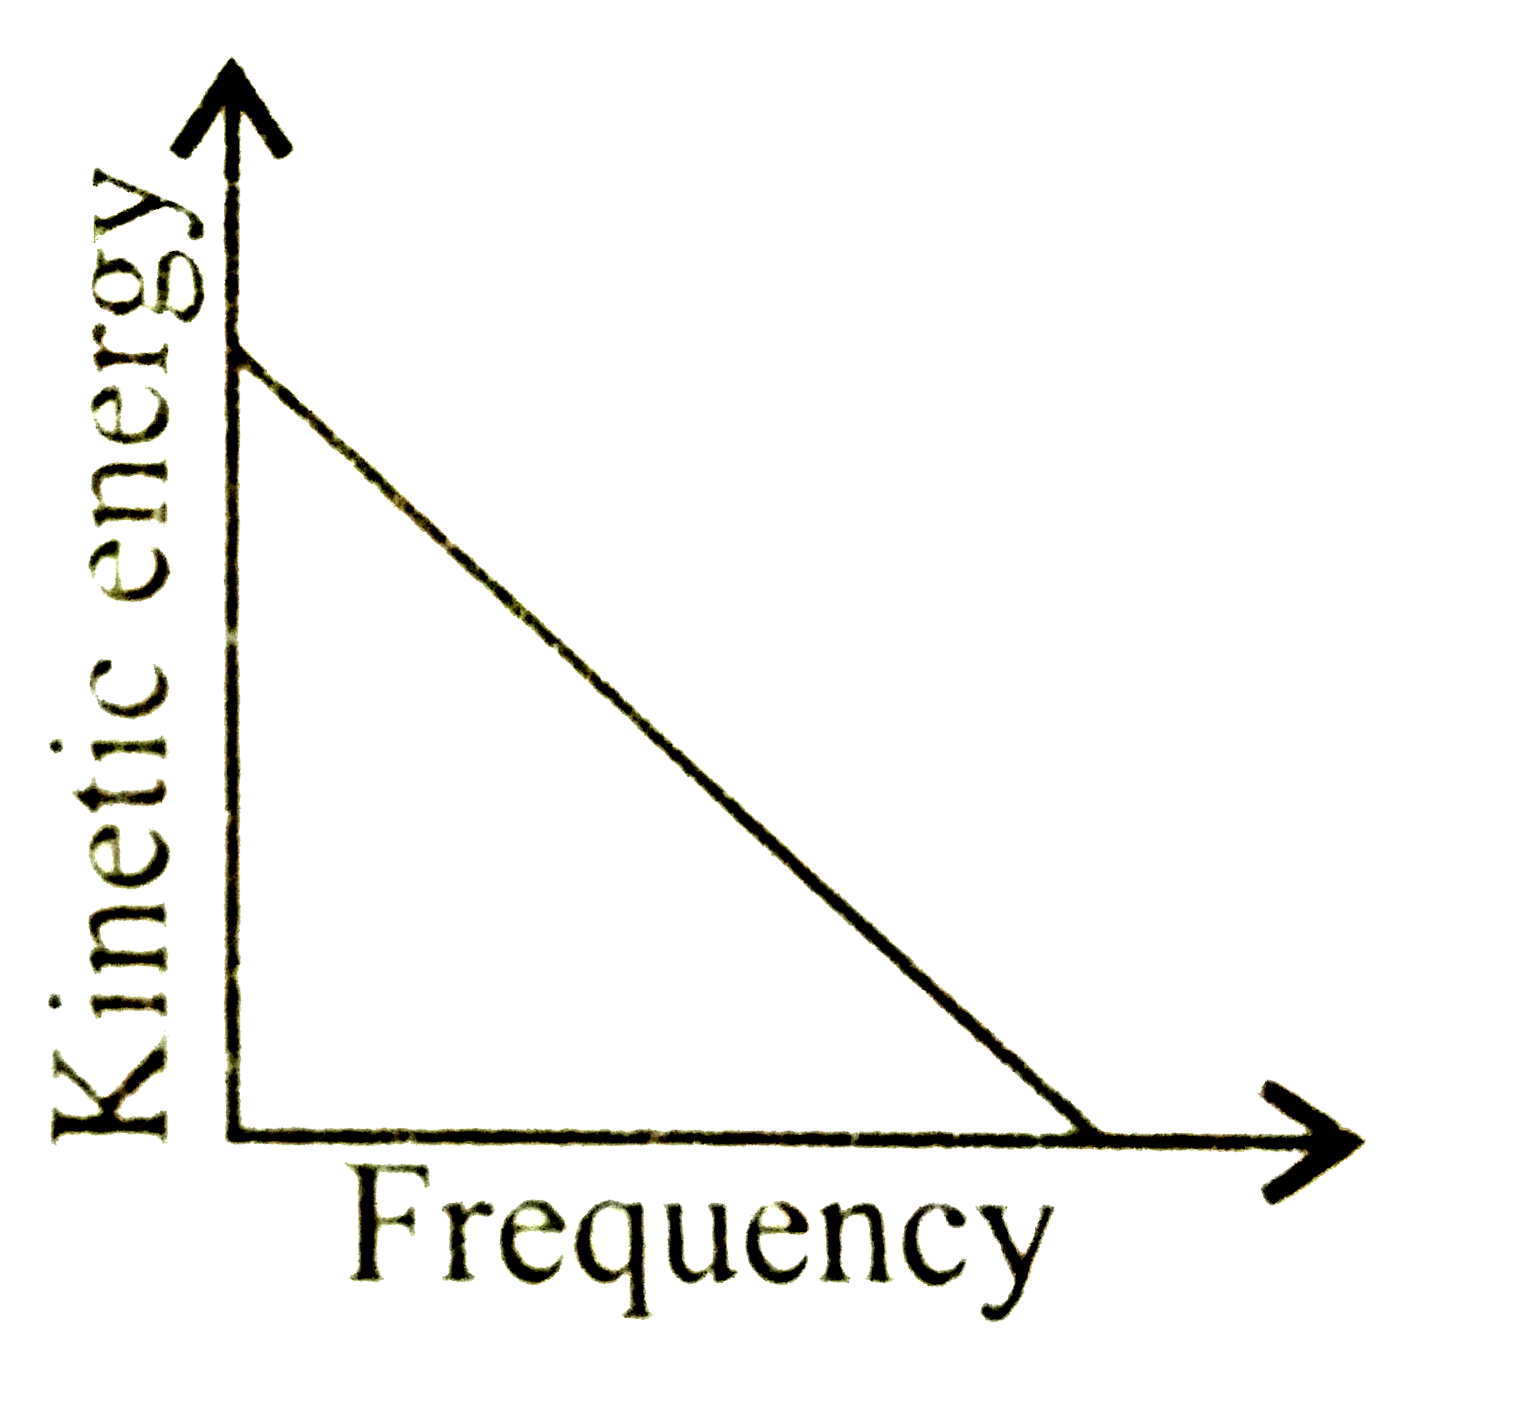 B
B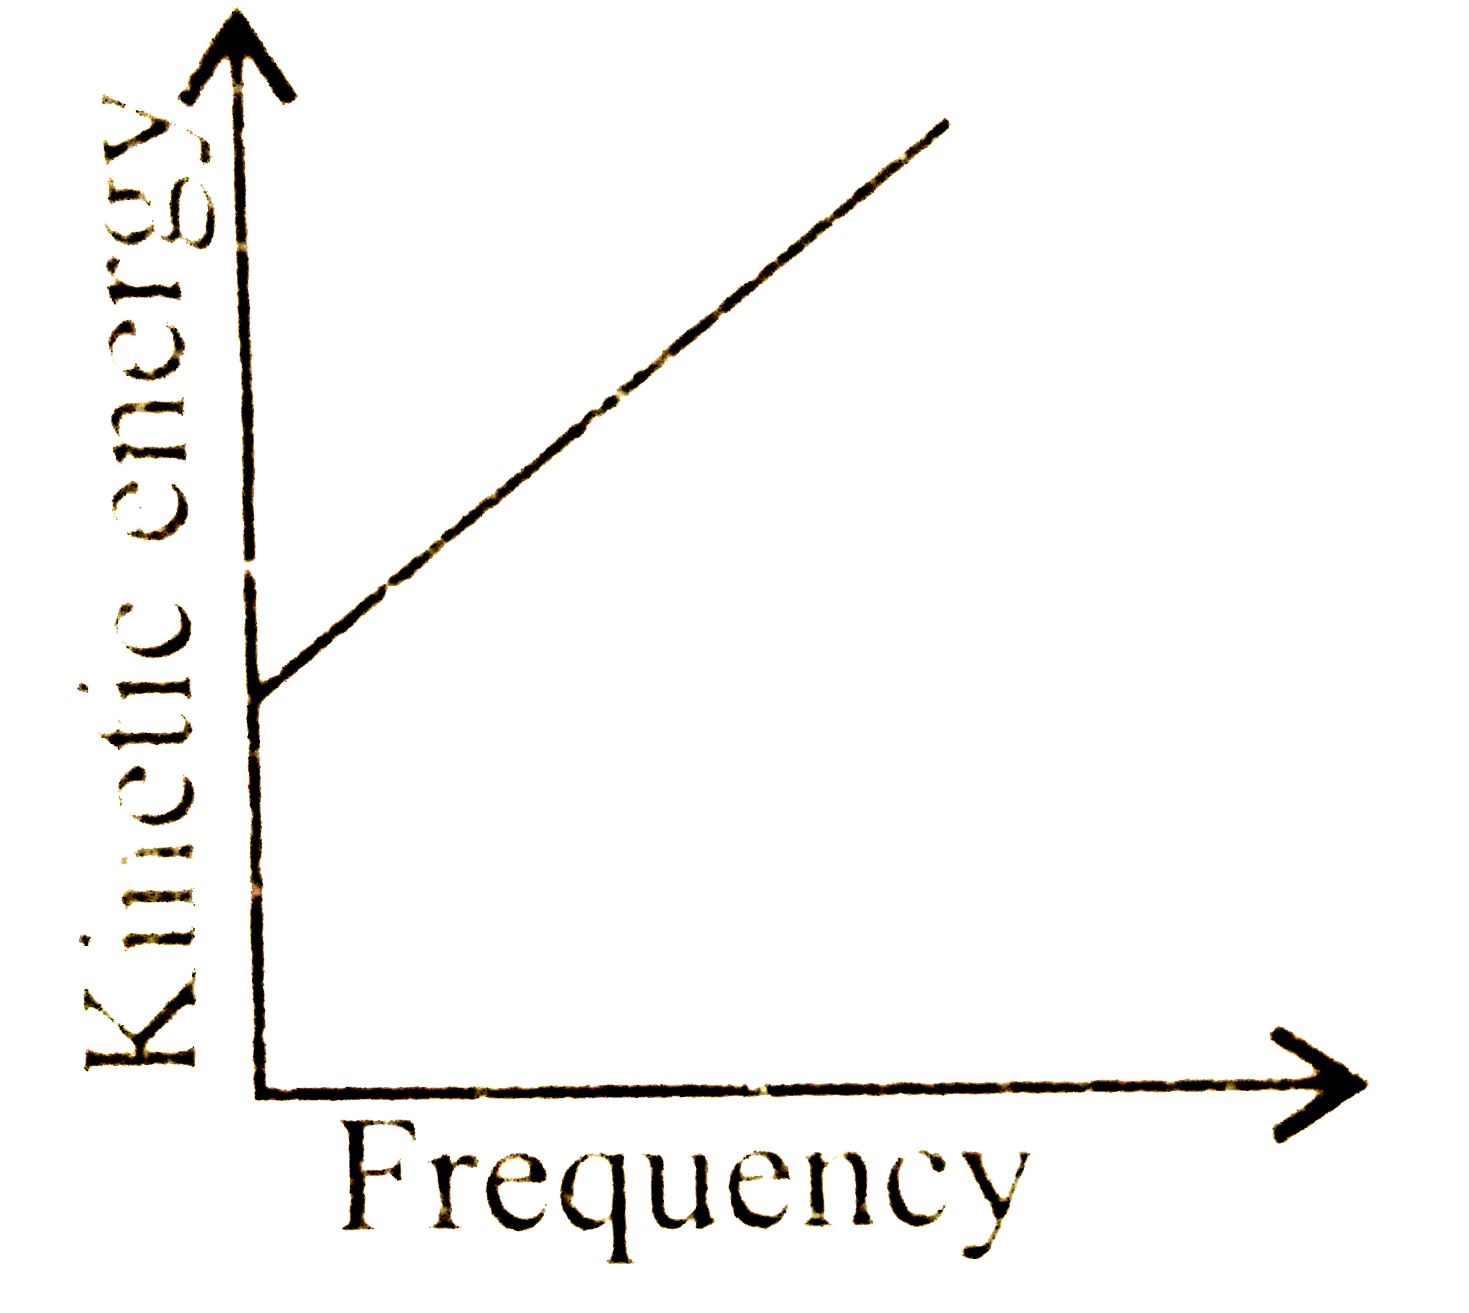 C
C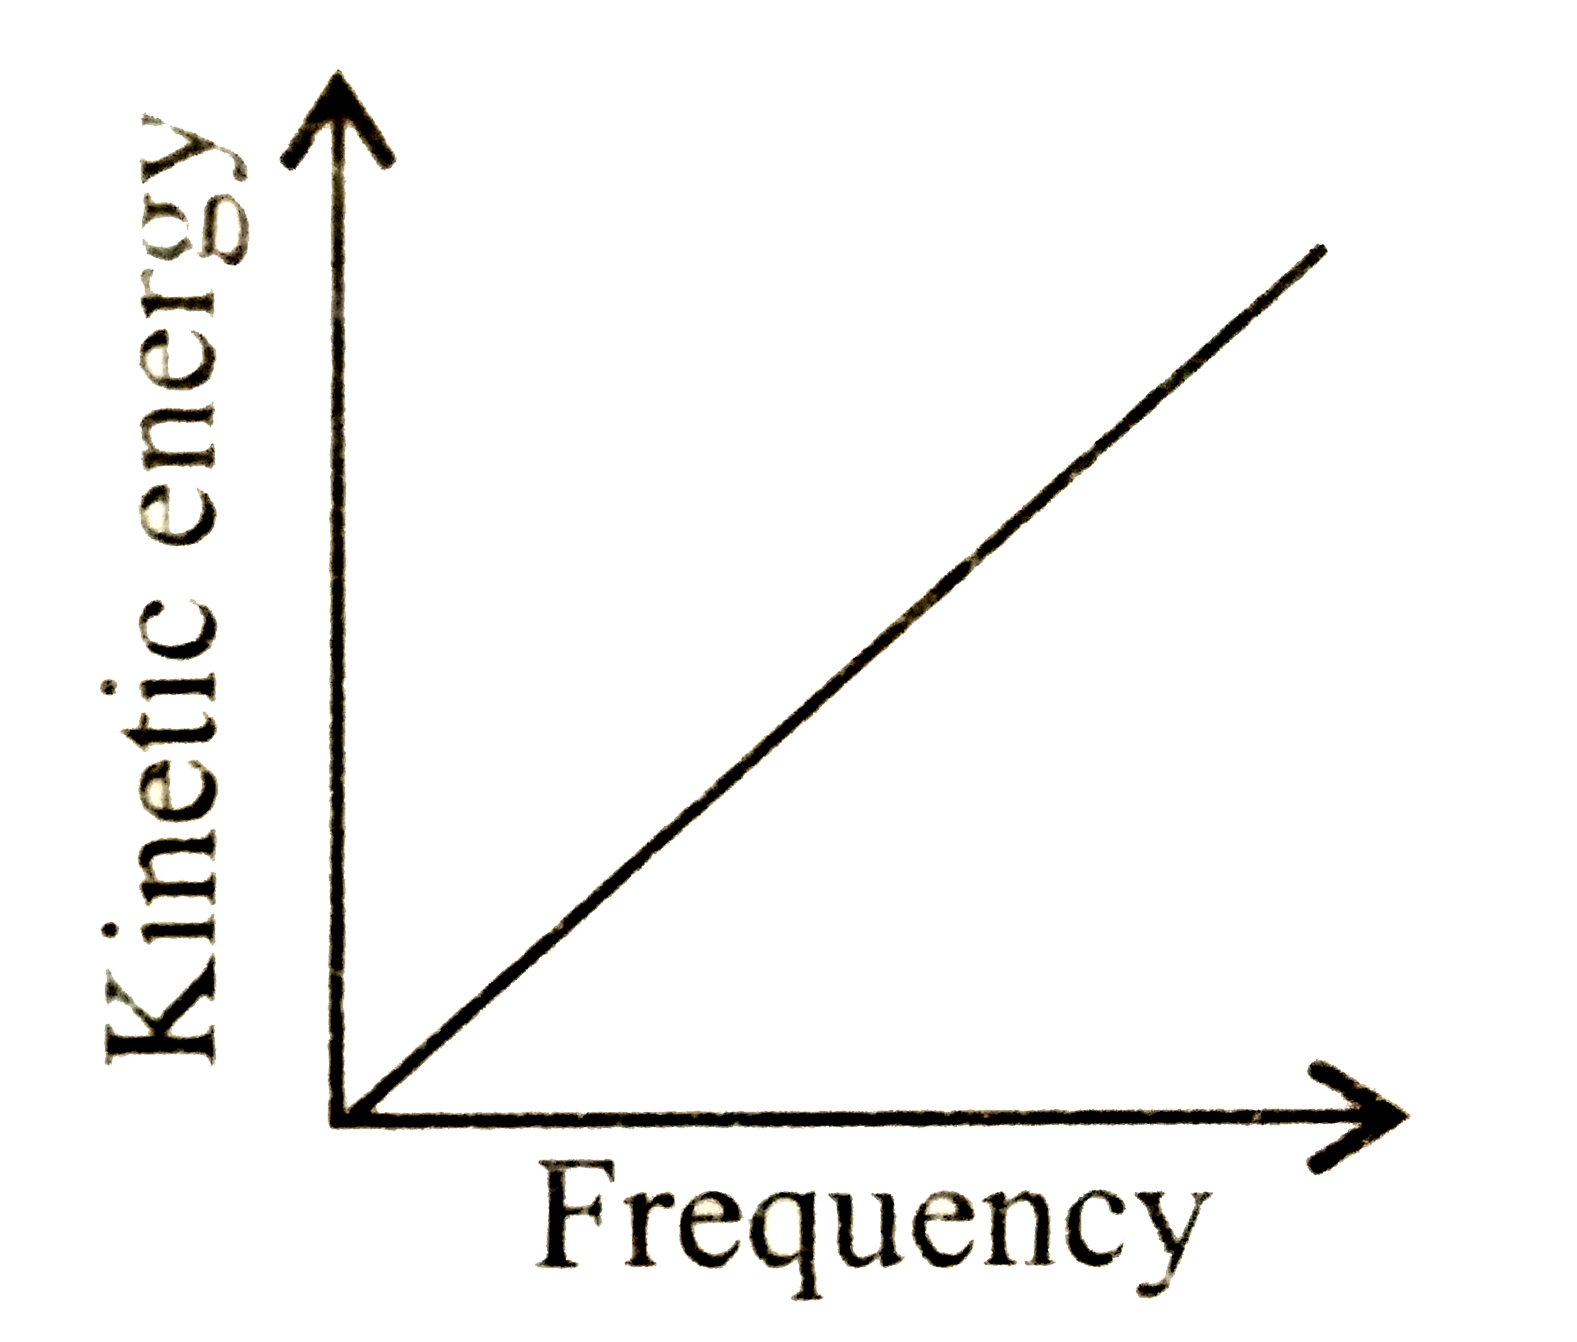 D
D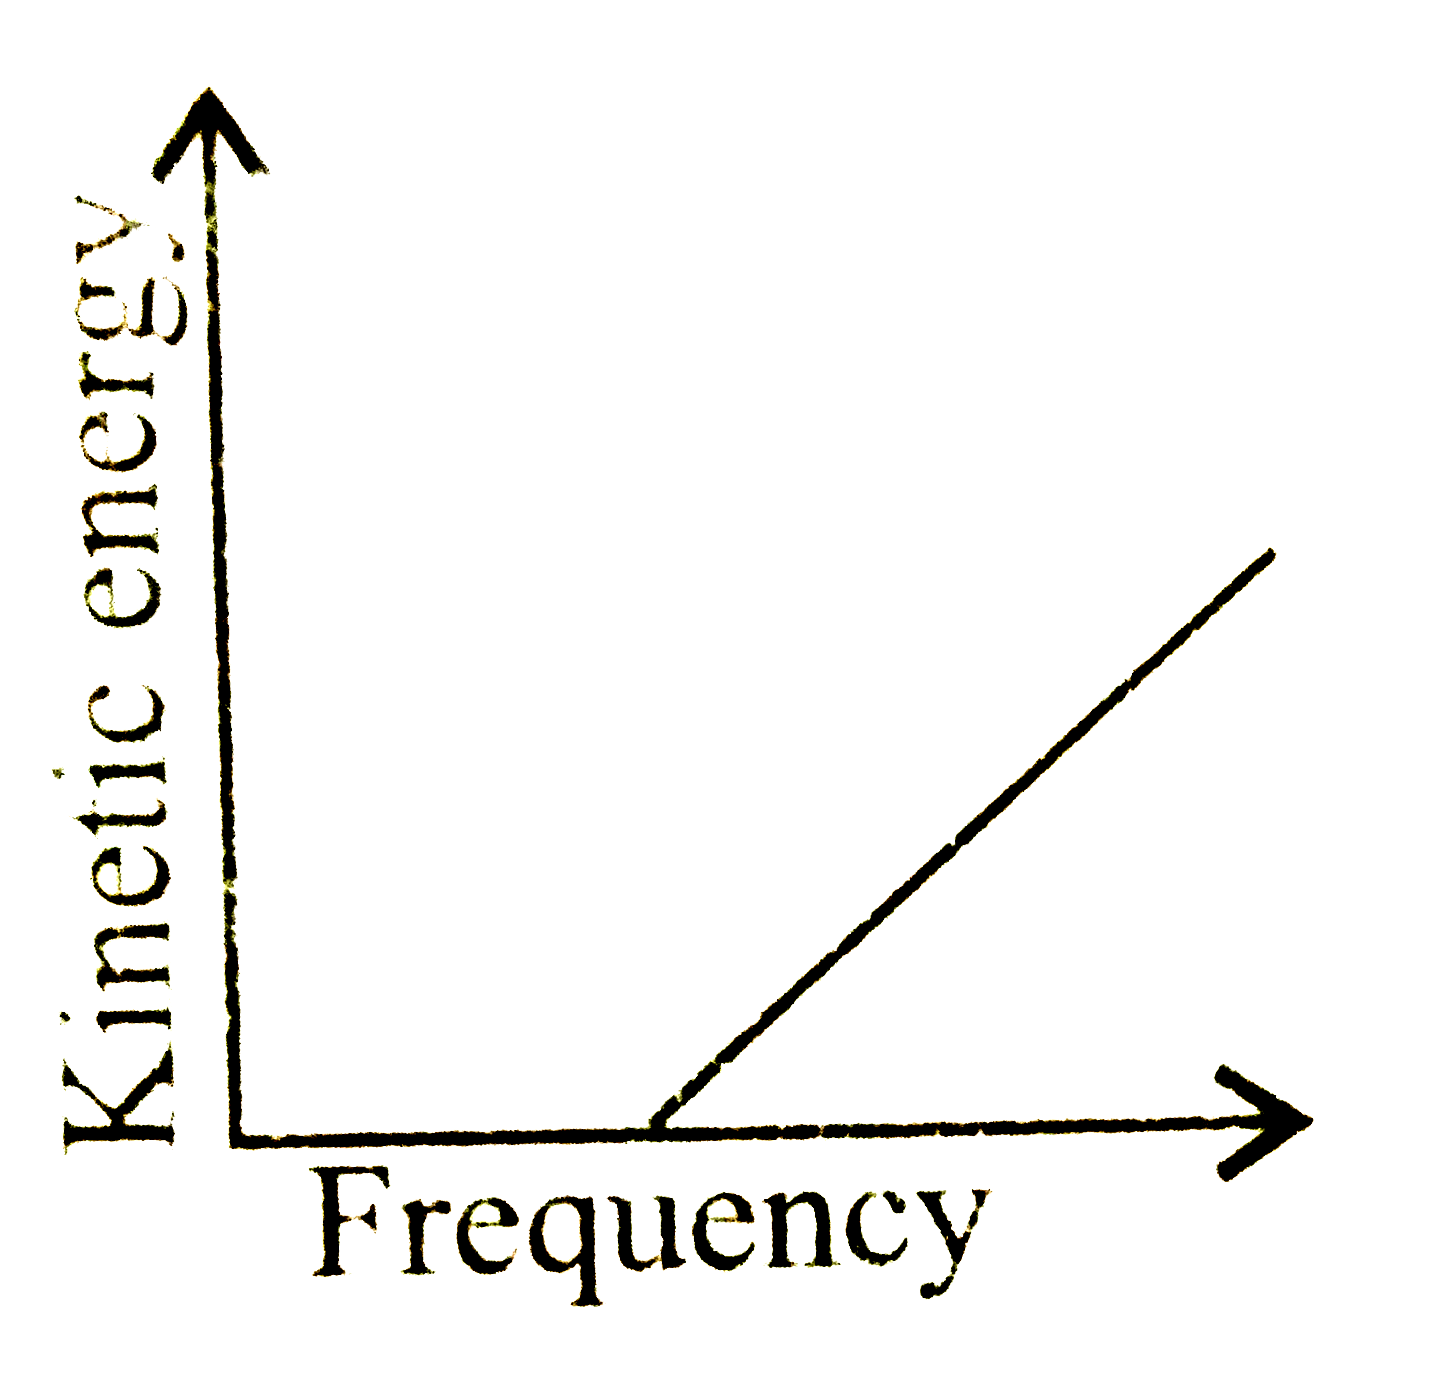
In an experiment of photo-electric effect, the graph of maximum kinetic energy Ek of the emitted photoelectrons versus the frequency v of the incident light is a straight line AB as shown in figure below :
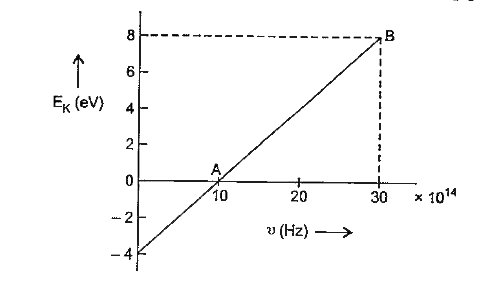
Threshold frequency of the metal.View SolutionIn an experiment of photo-electric effect, the graph of maximum kinetic energy Ek of the emitted photoelectrons versus the frequency v of the incident light is a straight line AB as shown in figure below :
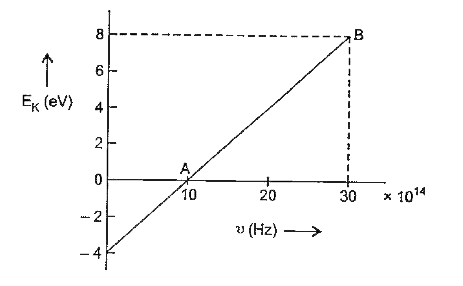
Work function of the metal.View SolutionIn an experiment of photo-electric effect, the graph of maximum kinetic energy Ek of the emitted photoelectrons versus the frequency v of the incident light is a straight line AB as shown in figure below :
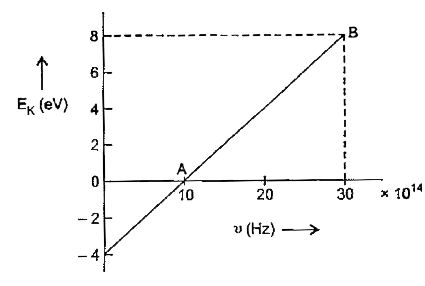
Stopping potential for the photoelectrons emitted by the light of frequency
v=30×1014HzView SolutionIn an experiment of photoelectric effect, the graph of maximum kinetic energy EK of the emitted photoelectrons versus the frequency v of the incident light is a straight line AB as shown in Figure below:
Find : (i) Threshold frequency of the metal.
(ii) work function of the metal
(iii) Stopping potential for the photoelectrons emitted by the light of frequency v=30×1014 Hz.View SolutionFor the photoelectric effect, the maximum kinetic energy Ek of the emitted photoelectrons is plotted against the frequency of the incident photons as shown in the figure. The slope of the curve gives
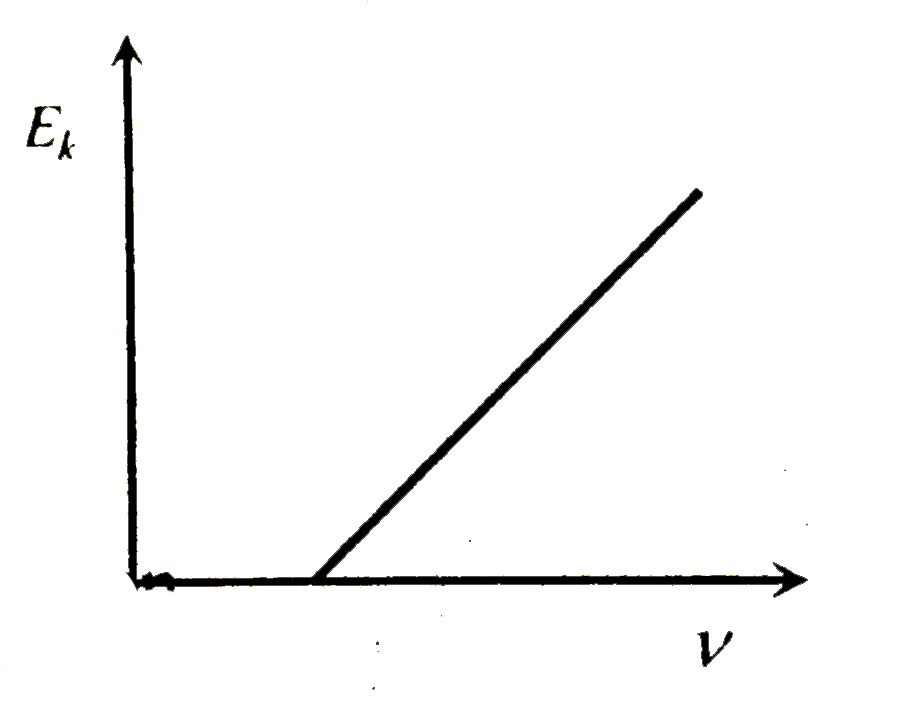 View Solution
If the frequency of light in a photoelectric experiment is double then maximum kinetic energy of photoelectron
View Solution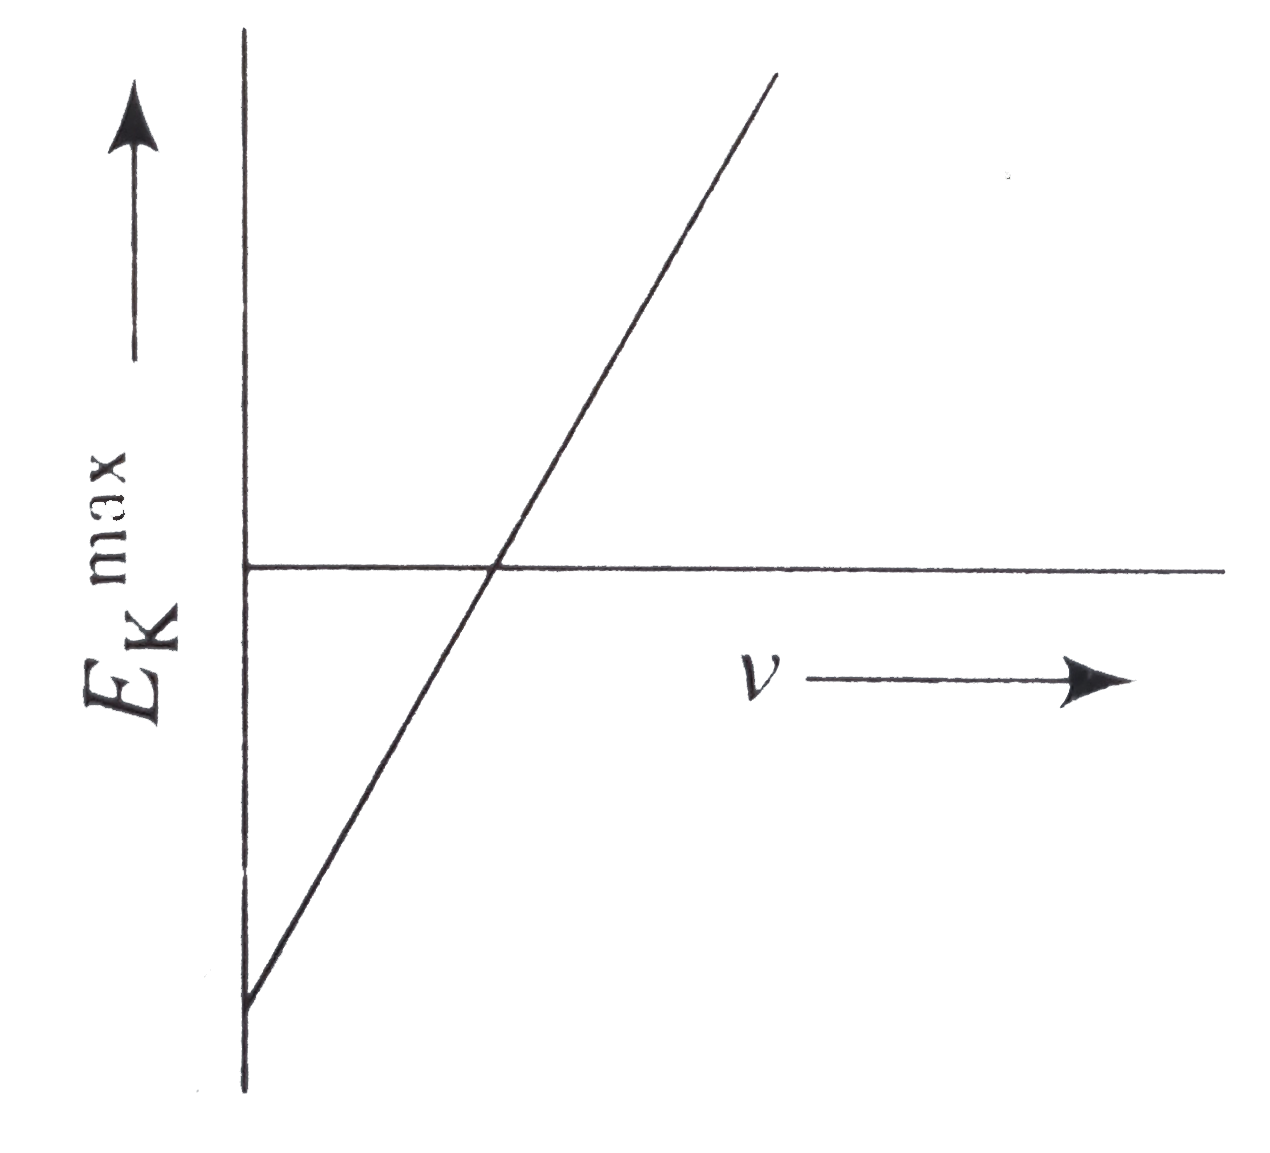
The maximum kinetic energy of the emitted photoelectrons against frequency υ of incident radiation is plotted as shown in Fig. This graph help us in determining the following physical quantitiesView Solution

