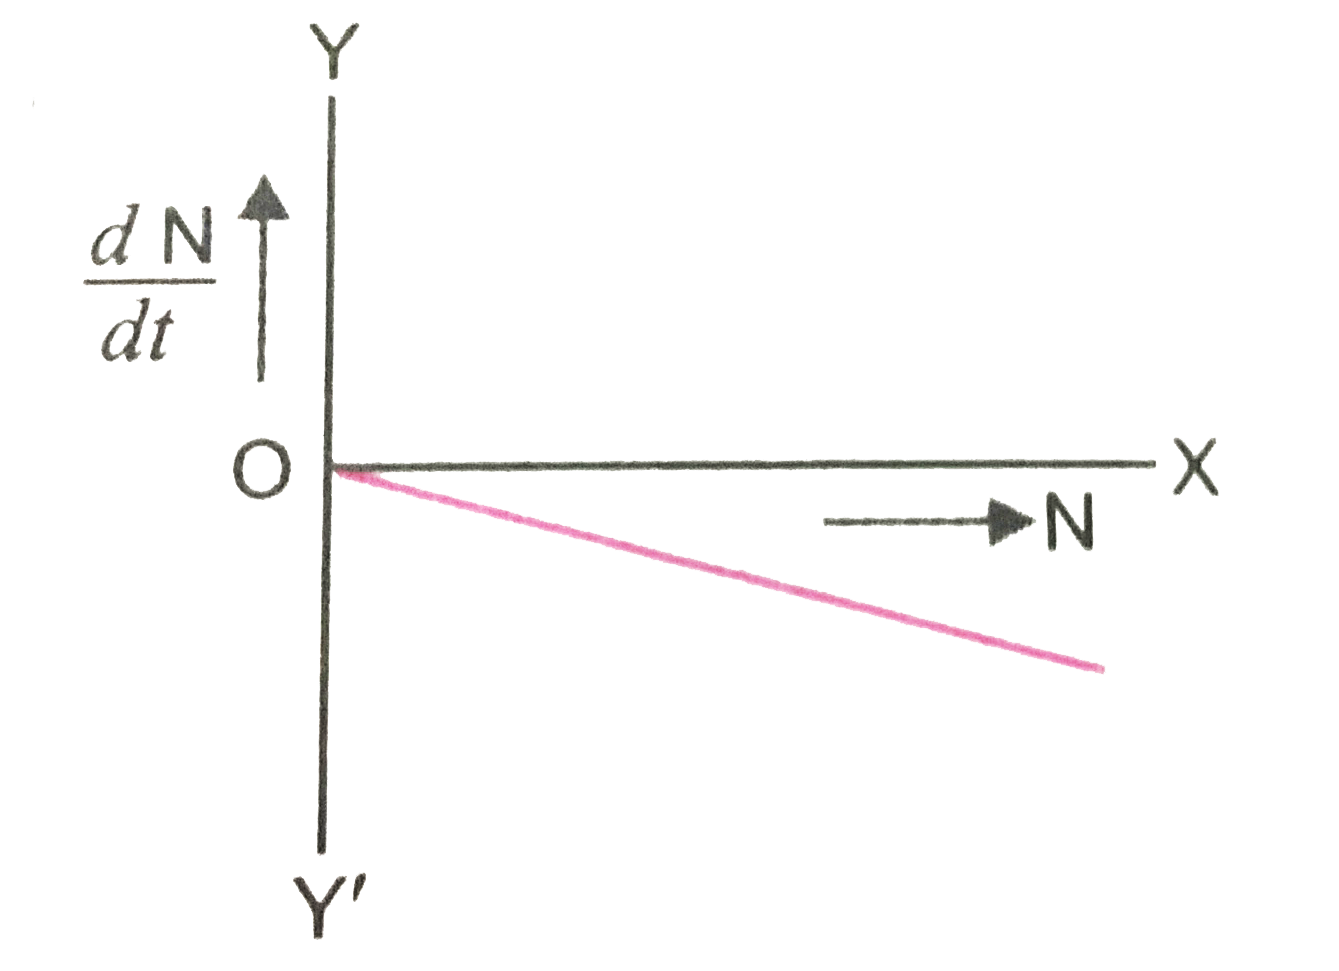
Draw a graph showing the variation of decay rate with number of active nuclei.
As −dNdt=λNandλ is constant for a given radioactive material, therefore graph between N and dNdt is a straight line as shown in fig.
Similar Questions
Knowledge Check
The graph showing the variation of decay rate with number of nuclei is:
A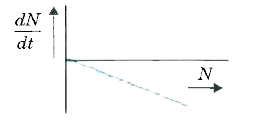 B
B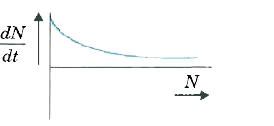 C
C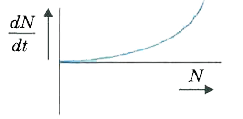 D
D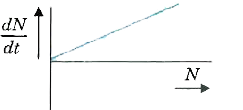
Define the terms resistivity and conductivity and state their S. I. units. Draw a graph showing the variation of resistivity with temperature for a typical semiconductor.
View SolutionDraw a graph showing the variation of binding energy per nucleon with mass number of different nuclei. State two inferences from this graph.
View SolutionDraw a graph showing the variation of resistivity with temperature for nichrome. Which property of nichrome is used to make standard resistance coils?
View SolutionDraw a graph showing the variation of stopping potential with frequency of the incident on a metal plate. How can the value of Planck's constant be determined from this graph?
View SolutionA radioactive species has decay constant of λ=10−2s−1. Probability that a particular nucleus decays in time t is p. Draw a graph showing variation of ρ with t. Assume that the selected nucleus survives till last.
View SolutionDraw graph showing variation of voltage and current with time over one cycle of ac.for X
View SolutionDraw the graph showing the variation of binding energy per nucleon with mass number. Give the reason for the decrease of binding energy per nucleon for nuclei with high mass numbers.
View Solution
