Draw a V-I graph for a conductor at two different temperatures. What conclusion do you draw from your graph for the variation of resistance of the conductor with temperature ?
Step-by-Step Solution:
1. Understanding the V-I Graph:
- A V-I graph (Voltage vs. Current graph) shows the relationship between voltage (V) across a conductor and the current (I) flowing through it. According to Ohm's Law, the relationship is linear, expressed as V = I * R, where R is the resistance.
2. Drawing the Graph:
- Draw two straight lines on the graph.
- Label the x-axis as Current (I) and the y-axis as Voltage (V).
- Draw one line for temperature T1 and another line for temperature T2.
- Ensure that the line for T1 is steeper than the line for T2, indicating that the resistance at T1 is greater than at T2.
3. Identifying the Slopes:
- The slope of each line represents the resistance (R) of the conductor at the respective temperatures.
- For the line at temperature T1, the slope can be represented as tan(θ1), and for T2, it is tan(θ2).
4. Comparing the Slopes:
- Since the line for T1 is steeper, we can conclude that tan(θ1) > tan(θ2).
- This implies that the resistance at temperature T1 (R1) is greater than the resistance at temperature T2 (R2).
5. Conclusion:
- From the graph, we can conclude that as the temperature of the conductor increases, the resistance also increases.
- Therefore, R1 > R2, which means that the resistance of the conductor increases with an increase in temperature.
Conclusion:
The V-I graph illustrates that the resistance of a conductor increases with temperature. This is a typical behavior for most conductors, indicating that as temperature rises, the atoms in the conductor vibrate more, leading to more collisions between charge carriers and thus higher resistance.
- A V-I graph (Voltage vs. Current graph) shows the relationship between voltage (V) across a conductor and the current (I) flowing through it. According to Ohm's Law, the relationship is linear, expressed as V = I * R, where R is the resistance.
- Draw two straight lines on the graph.
- Label the x-axis as Current (I) and the y-axis as Voltage (V).
- Draw one line for temperature T1 and another line for temperature T2.
- Ensure that the line for T1 is steeper than the line for T2, indicating that the resistance at T1 is greater than at T2.
- The slope of each line represents the resistance (R) of the conductor at the respective temperatures.
- For the line at temperature T1, the slope can be represented as tan(θ1), and for T2, it is tan(θ2).
- Since the line for T1 is steeper, we can conclude that tan(θ1) > tan(θ2).
- This implies that the resistance at temperature T1 (R1) is greater than the resistance at temperature T2 (R2).
- From the graph, we can conclude that as the temperature of the conductor increases, the resistance also increases.
- Therefore, R1 > R2, which means that the resistance of the conductor increases with an increase in temperature.
The V-I graph illustrates that the resistance of a conductor increases with temperature. This is a typical behavior for most conductors, indicating that as temperature rises, the atoms in the conductor vibrate more, leading to more collisions between charge carriers and thus higher resistance.
Topper's Solved these Questions
- CURRENT ELECTRICITYBOOK - ICSECHAPTER - CURRENT ELECTRICITYEXERCISE - EXERCISE-8(A) ( MULTIPLE CHOICE TYPE)
2 Videos
- CURRENT ELECTRICITYBOOK - ICSECHAPTER - CURRENT ELECTRICITYEXERCISE - EXERCISE-8(A)(NUMERICALS )
16 Videos
- CURRENT ELECTRICITYBOOK - ICSECHAPTER - CURRENT ELECTRICITYEXERCISE - EXERCISE-8(C) NUMERICALS
35 Videos
- CALORIMETRYBOOK - ICSECHAPTER - CALORIMETRYEXERCISE - EXERCISE-11(B) (NUMERICALS)
15 Videos
- ELECTRO-MAGNETISM BOOK - ICSECHAPTER - ELECTRO-MAGNETISM EXERCISE - EXERCISE-10 (C) NUMERICALS
1 Videos
Similar Questions
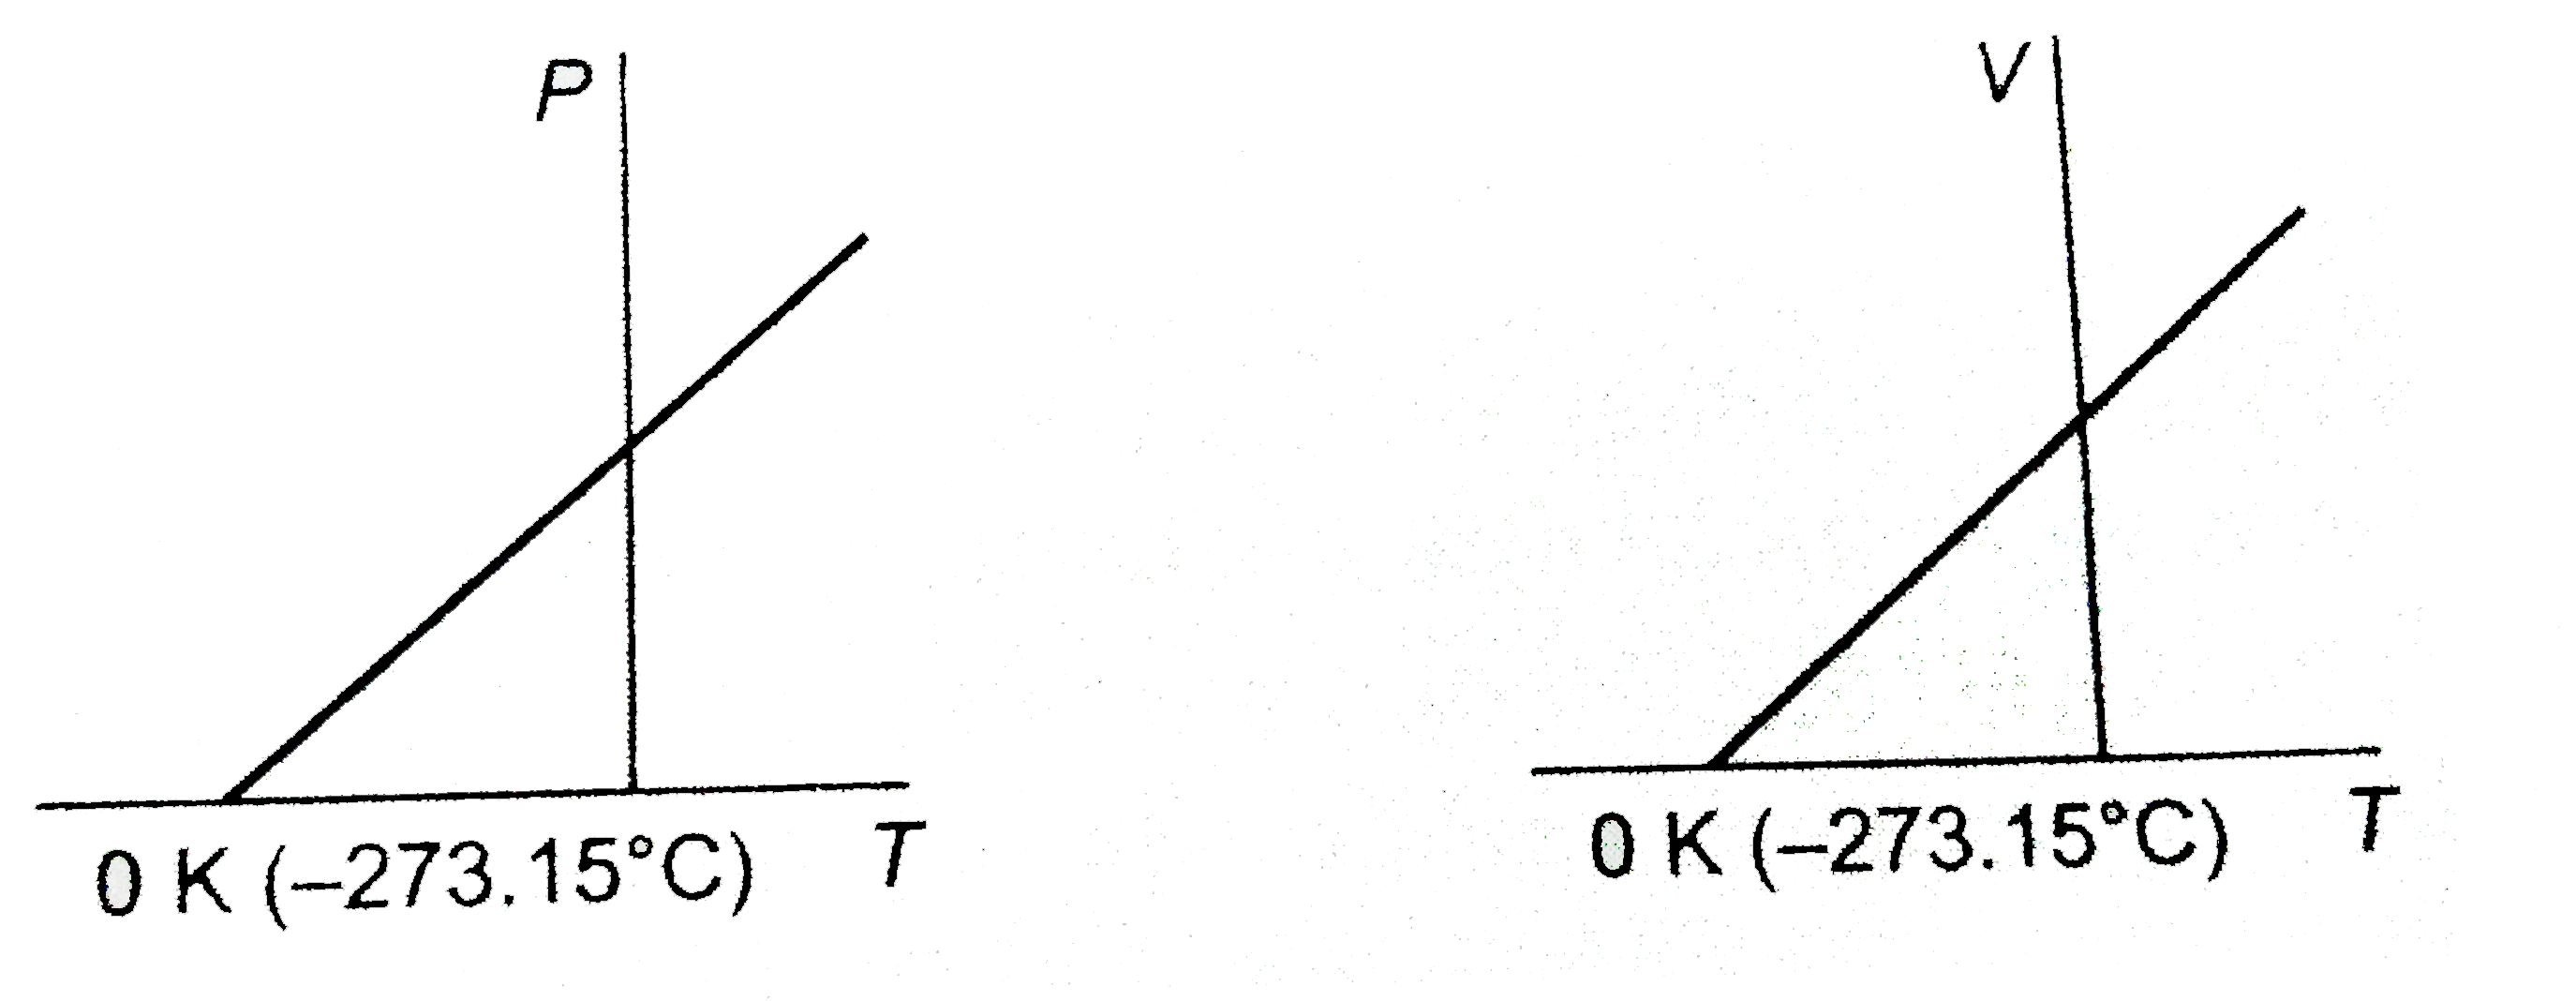
What conclusion would you draw from the following graphs for an ideal gas?

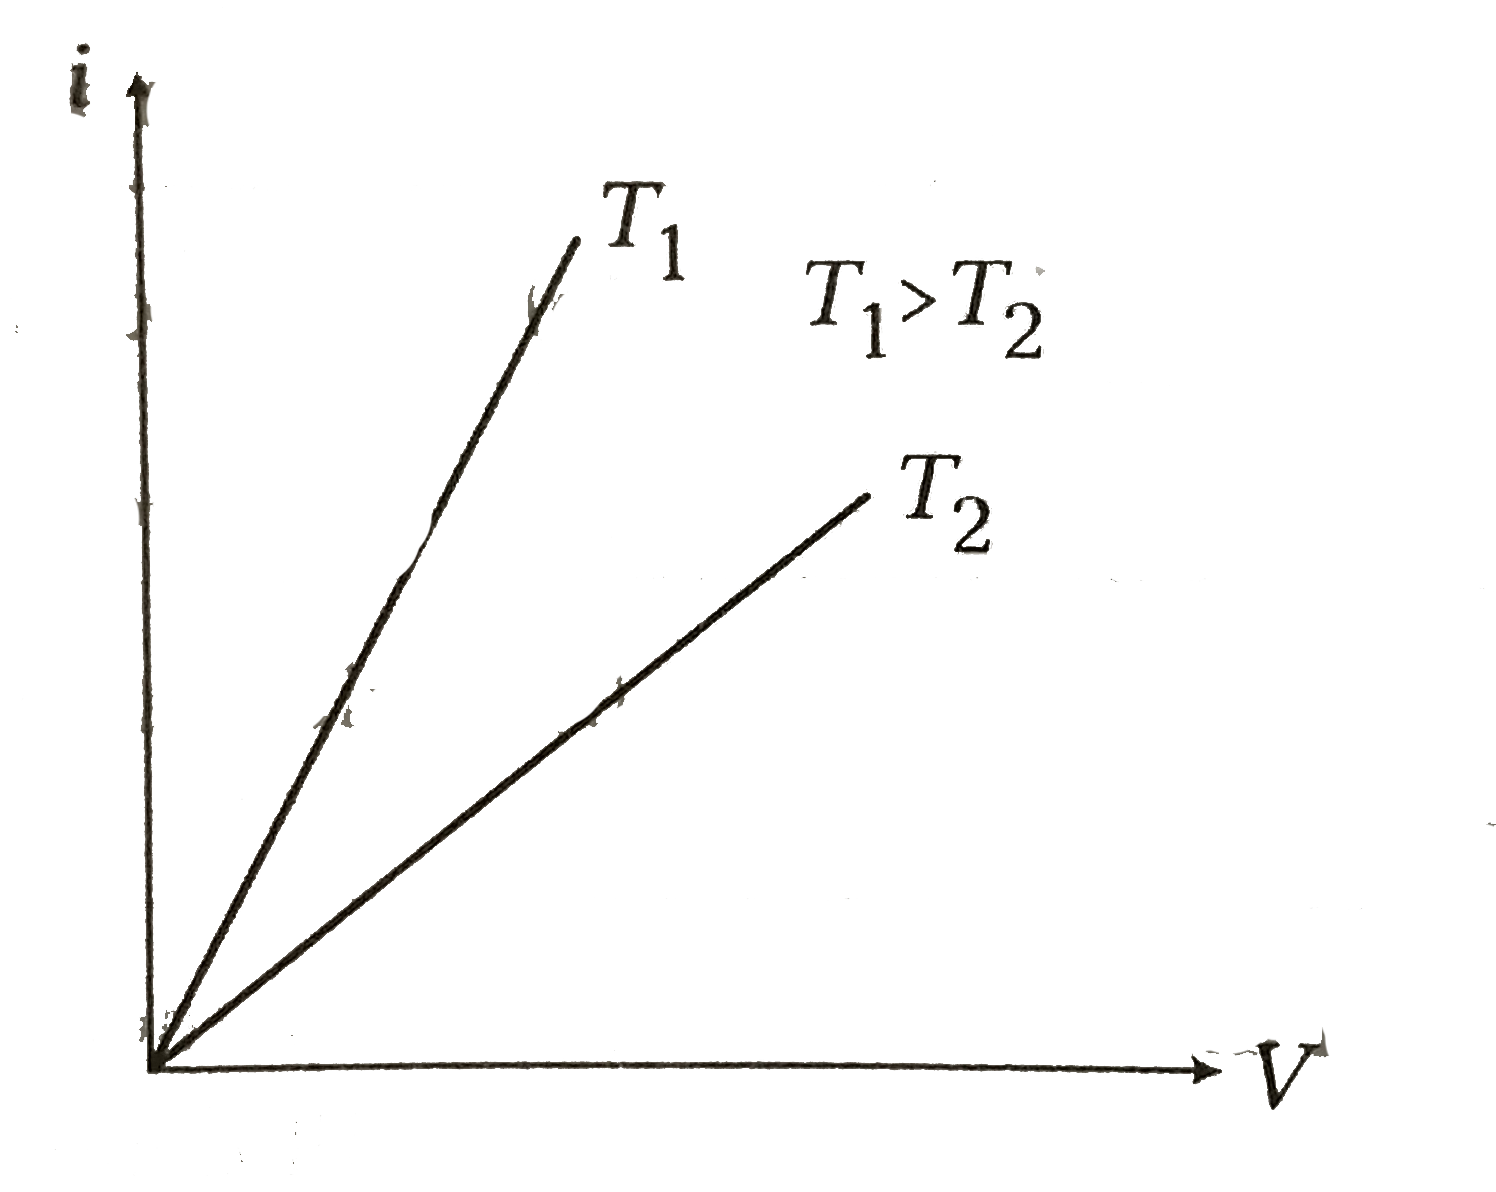
View SolutionAssertion : Current versus potential difference (i-V) graph for a conductor at two different temperatures T1 and T2 is shown in figure. Hence T1>T2.

Reason : Resistance of a conductor increases with rise in temperature.
View Solution
Knowledge Check
The voltage V and current I v graphs for a conductor at two different temperatures T1andT2 are shown in the figure. The relation between T1andT2 is
 AT1>T2BT1<T2CT1=T2DT1=1T2
Which of the following graph represents the variation of resistivity (ρ) with temperature (T) for copper?
View SolutionShow on a graph, the variation of resistivity with temperature for a typical semiconductor.
View SolutionWith reference to semi-conductors answer the following
What is the change in the resistance of the semi-conductor with increase in temperature?
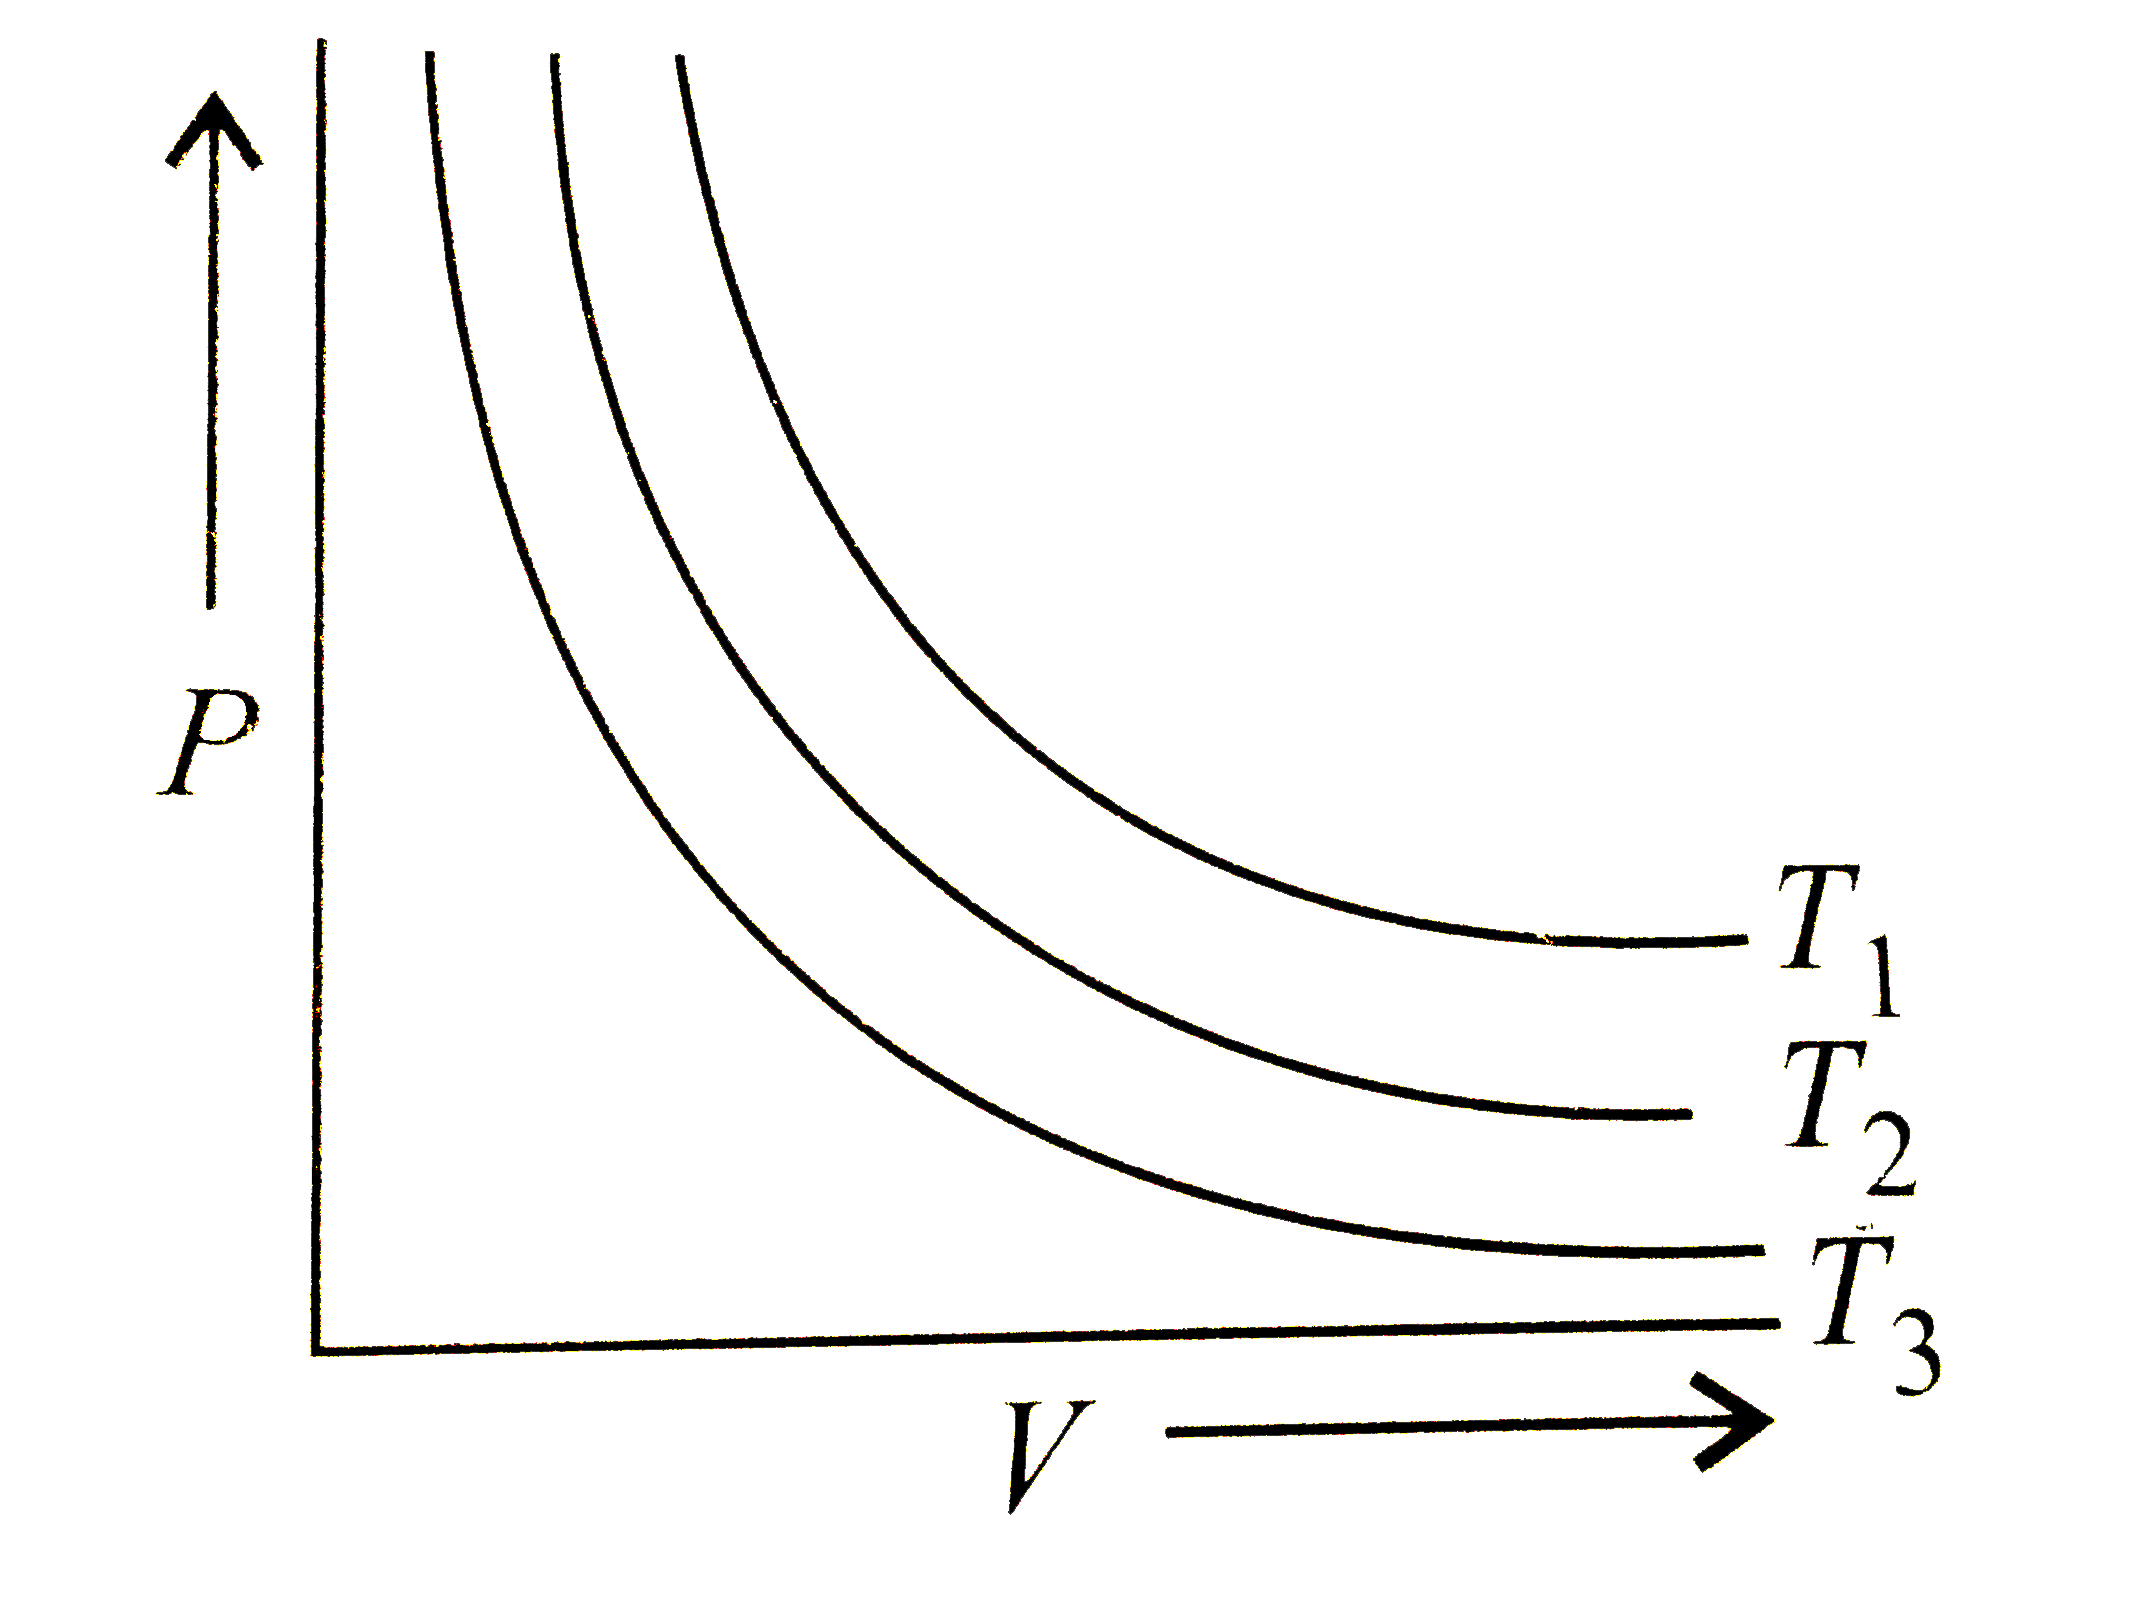
View SolutionThe graph of P vs V is given at different temperature

The correct relationship is
View SolutionDraw an 1-V graph for a linear resistor. What does its slope represent ?
View SolutionShow variation of resistivity of copper as a function of temperature in a graph.
View SolutionWhat happens to the resistivity of semi-conductors with the increase in temperature?
View Solution
