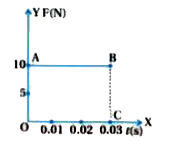
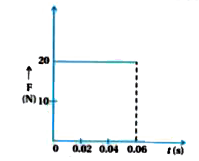
graph for a body is shown in the . What is the change in the value of momentum in the intital tie interval of 0.03 sec .
 Solution in Gujrati
or
Topper's Solved these Questions
- BOOK - KUMAR PRAKASHANCHAPTER - LAW OF MOTIONEXERCISE - SECTION-D(NCERT EXEMPLAR SOLUTIONS)42videos
LAW OF MOTION
- BOOK - KUMAR PRAKASHANCHAPTER - LAW OF MOTIONEXERCISE - SECTION -E(MULTIPLE CHOICE QUESTIONS) (MCQS)69videos
LAW OF MOTION
- BOOK - KUMAR PRAKASHANCHAPTER - LAW OF MOTIONEXERCISE - SECTION -B (NUMERICAL FROM DARPAN BASED ON TEXTBOOK)8videos
LAW OF MOTION
- BOOK - KUMAR PRAKASHANCHAPTER - GRAVITATIONEXERCISE - QUESTIONS PAPER Section - D1videos
GRAVITATION
- BOOK - KUMAR PRAKASHANCHAPTER - MACHANICAL PROPERTIES OF SOLIDS EXERCISE - QUESTION PAPER11videos
MACHANICAL PROPERTIES OF SOLIDS
Similar Questions
A ball is moving with uniform translatory motion. This means that
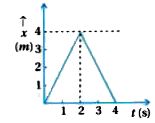
03:06View SolutionThe position (x) → time (t) graph of one dimensional motion of a body of mass 0.4 kg. What is the magnitude of impulse of force
 03:01View Solution
A soldier fires bullets, each of mass 50 g, from his automatic rifle with a velocity of 1000 m/s. If he can bear a maximum force of 200 N on his shoulder, find the number of bullets which he can fire in a second.
02:35View SolutionA spaceship is stationed on Mars. How much energy must be expended on the spaceship to launch it out of the solar system ? Mass of the spaceship = 1000 kg, mass of the sun =2×1030kg, mass of mars =6.4×10²³kg, radius of mars = 3395 km, radius of the orbit of mars =2.28×10⁸km,G=6.67×10⁻¹¹Nm2kg2
01:53View SolutionWhat is called brittle material ?
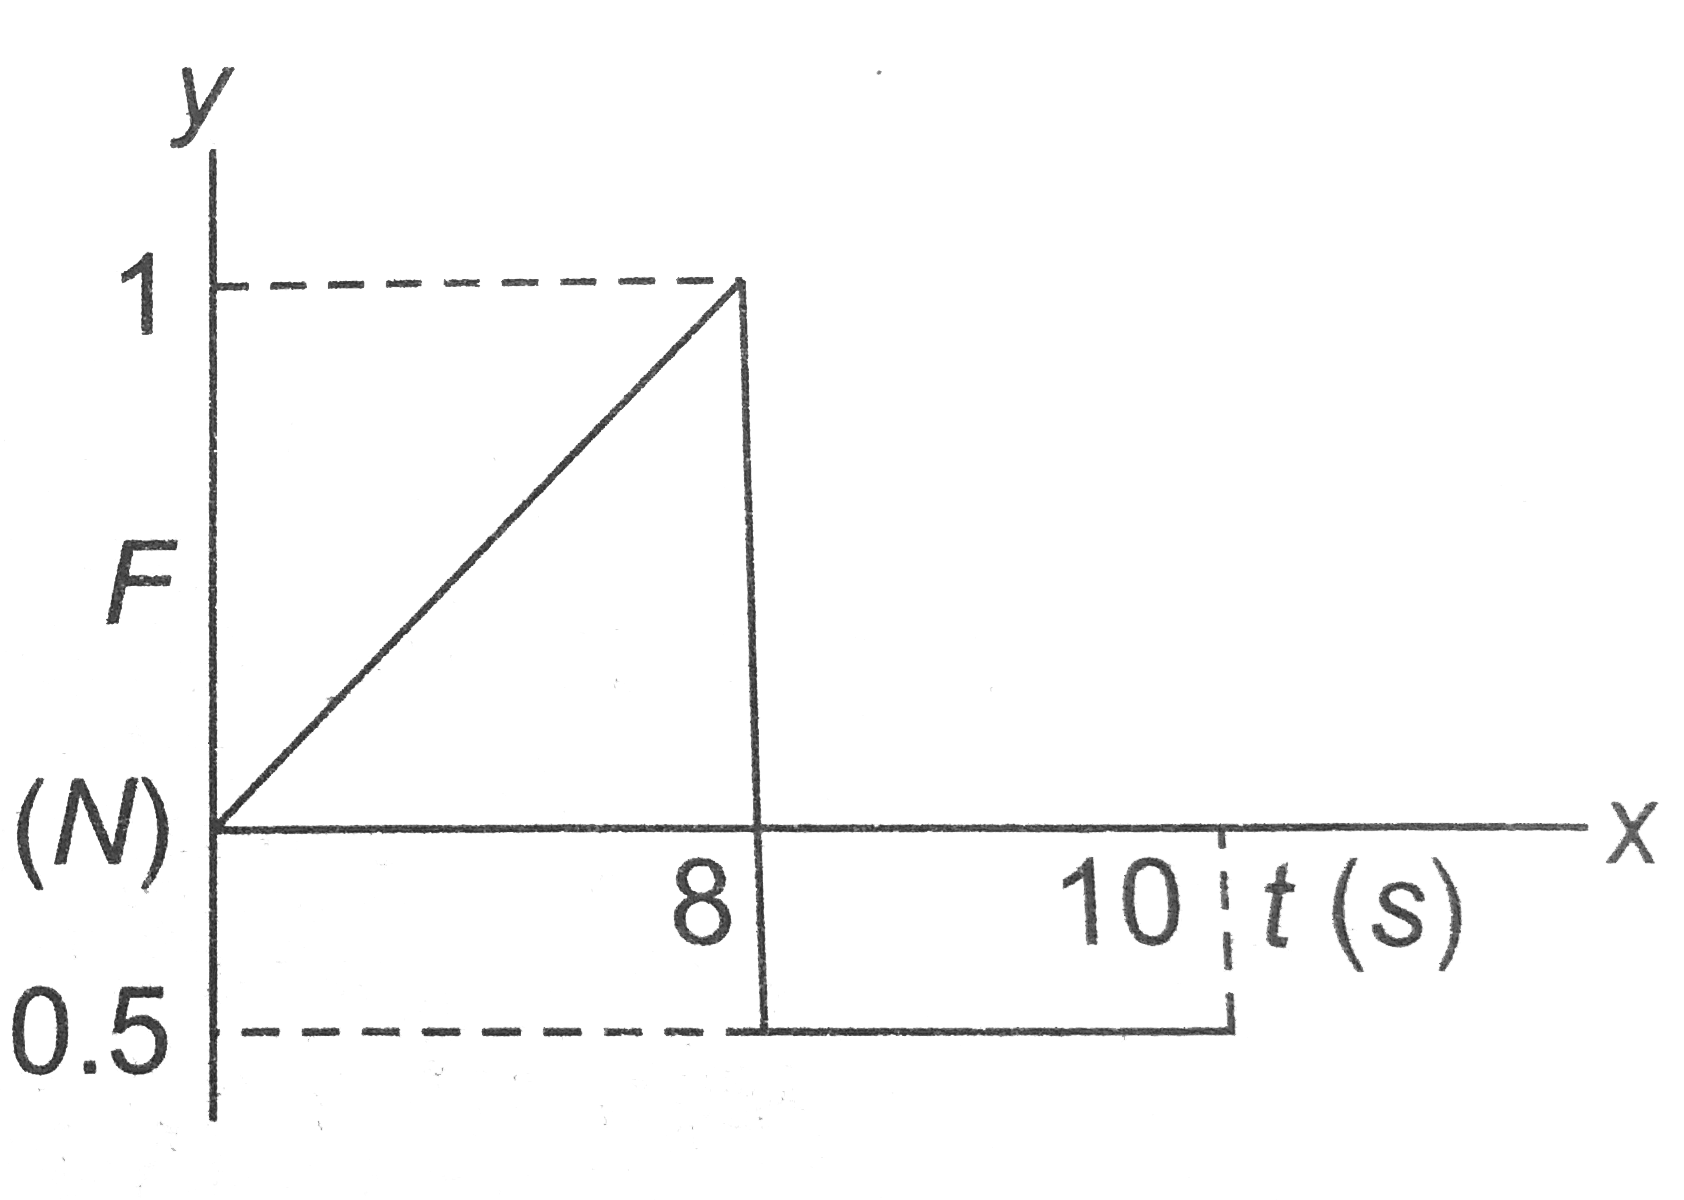
05:57View SolutionA force-time graph for the motion of a body is shown in the figure. The change in the momentum of the body between zero and 10sec is
 01:16View Solution
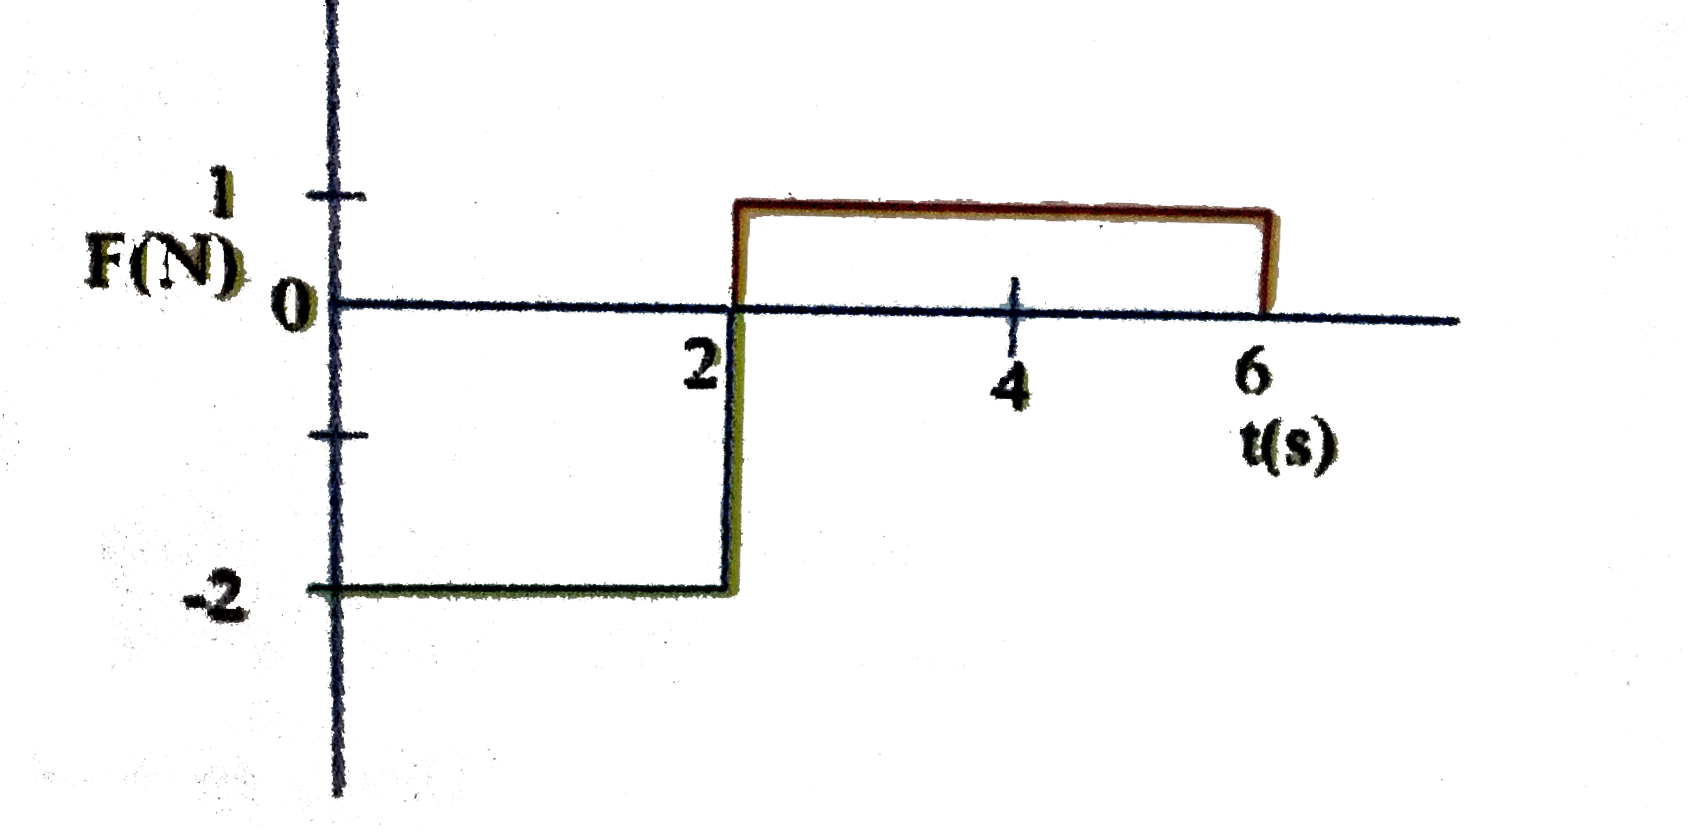
A force time graph for the motion of a body is as shown in Change in linear momentum between 0 and 6s is
 .01:36View Solution
The acceleration time graph of a body moving in a straight is shown in figure.
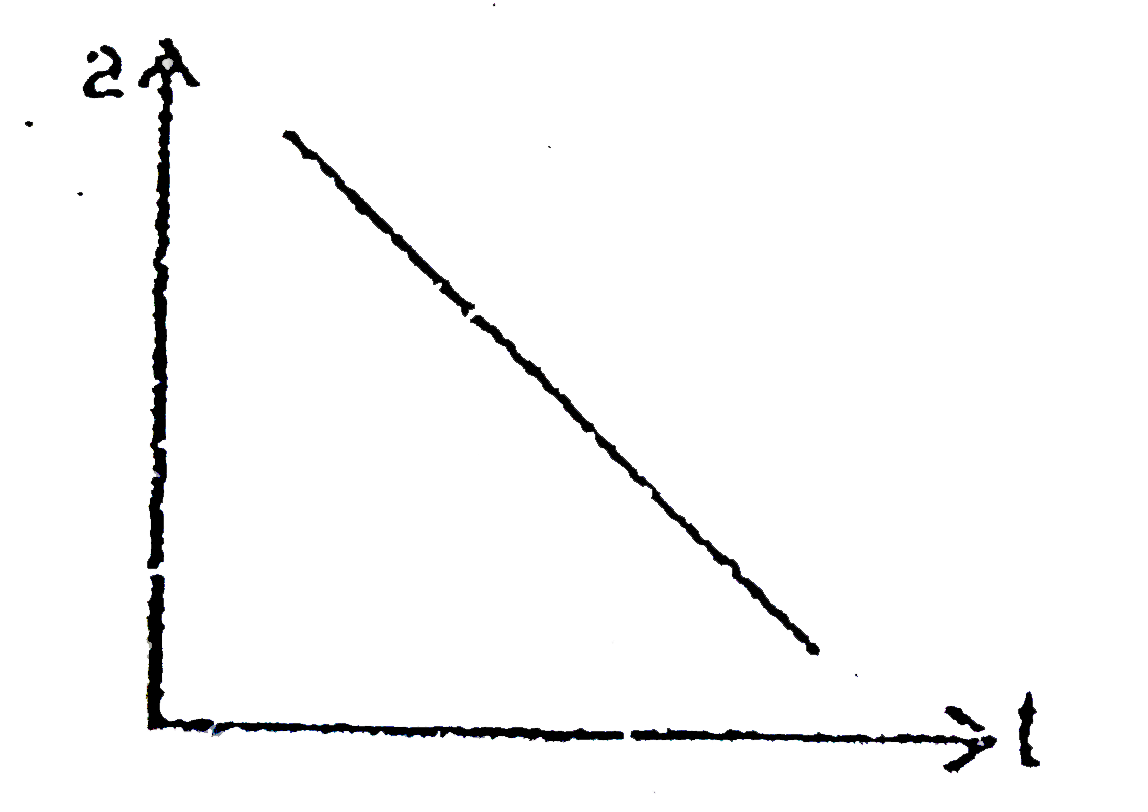
Assertion :− Velocity of the body is continously increasing over the time interval shown.
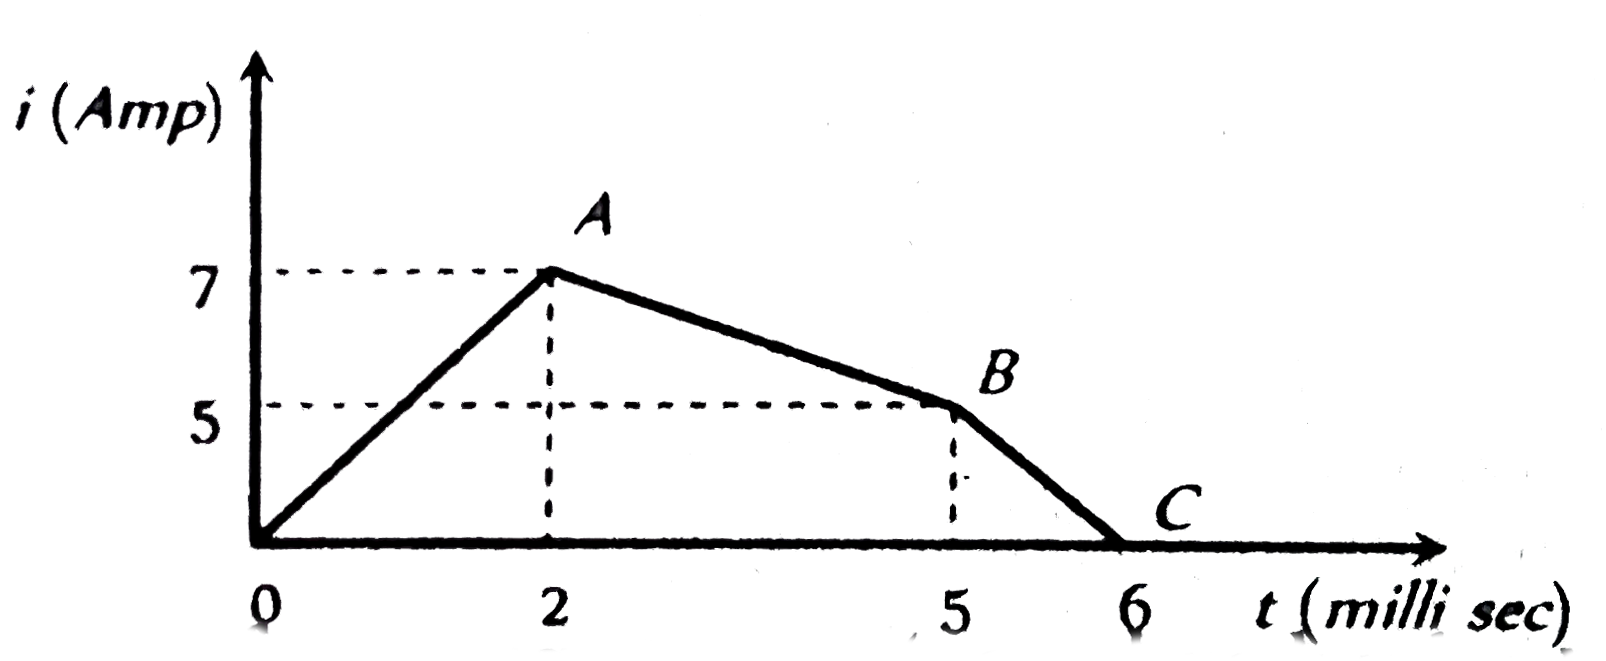
Reason :− Acceleration is positive for all shown value of t.02:49View SolutionThe current through a 4.6 H inductor is shown in the following graph. The induced emf during the time interval t = 5 milli - sec to 6 milli - sec will be
 02:18View Solution
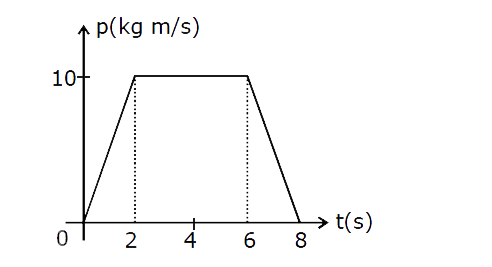
The momentum p of an object varies with time (t) as shown in figure. The corresponding force (F)- time (t) graph is -
 02:21View Solution
Area enclosed by Frarr t graph for given body in 1 sec. interval is 100 Ns. What will be magnitude of force ?
02:06View SolutionF → t graph for a body is shown in figure. The change in value of momentum of the body in the interval 0.02 s to 0.06 s is ..
 04:59View Solution
The kinetic energy of a body is given by equation K=(2t3) Joule (t in sec).The correct graph shown between applied force (F) and time (t) is ………….
01:26View SolutionThe current through a 4.6 H inductor is shown in the following graph. The induced emf during the time interval t = 5 milli - sec to 6 milli - sec will be
 02:57View Solution
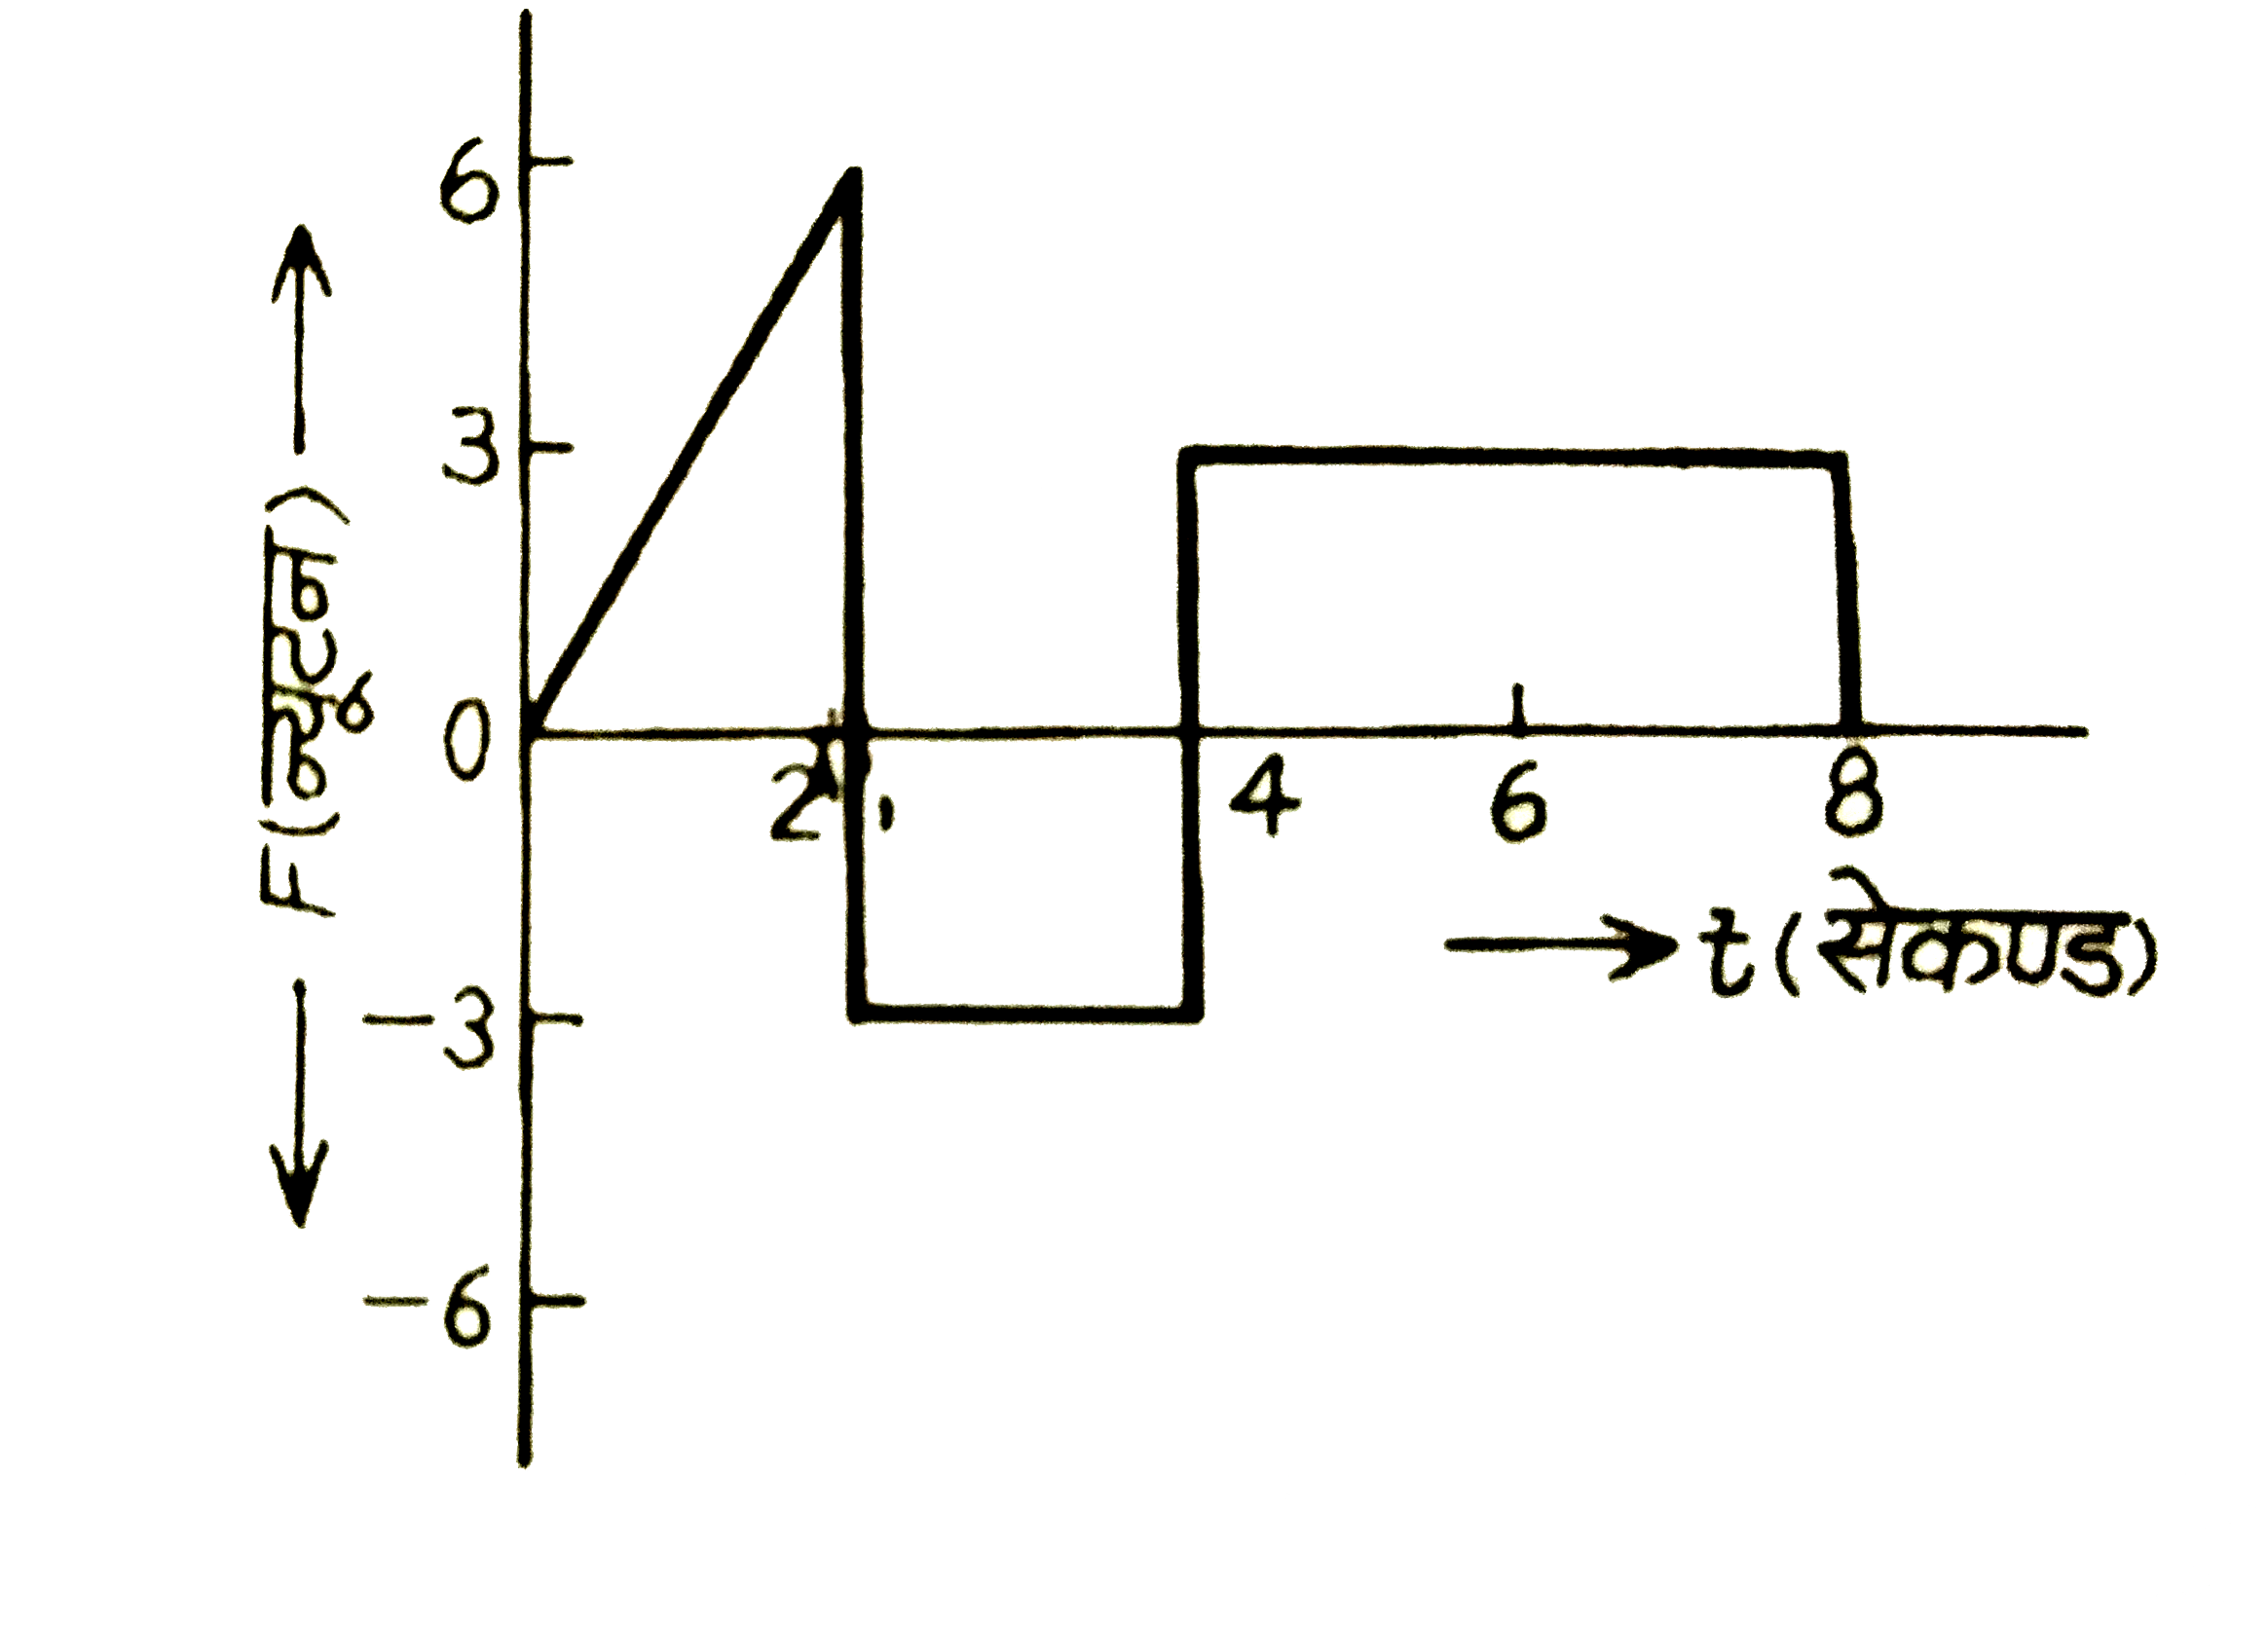
m द्रव्यमान के किसी कण पर आरोपित बल F को बल-समय ग्राफ द्वारा दर्शाया गया है।समय t = 0 से 8 सेकण्ड तक के अंतराल में कण के संवेग में परिवर्तन होगा:
 00:55View Solution
