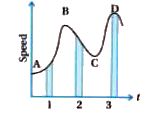
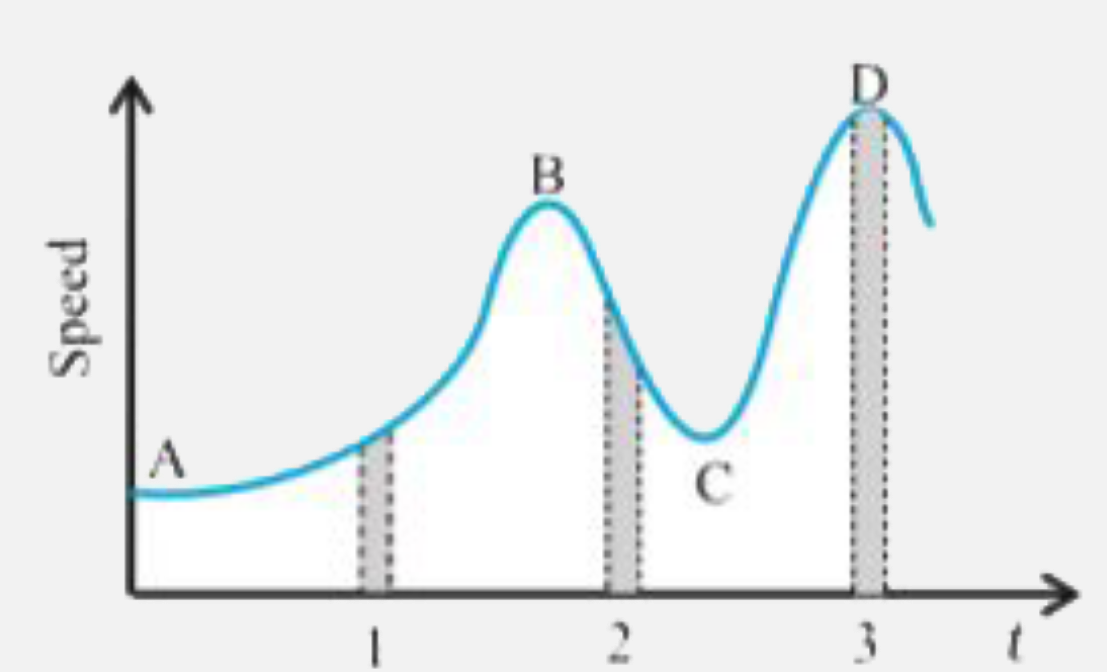
Figure gives a speed - time graph of a particle in motion along a constant direction. Three equal intervals of time are shown. In which interval is the average acceleration greatest in magnitude ? In which interval is the average speed greatest? Choosing the positive direction as the constant direction of motion give the signs of vand a in the three intervals. What are the acclerations at the points A, B, C and D?
 Solution in Gujrati
(i) Average acceleration =change in speedtime
Now for smaller intervals of time v→t graph, slope gives average acceleration. In second part, the slope is maximum. Hence acceleration is maximum (more than part 1 and part 3).
(ii) The average speed is maximum in 3rd part but a is zera=0,v>0
(iii) In first part, slope is positive, Hence, a and v both are positive a>0,v>0
(iv) In second part the slope is negative, hence a is negative and speed is positive a<0,v>0.
(v) Speed is positive and a is zero in third part of graph.
(vi) Acceleration will be zero at points A,B,C, D in graph.
Topper's Solved these Questions
- BOOK - KUMAR PRAKASHANCHAPTER - MOTION IN A STRAIGHT LINE EXERCISE - SECTION-C43videos
MOTION IN A STRAIGHT LINE
- BOOK - KUMAR PRAKASHANCHAPTER - MOTION IN A STRAIGHT LINE EXERCISE - SECTION-D26videos
MOTION IN A STRAIGHT LINE
- BOOK - KUMAR PRAKASHANCHAPTER - MOTION IN A STRAIGHT LINE EXERCISE - SECTION-A TRY YOUR SELF (VSQs)52videos
MOTION IN A STRAIGHT LINE
- BOOK - KUMAR PRAKASHANCHAPTER - MECHANICAL PROPERTIES OF FLUIDS EXERCISE - QUESTION PAPER (SECTION -C)3videos
MECHANICAL PROPERTIES OF FLUIDS
- BOOK - KUMAR PRAKASHANCHAPTER - OBJECTIVE QUESTIONS AS PER NEW PAPER STYLE EXERCISE - CHAPTER - 8 (Match Type questions)5videos
OBJECTIVE QUESTIONS AS PER NEW PAPER STYLE
Similar Questions
What is acceleration ? What is the direction ? Also gives its unit.
02:32View SolutionAmong the four graph shown in the figure there is only one graph for which average velocity over the time interval (O,T) can vanish for a suitably chosen T. Which one is it ?
05:52View SolutionHow can we determine whether the object is in rest or not?
04:48View SolutionGlycerine flows steadily through a horizontal tube of length 1.5m and radius 1.0 cm . If the amount of glycerine collected per second at one is 4.0×10⁻³kgs−1 , what is the pressure difference between the two ends of the tube ? (Density of glycerine =1.3×10103kgm−3 and viscosity of glycerine =0.83 Pa s). [ you may also like to check if the assumption of laminar flow in the tube is correct]
02:39View SolutionType of satellites are given in Column-I and their uses are given in Column-II. Match them properly :
Column-IColumn-II(1) Polar satellite(a) Tele communication(2) Geo-stationary satellite(b) Investigation(c) For information about atmosphere04:11View SolutionFig. 2 (NCT).9 show the x-t plot of a particle in one dimensional motion. Three different equal intervals of time are shown. In which interval the average speed is greatest and in which it is the least ? Give the sign of average speed for each interval. .
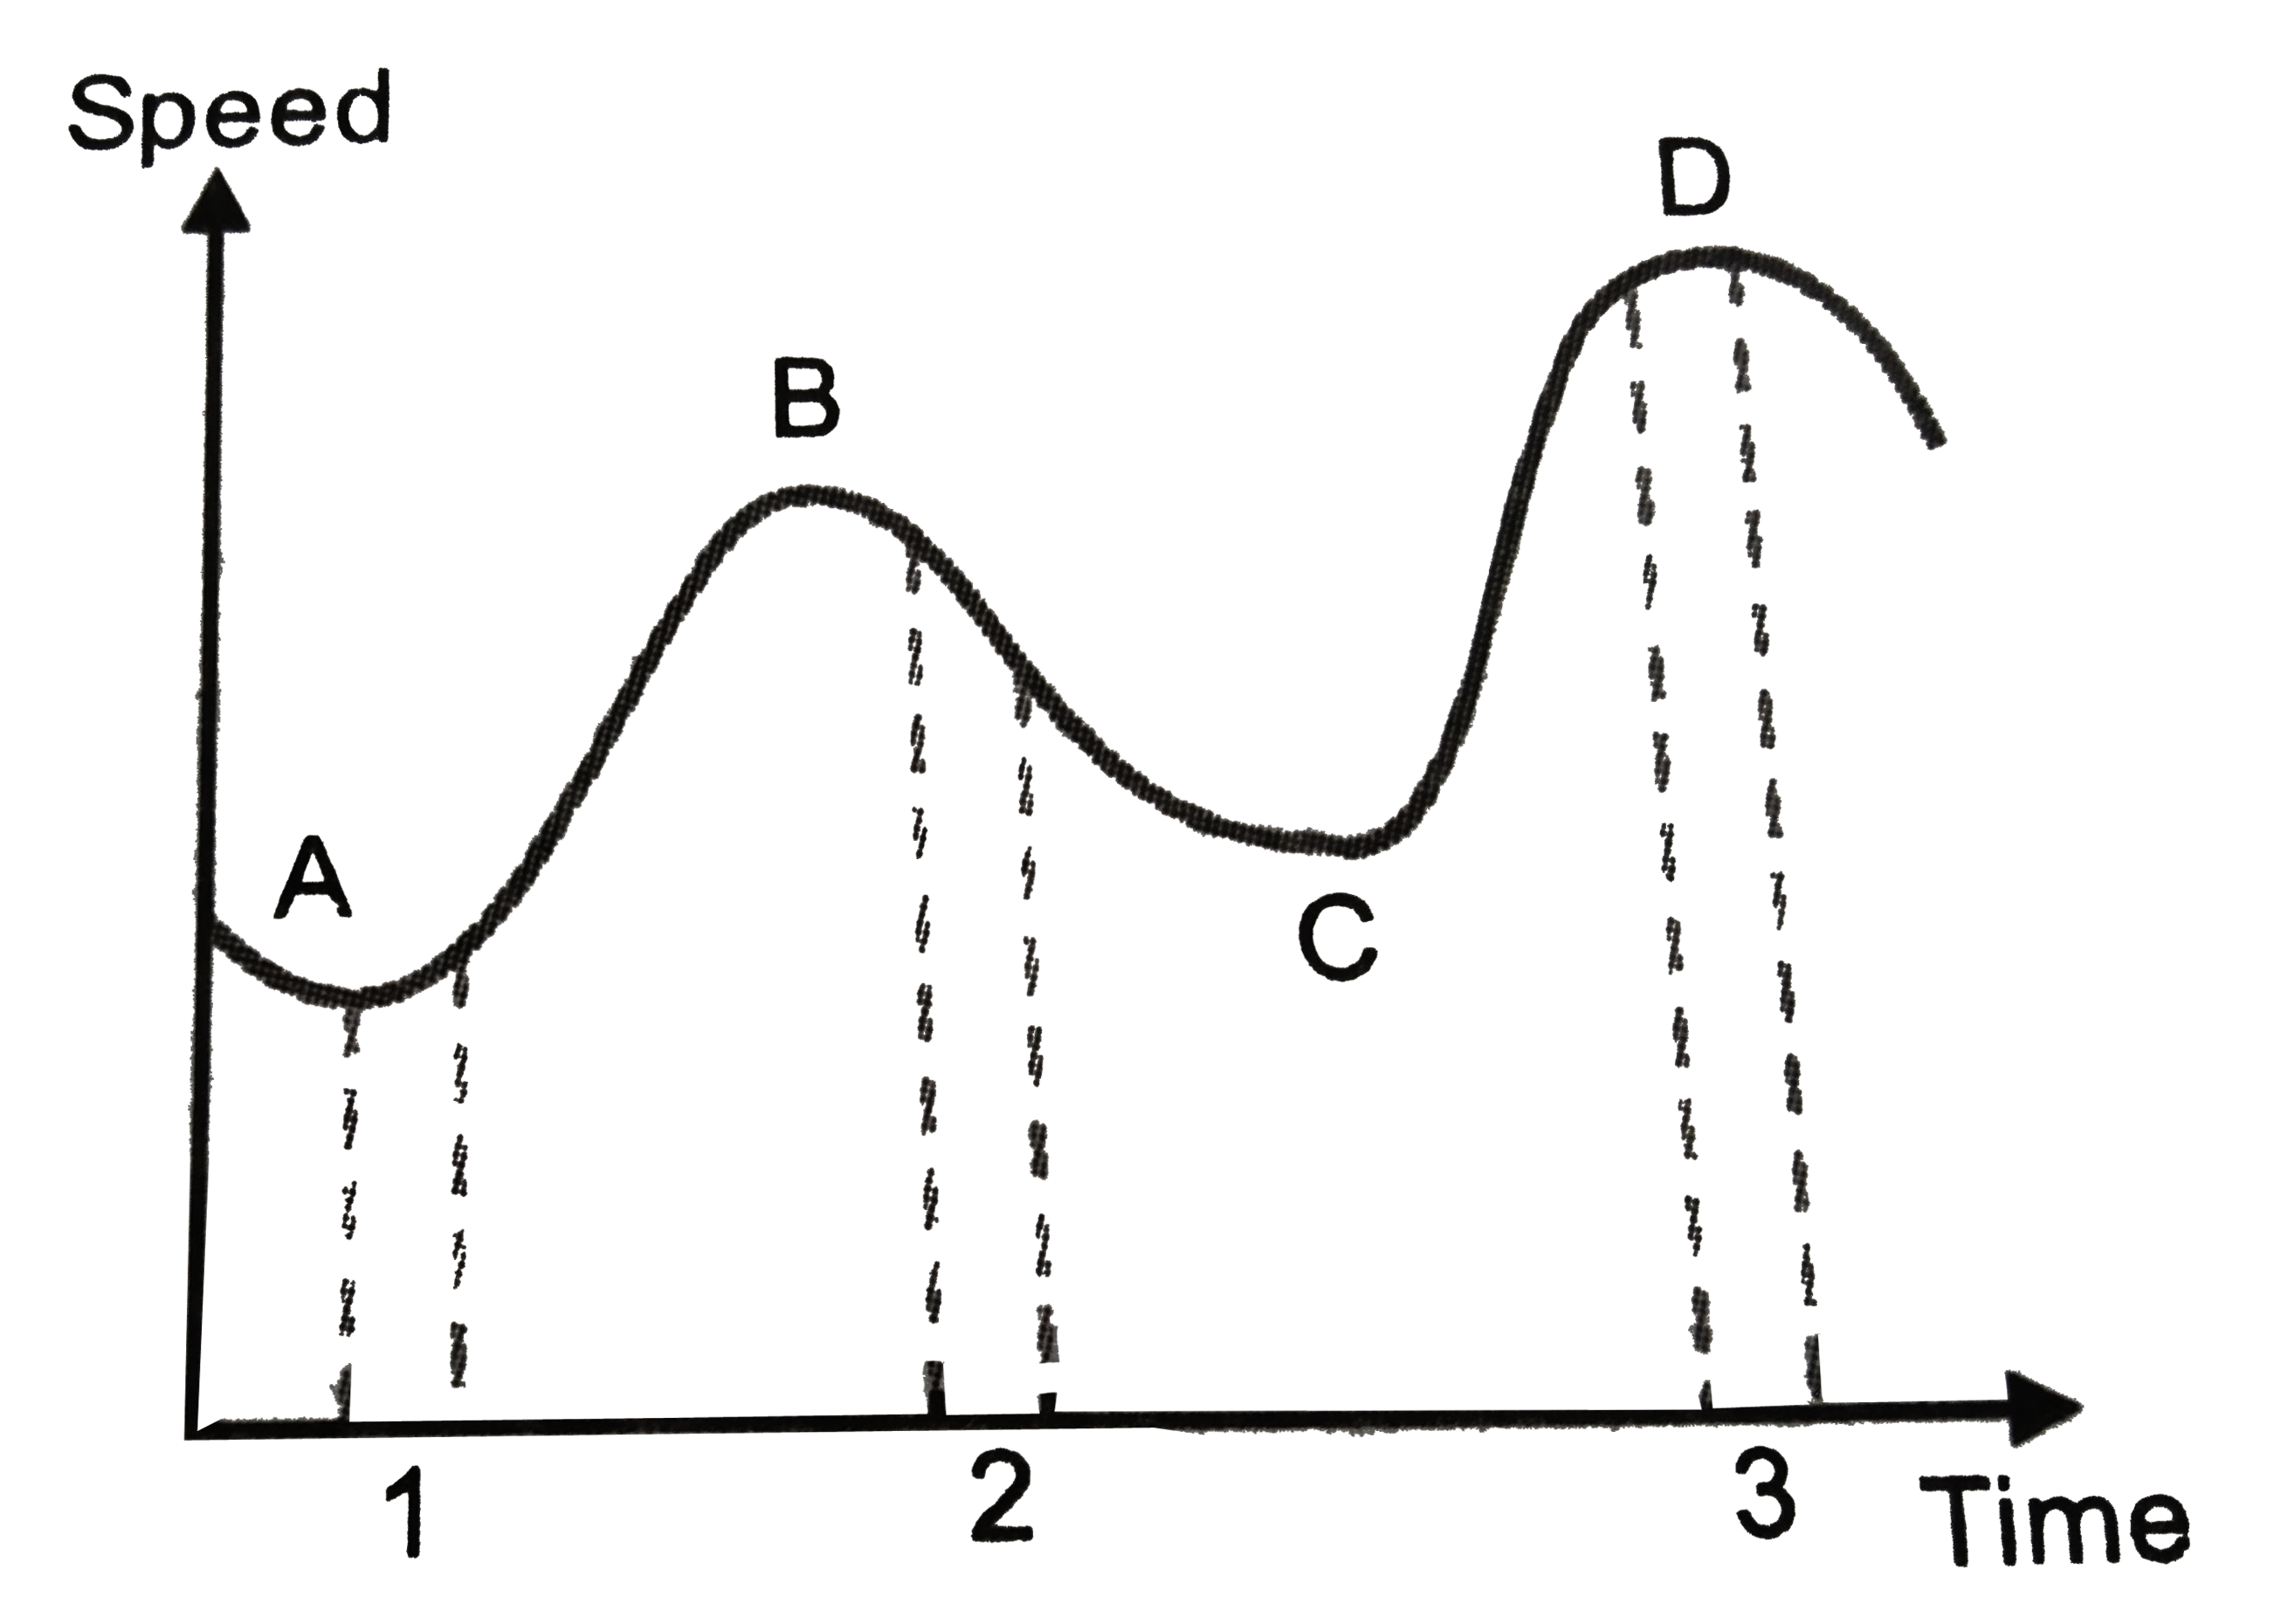
View SolutionFig. 2 (NCT). 10 . Give a speed-tiem graph of a particle in one dimenstional motion. Three different equal intervals of time are shwon. In which interval is the average acceleration graeatest in magnitude ? In which interval is the average speed greatest ? Choosing the positive direction as the constant direction of motion, give the signs of u and a in the three intervals. What are the acclerations at teh points A,B,C and D ?
 .View Solution
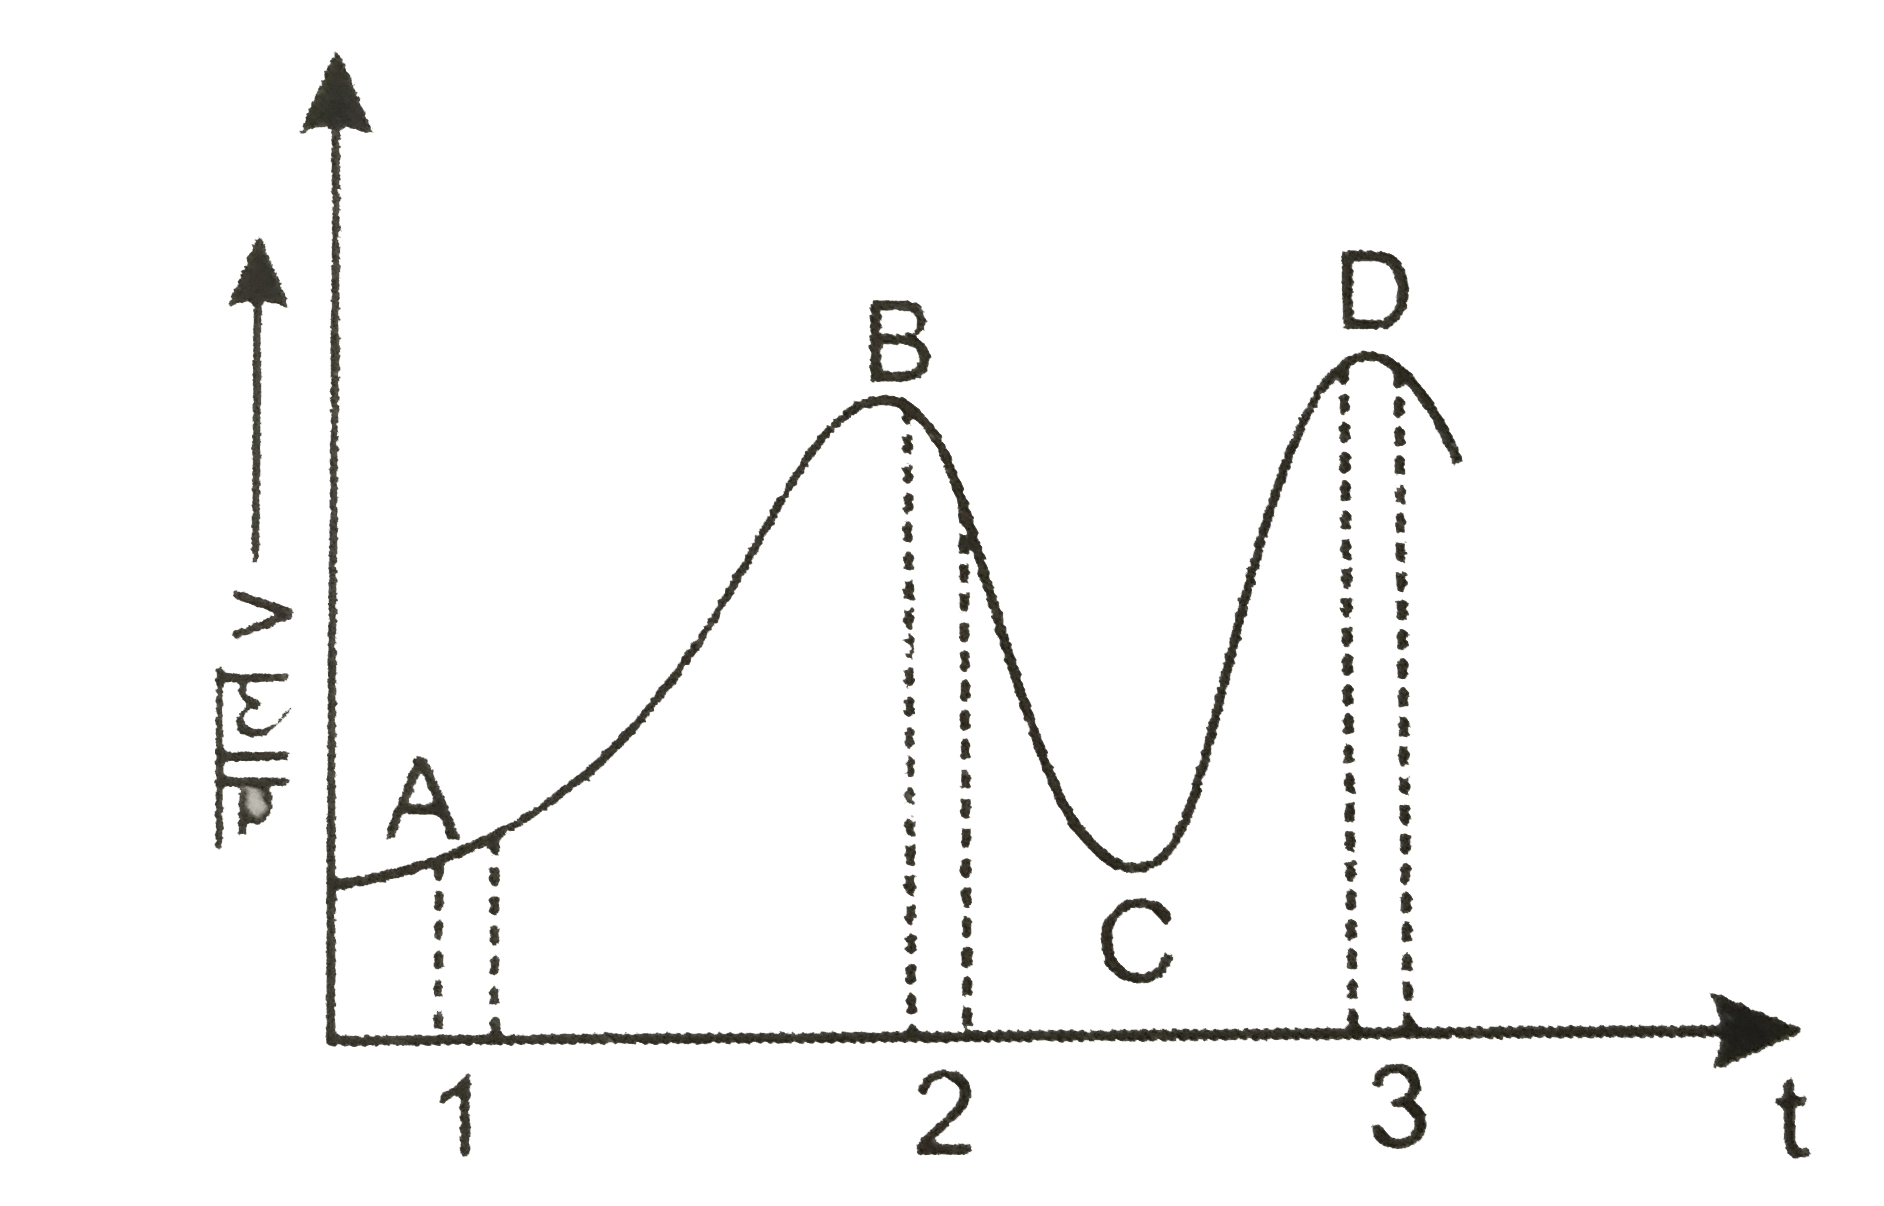
चित्र में किसी नियत (स्थिर) दिशा के अनुदिश चल रहे कण का चाल-समय ग्राफ दिखाया गया है। इसमें तीन समान समयान्तराल दिखाये गये हैं। किस अन्तराल में औसत त्वरण का परिमाण अधिकतम होगा? किस अन्तराल में औसत चाल अधिकतम होगी? धनात्मक दिशा को गति की स्थिर दिशा चुनते हुए तीनों अन्तरालों में v तथा a के चिन्ह बताइए। A,B,C, व D बिंदुओं पर त्वरण क्या होंगे?
 03:22View Solution
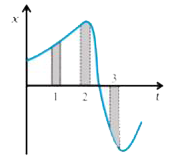
Figure. gives the x-t plot of a particle in one-dimensional motion. Three different equal intervals of time are shown. In which interval is the average speed greatest, and in which is it the least ? Give the sign of average velocity for each interval.
06:19View SolutionFigure. gives a speed-time graph of a particle in motion along a constant direction. Three equal intervals of time are shown. In which interval is the average acceleration greatest in magnitude ? In which interval is the average speed greatest ? Choosing the positive direction as the constant direction of motion, give the signs of v and a in the three intervals. What are the accelerations at the points A, B, C and D ?
03:28View SolutionFigure. gives the x-t plot of a particle in one-dimensional motion. Three different equal intervals of time are shown. In which interval is the average speed greatest, and in which is it the least ? Give the sign of average velocity for each interval.
 07:09View Solution
Figure. gives a speed-time graph of a particle in motion along a constant direction. Three equal intervals of time are shown. In which interval is the average acceleration greatest in magnitude ? In which interval is the average speed greatest ? Choosing the positive direction as the constant direction of motion, give the signs of v and a in the three intervals. What are the accelerations at the points A, B, C and D ?
01:37View SolutionFigure. gives the x-t plot of a particle in one-dimensional motion. Three different equal intervals of time are shown. In which interval is the average speed greatest, and in which is it the least ? Give the sign of average velocity for each interval.
03:28View SolutionFigure. gives a speed-time graph of a particle in motion along a constant direction. Three equal intervals of time are shown. In which interval is the average acceleration greatest in magnitude ? In which interval is the average speed greatest ? Choosing the positive direction as the constant direction of motion, give the signs of v and a in the three intervals. What are the accelerations at the points A, B, C and D ?
 02:33View Solution
Fig. show the x-t plot of a particle in one dimensional motion. Three different equal intervals of time are shown. In which interval the average speed is greatest and in which it is the least? Give the sign of average speed for each interval. .
View Solution

