Figure represents the graph of photo current l versus applied voltage (V). The minimum energy of emitted photoelectrons is
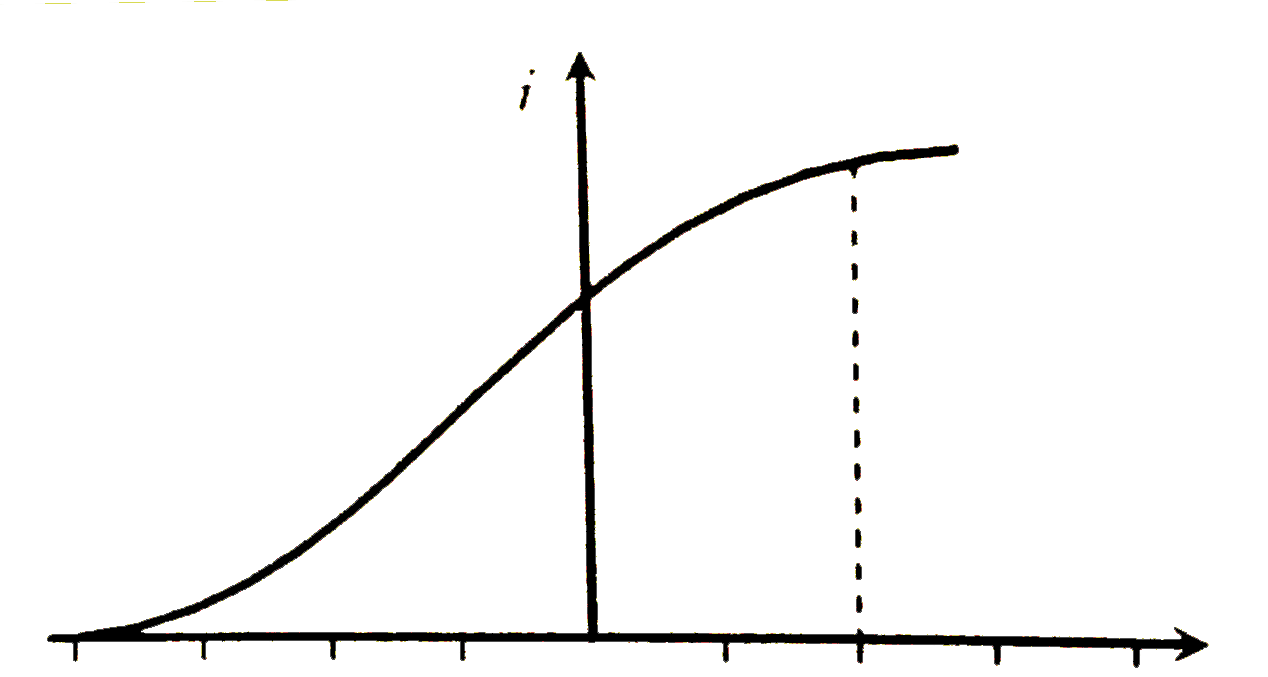
2 eV
4 eV
0 eV
4 J
The correct Answer is:B
Topper's Solved these Questions
- ELECTRON, PHOTON, PHOTOELECTRIC EFFECT AND X-RAYSBOOK - ERRORLESS CHAPTER - ELECTRON, PHOTON, PHOTOELECTRIC EFFECT AND X-RAYSEXERCISE - Assertion & Reason
3 Videos
- ELECTRON, PHOTON, PHOTOELECTRIC EFFECT AND X-RAYSBOOK - ERRORLESS CHAPTER - ELECTRON, PHOTON, PHOTOELECTRIC EFFECT AND X-RAYSEXERCISE - Self Evaluation Test
3 Videos
- ELECTRON, PHOTON, PHOTOELECTRIC EFFECT AND X-RAYSBOOK - ERRORLESS CHAPTER - ELECTRON, PHOTON, PHOTOELECTRIC EFFECT AND X-RAYSEXERCISE - Critical Thinking
1 Videos
- ELECTRO MAGNETIC INDUCTIONBOOK - ERRORLESS CHAPTER - ELECTRO MAGNETIC INDUCTIONEXERCISE - SET
20 Videos
- ELECTRONICSBOOK - ERRORLESS CHAPTER - ELECTRONICSEXERCISE - Selv Evaluation Test
23 Videos
Similar Questions
Knowledge Check
Figure represents the graph of photo current I versus applied voltage (V). The maximum kinetic energy of the emitted photoelectrons is
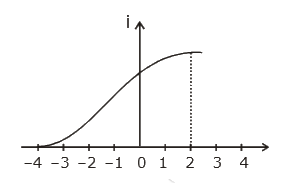 A2 eVB4 eVC0 eVD4 J
Which one of the following graphs in figure shows the variation of photoelectric current (I) with voltage (V) between the electrodes in a photoelectric cell?
A B
B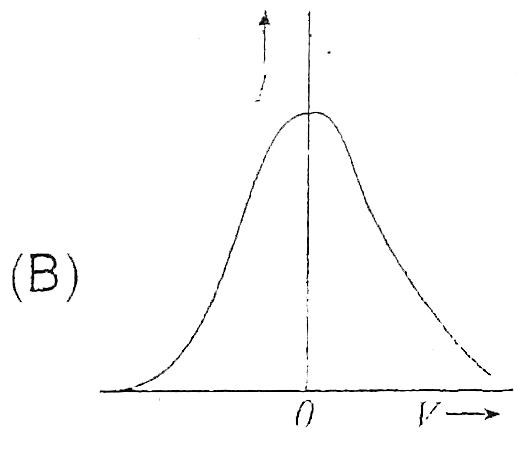 C
C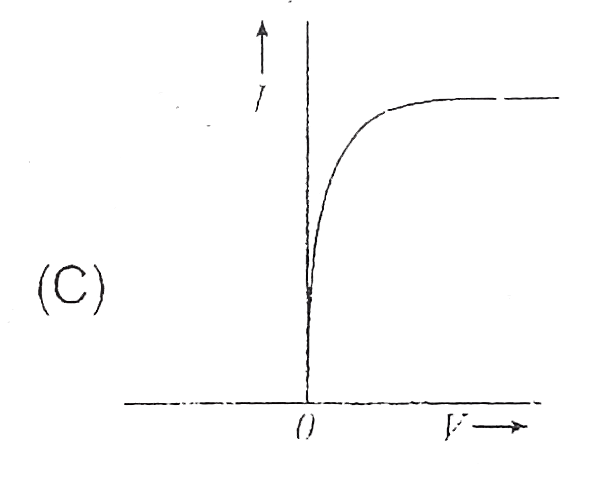 D
D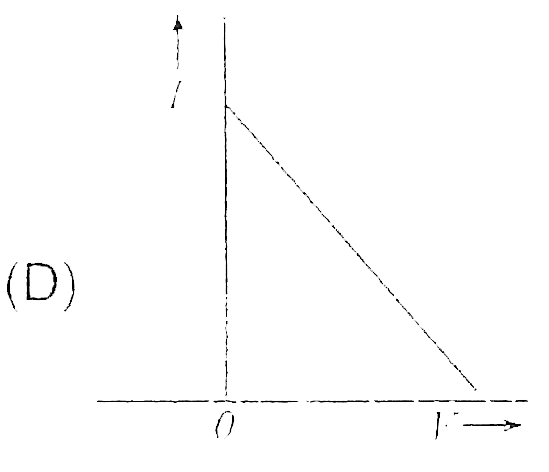
Light of frequency v is incident on a substance of threshold frequency v(v<v). The energy of the emitted photo-electron will be
Ah(v−v0)Bh/vChe(v−v0)Dh/v0
Plot a graph showing variation of current versus voltage for the material Ga.
View SolutionWhich one of the following graphs in figure shows the variation of photoelectric current (I) with voltage (V) between the electrodes in a photoelectric cell?
View SolutionThe graph shown in the figure represents a plot of current versus voltage for a given semi-conductor. Identify the region, if any, over which the semicondutor has a negative resistance.
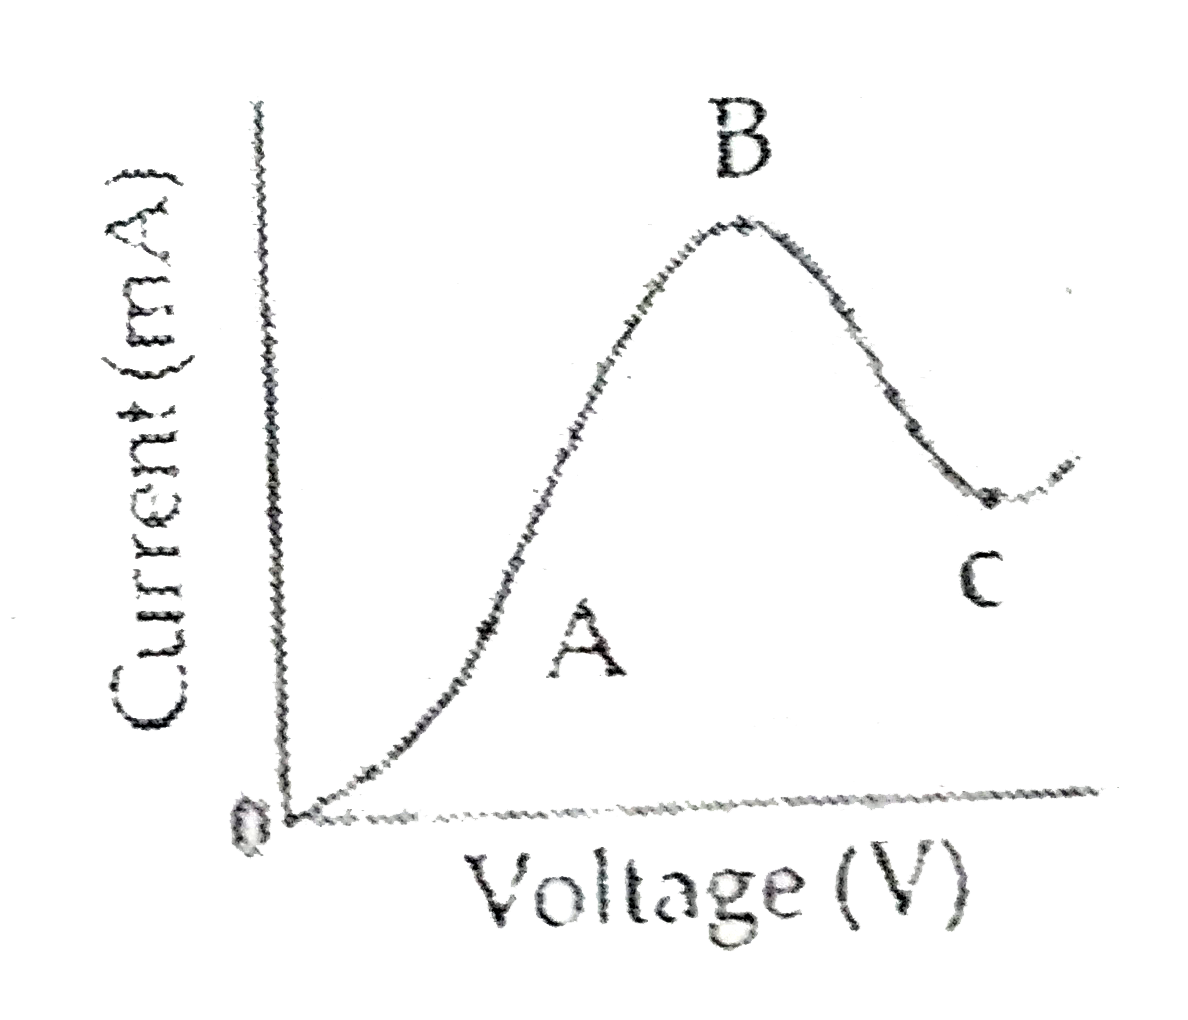
View SolutionPlot a graph showing variation of current versus voltage for the material GaAs
View SolutionIn an experiment of photo-electric effect, the graph of maximum kinetic energy Ek of the emitted photoelectrons versus the frequency v of the incident light is a straight line AB as shown in figure below :
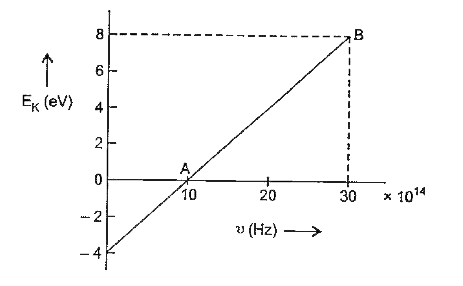
Work function of the metal.
View Solution
