Figure shows the position time graph of a particle of mass 5kg. The force acting on the particle for 0<t<4s and 8s<t<12s respectively are,

5N,5N
5N.7.5N
5N,10N
0N,0N
The correct Answer is:D
Given x-t graph shows that the particle is moving with constant speed and hence zero acceleration for 0<t<4sand8s<t<12s
∴ Force acting on the particle in the two intervals , F=ma=5×0=0N
Topper's Solved these Questions
- FORCE AND LAWS OF MOTIONBOOK - MTG IIT JEE FOUNDATIONCHAPTER - FORCE AND LAWS OF MOTIONEXERCISE - EXERCISE (INTEGER VALUE TYPE )
5 Videos
- FOOTSTEPS TOWARDS NEETBOOK - MTG IIT JEE FOUNDATIONCHAPTER - FOOTSTEPS TOWARDS NEETEXERCISE - Multiple Choice Question
45 Videos
- GRAVITATION BOOK - MTG IIT JEE FOUNDATIONCHAPTER - GRAVITATION EXERCISE - Olympiad/HOTS Corner
20 Videos
Similar Questions
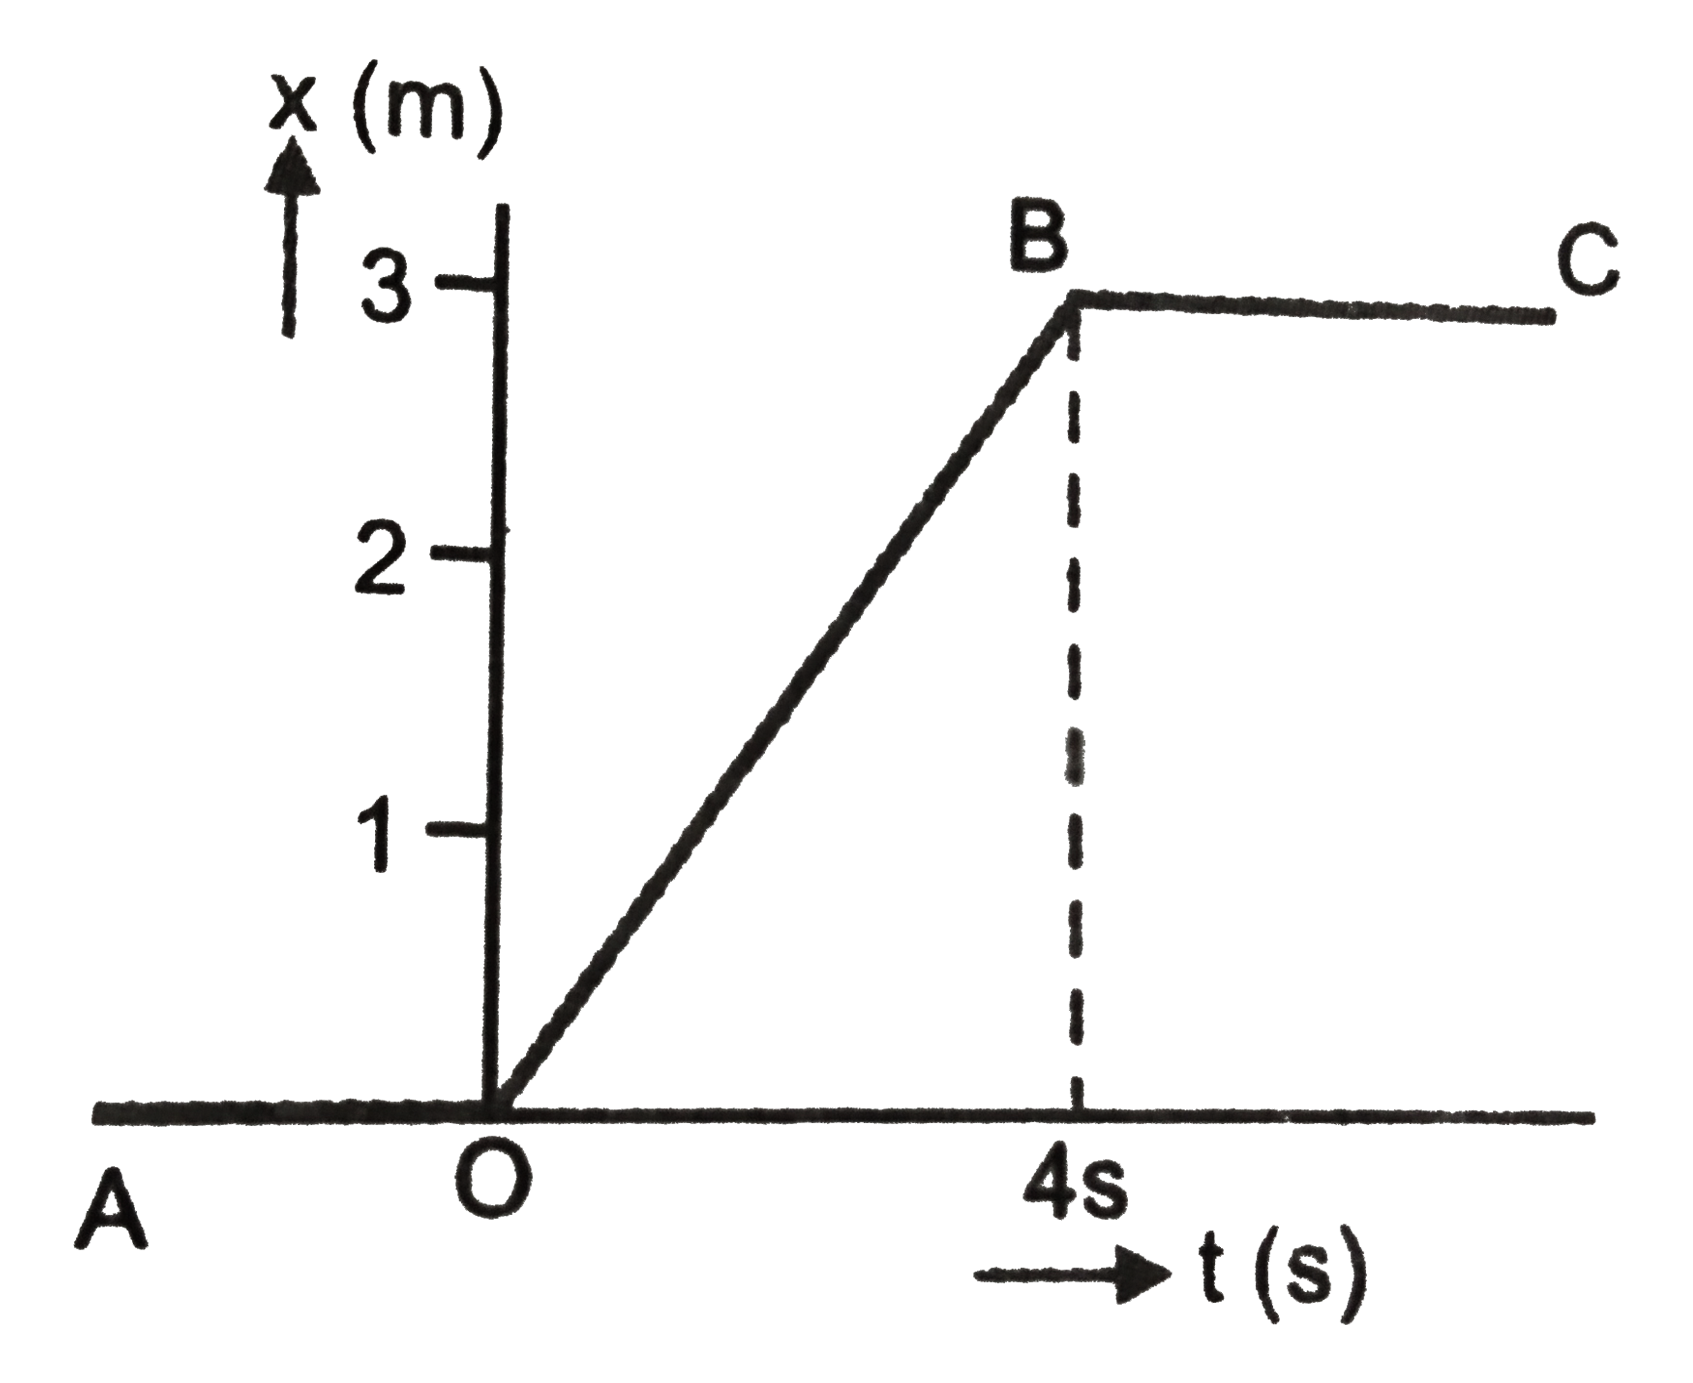
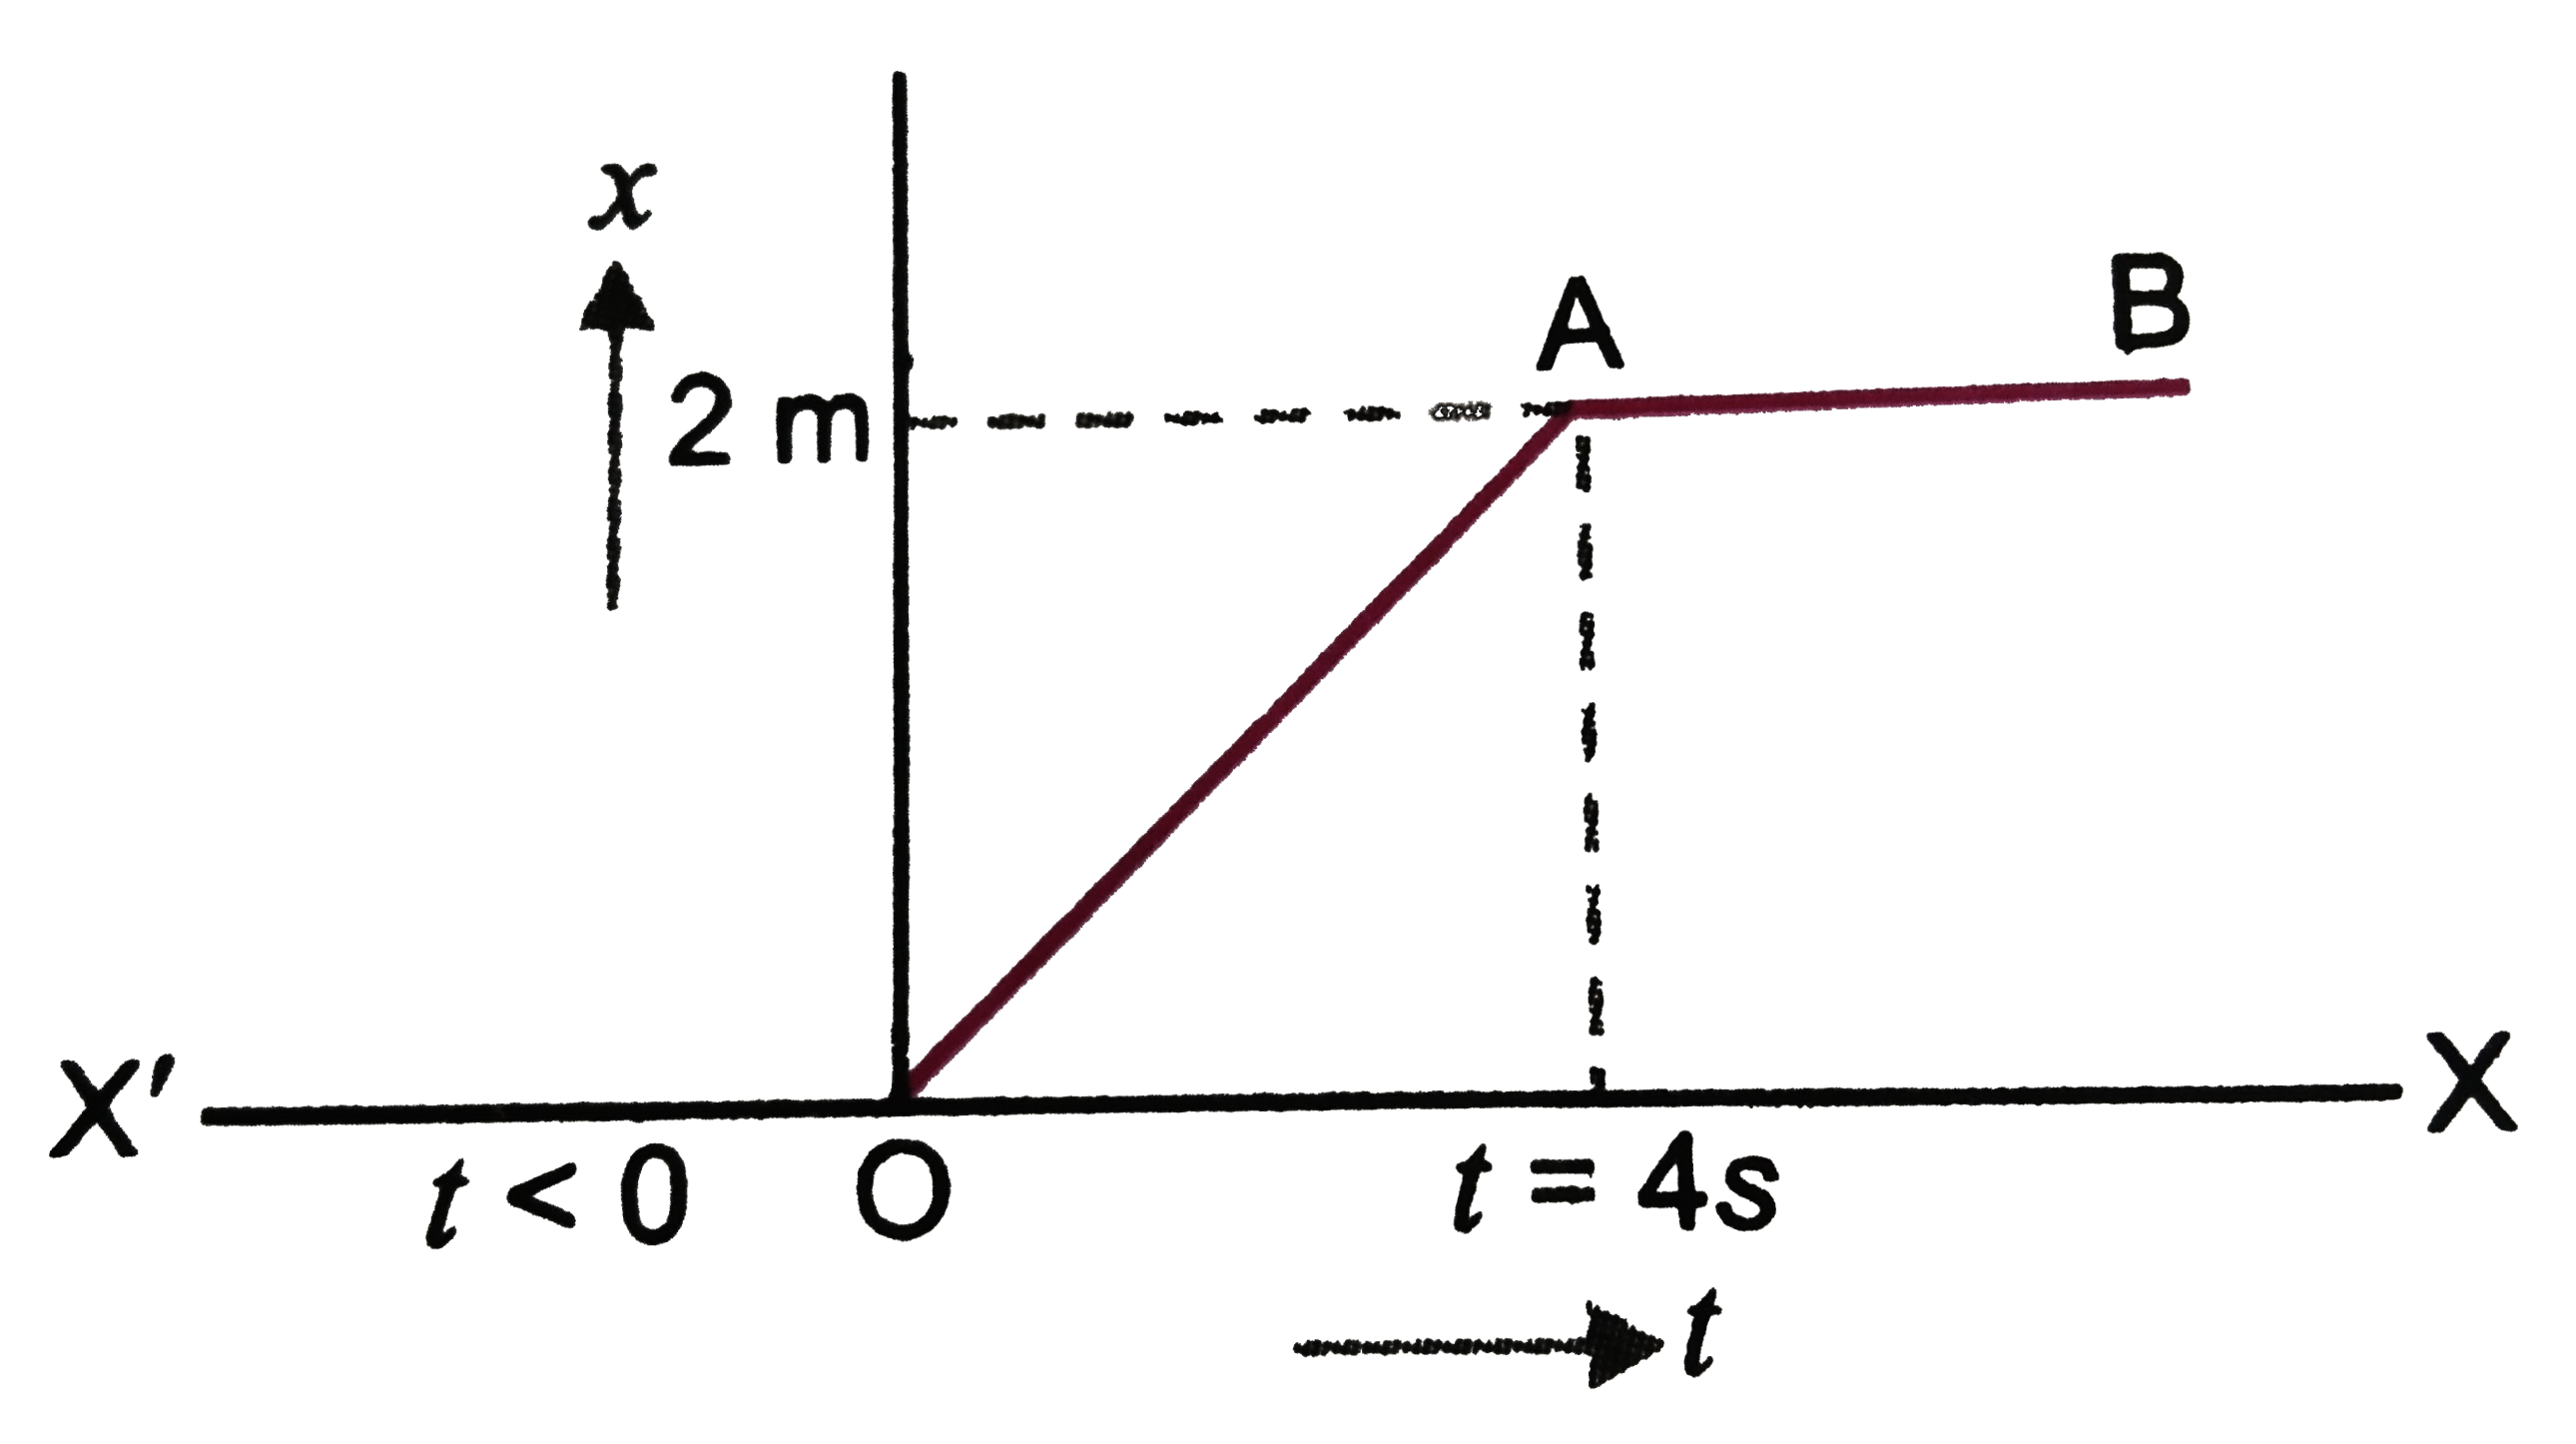
Fig. shows the position-time graph of a particle of mass 4 kg. What is the (i) force acting on the particle for t<0,t<4s,0<t<4s? (ii) impulse at t = 0 and t = 4 s? Assume that the motion is one dimensional.
View SolutionShown the position time graph of a particle of mass 4 kg What is the force on the particle for t<0,0<t<4s motion only
 .
.
View Solution
Knowledge Check
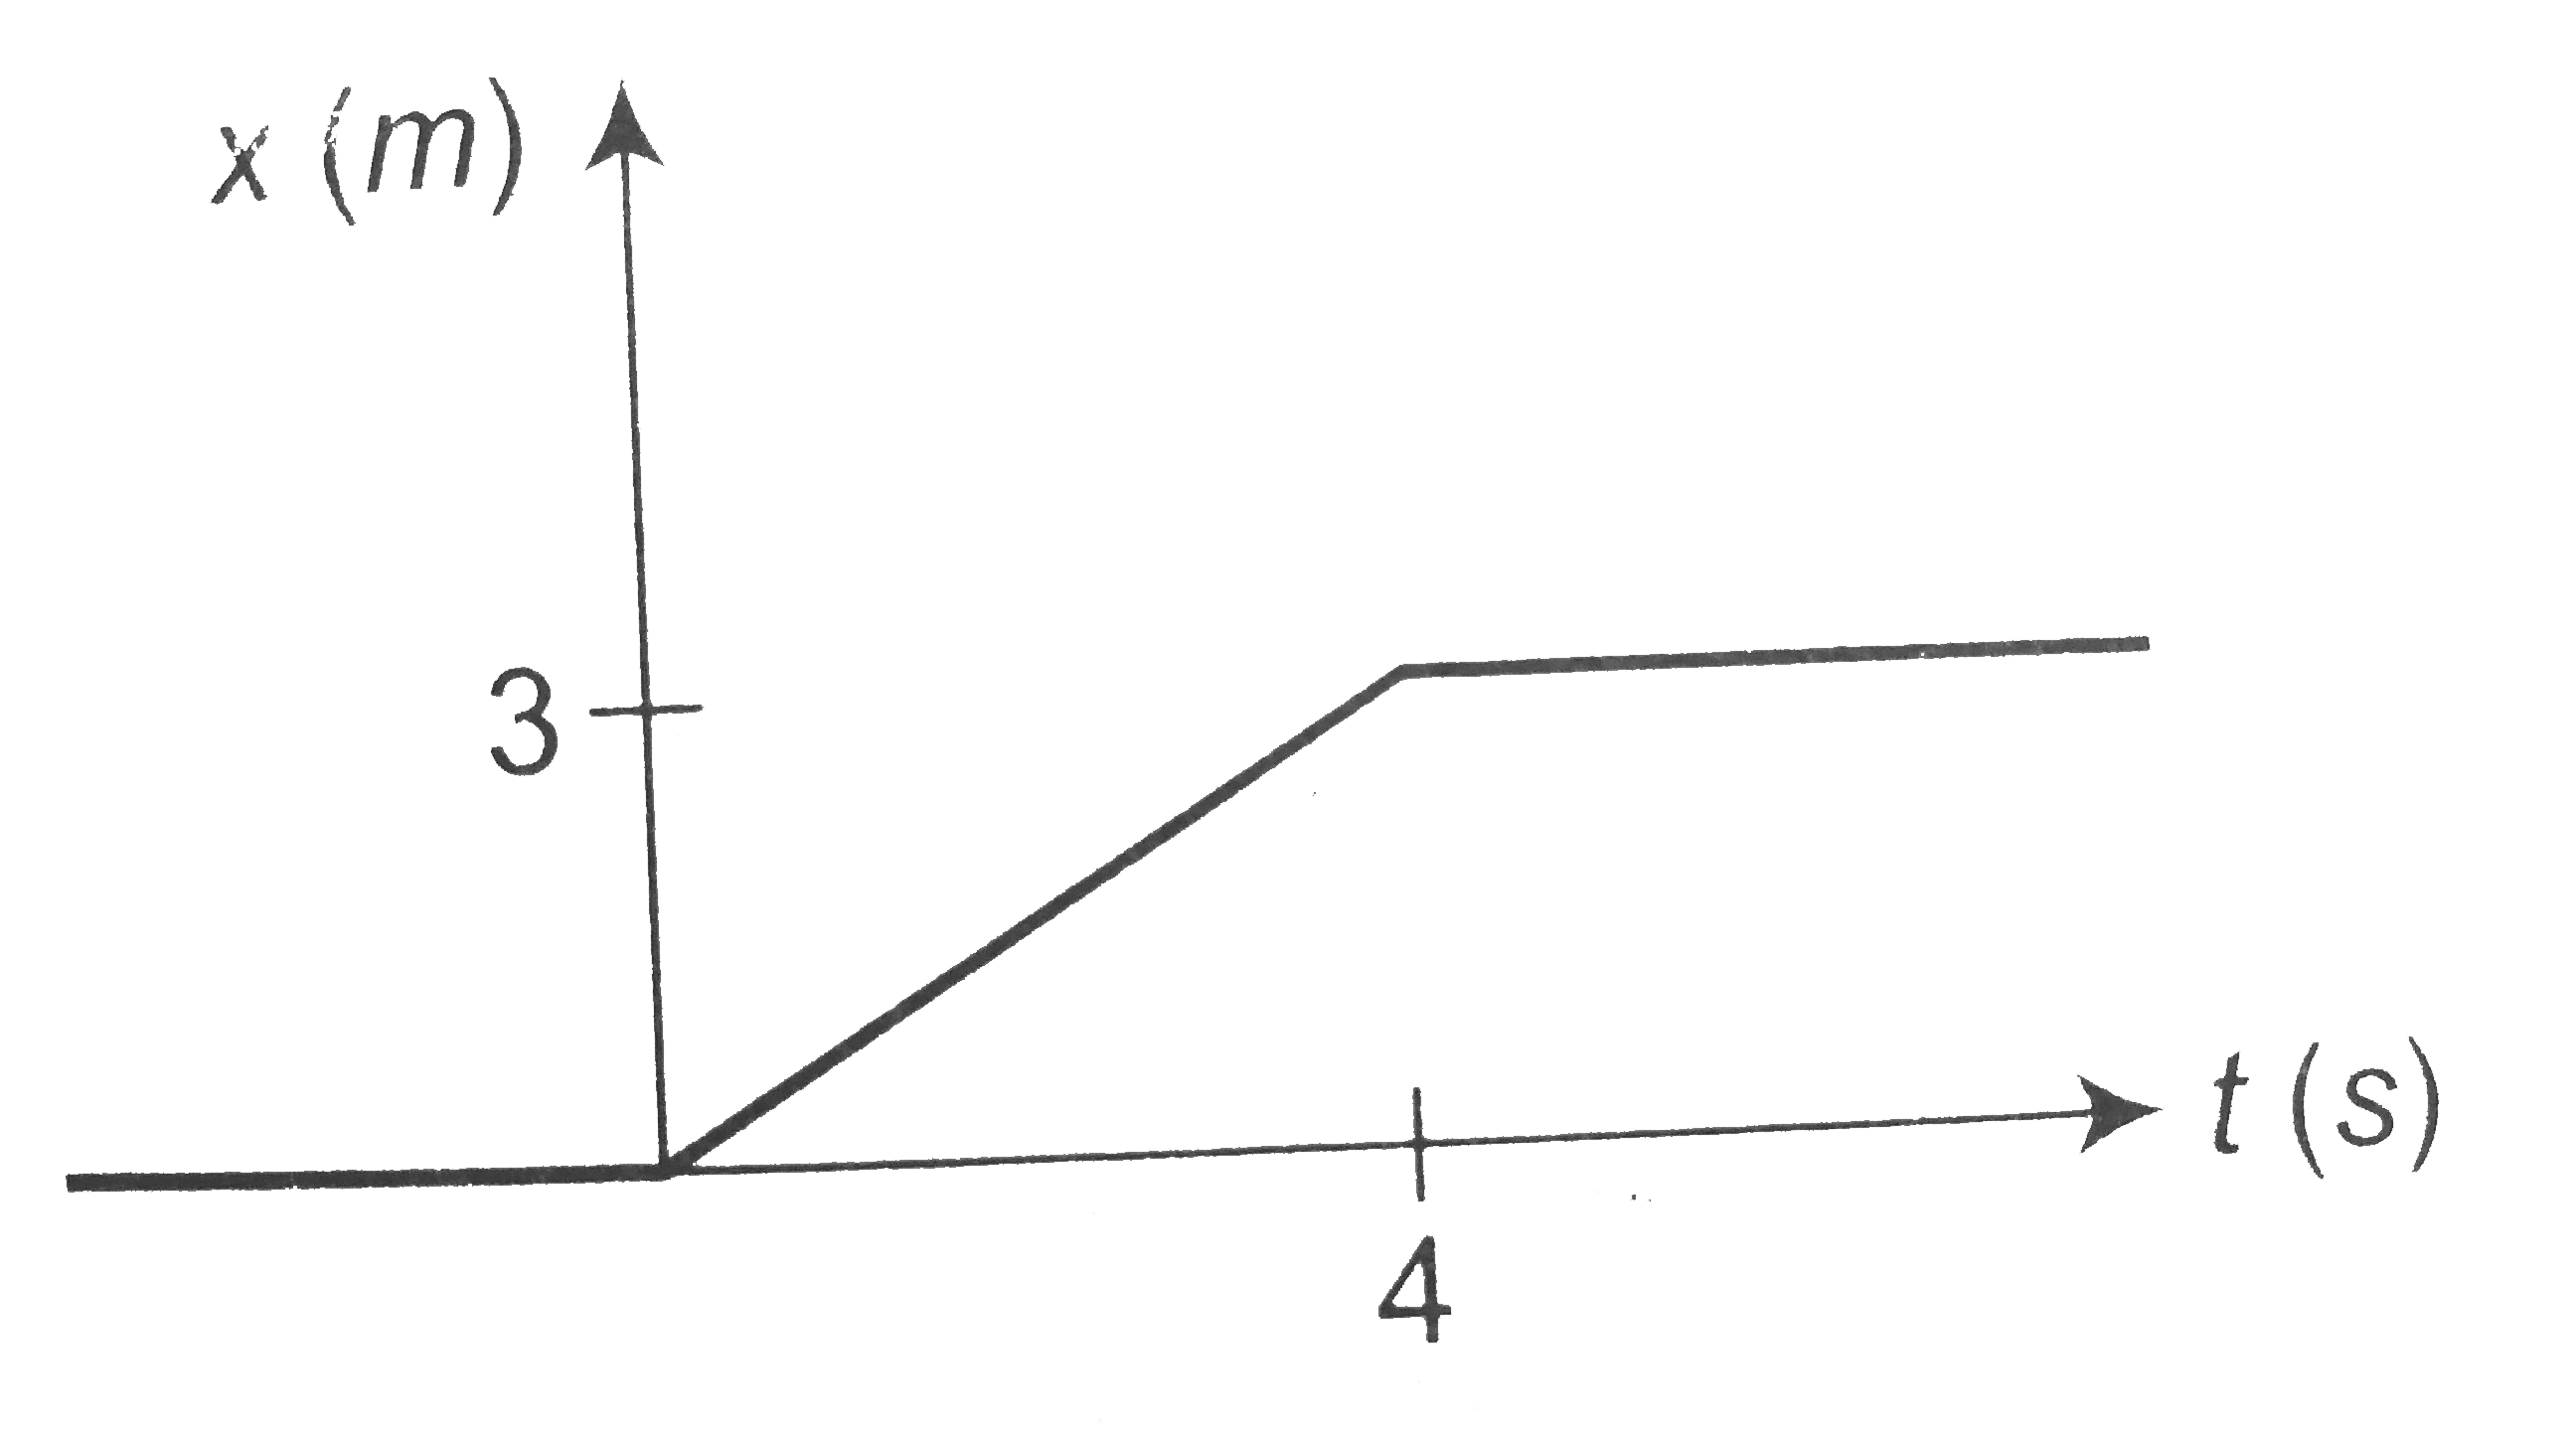
Figure shows the position-time graph of a particle of mass 4kg. Let the force on the particle for t<0 , 0<tlt,4s , t>4s be F1,F2 and F3 respectively. Then
 AF1=F2=F3=0BF1>F2=F3CF1>F2>F3DF1<F2<F3
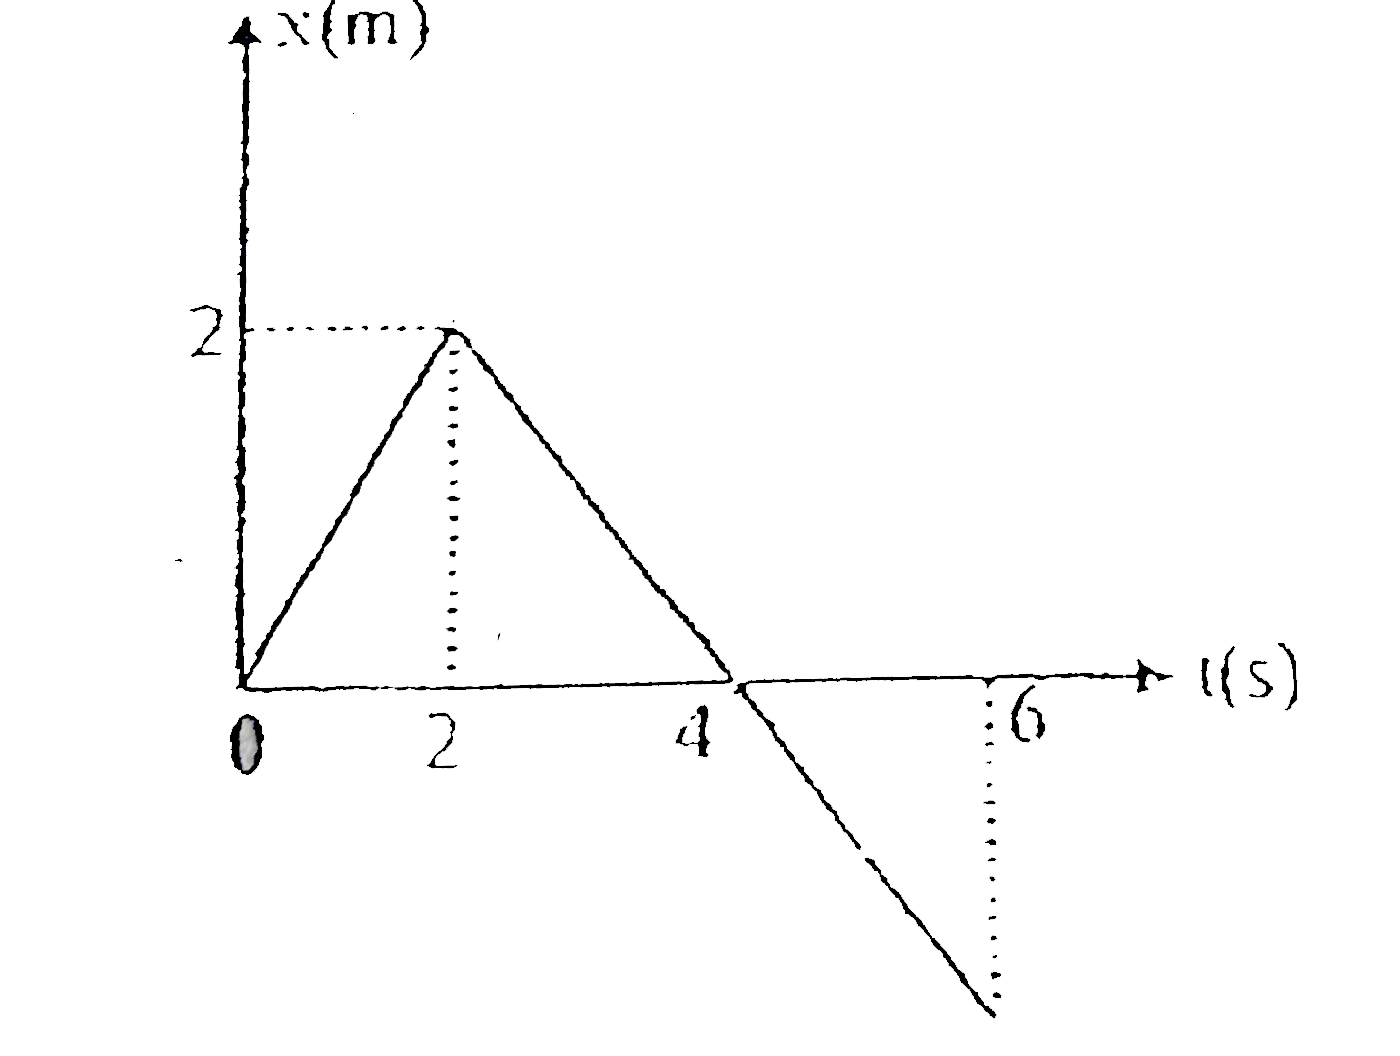
Position time graph of a particle of mass 2 kg is shown in figrure. Total work done on the particle from t=0 to t=4s is
 A8 JB4 JC0 JDCan't be determined
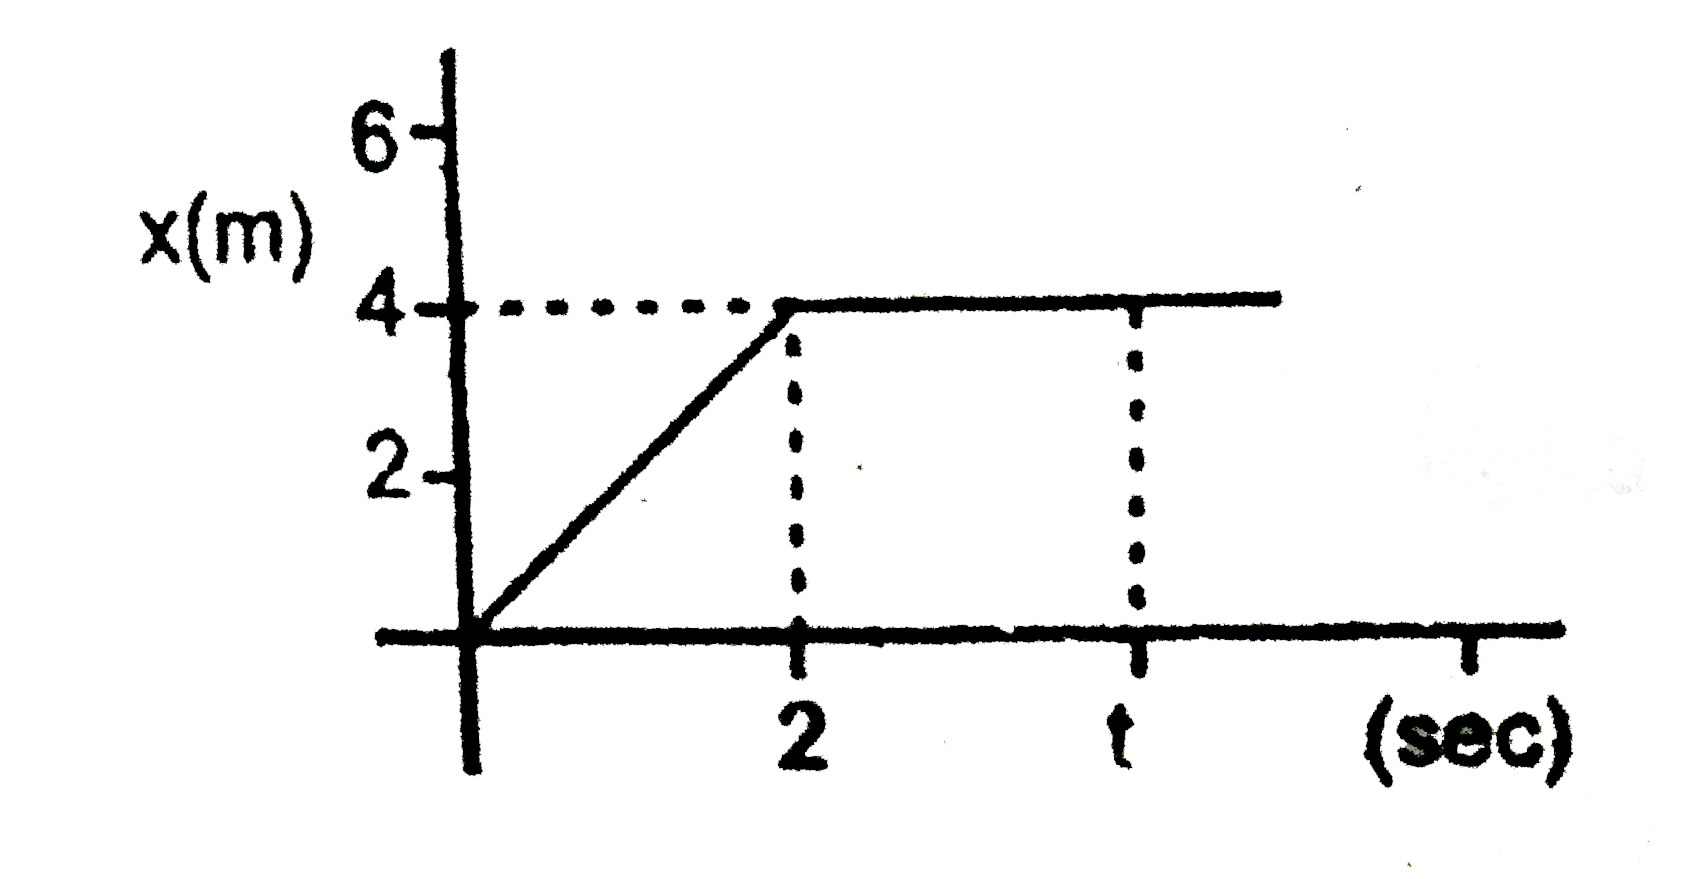
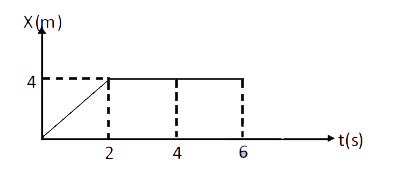
In the figure given below, the position time graph of a particle of mass 0.1kg is shown. The impulse at t=2 sec is
 A0.2gkm/secB−0.2kgmsec−1C0.1kgmsec−1D−0.1kgm/sec
Fig. shows the position-time graph of a particle of mass 4 kg. What is the (i) force acting on the particle for t<0,t<4s,0<t<4s? (ii) impulse at t = 0 and t = 4 s? Assume that the motion is one dimensional.
View SolutionThe position-time graph of a particle of mass 0.1 kg is shown. The impulse at t = 2s is :
View SolutionShows position time graph of a particle of mass 100g Find the impulse at t=0 and at t=4s
 .
.
View SolutionIn the figure given, the position-time graph of a particle of mass 0.1 kg is shown the impulse at t = 2s is
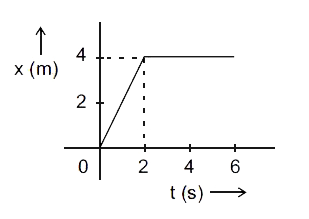
View SolutionThe position-time graph of a particle of mass 0.1 kg is shown. The impulse at t = 2s is :

View Solution
