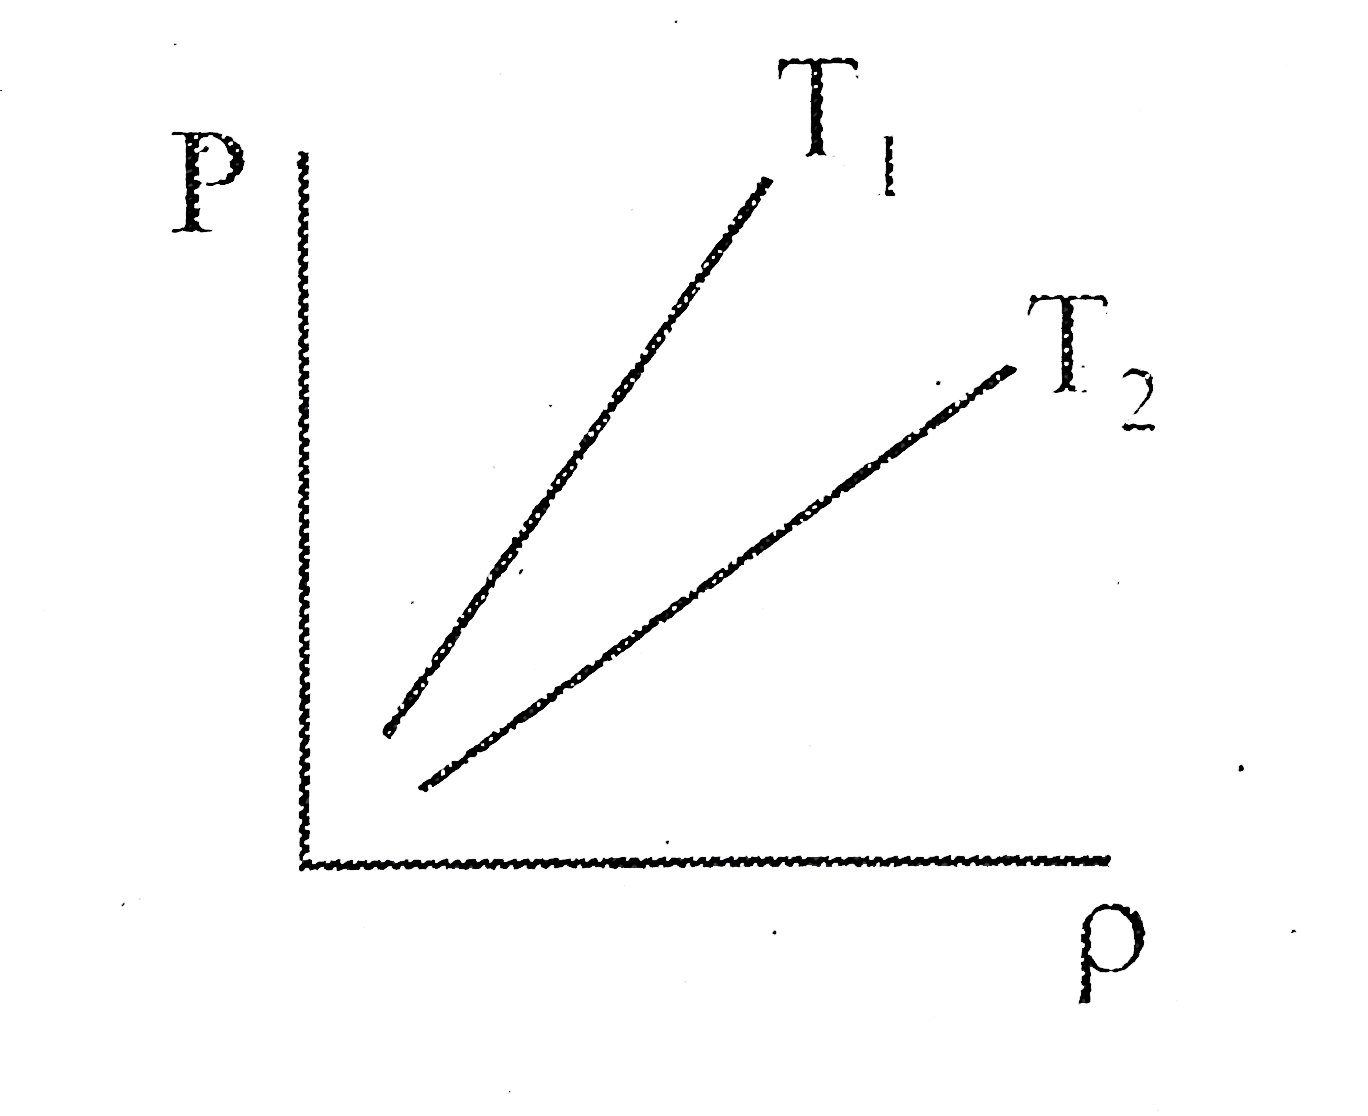
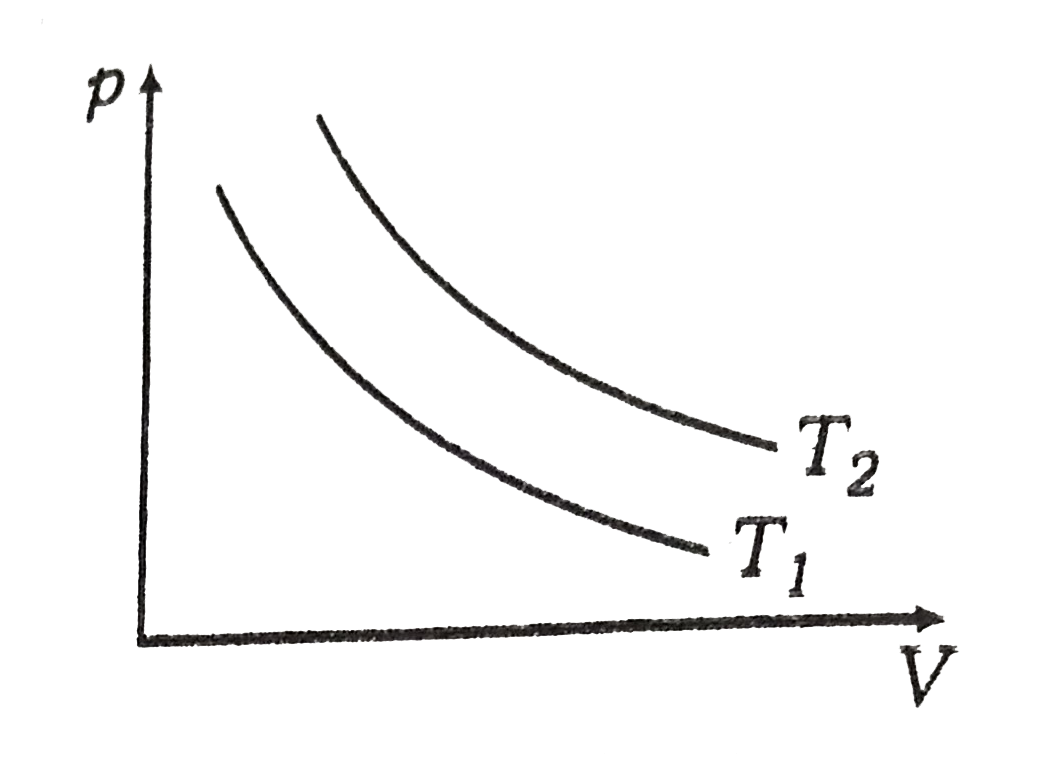
Figure shows the pressure P versus volume V graphs for a certains mass of a gas at two constant temperature . Which of the following interface is correct?
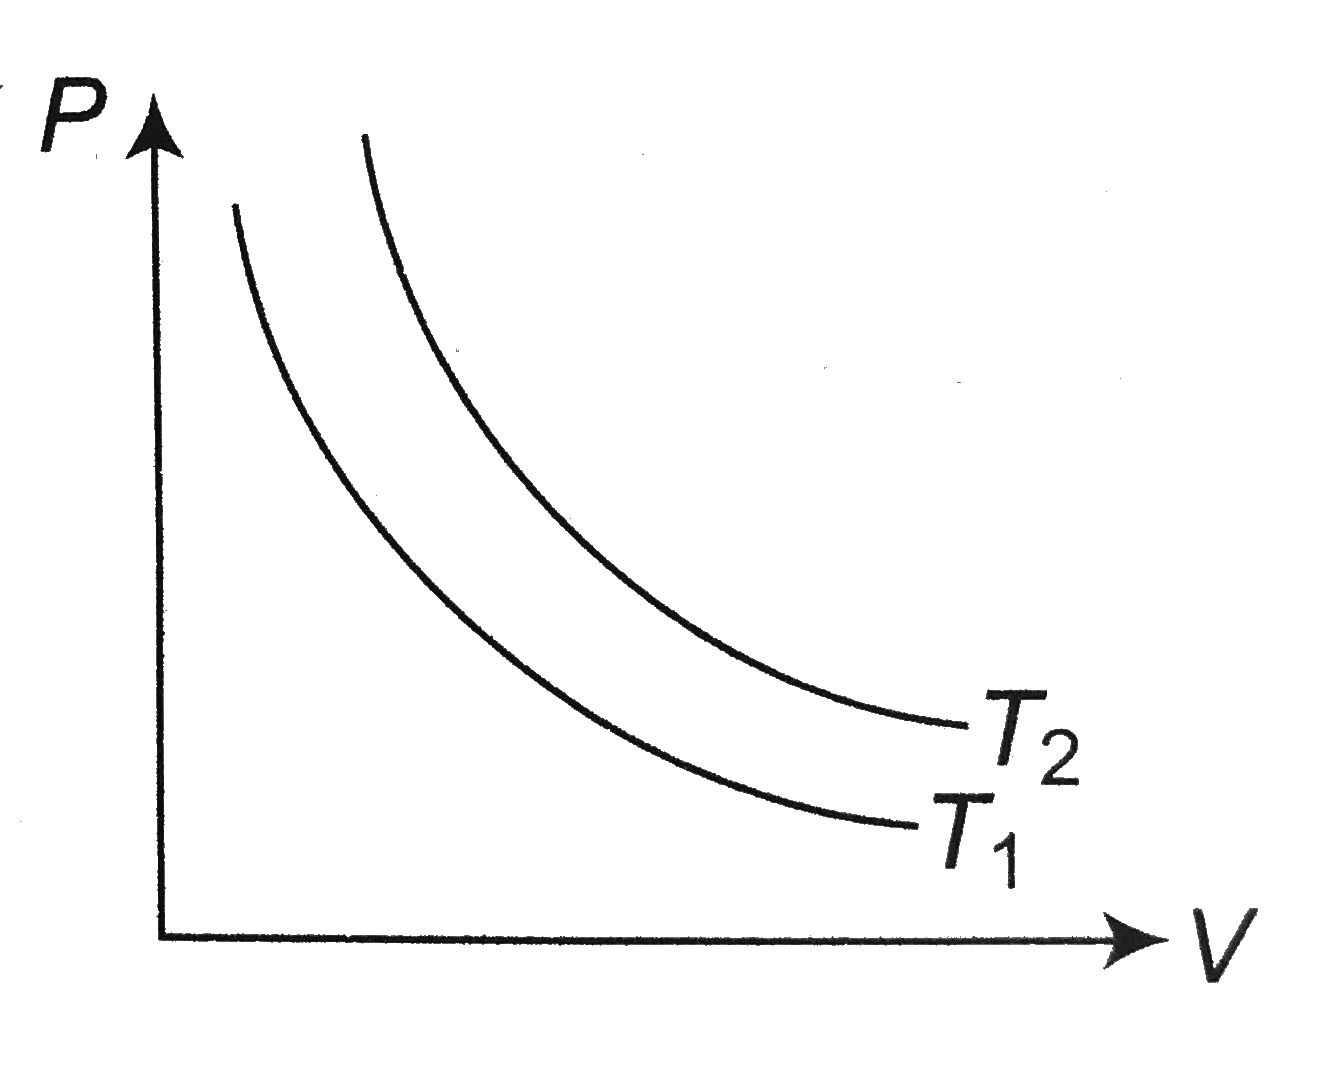
A
B
C
D
no inference can be drawn due to insufficient information
Video Solution
Text Solution
The correct Answer is:C
For a given pressure is small for . Since therefore, .
|
Topper's Solved these Questions
- KINETIC THEORY OF GASES AND THERMODYNAMICSBOOK - A2ZCHAPTER - KINETIC THEORY OF GASES AND THERMODYNAMICSEXERCISE - First Law Of Thermodynamics , Internal Energy And Work Done
55 Videos
- KINETIC THEORY OF GASES AND THERMODYNAMICSBOOK - A2ZCHAPTER - KINETIC THEORY OF GASES AND THERMODYNAMICSEXERCISE - Application Of First Law Of Thermodynamics In Different Situations
25 Videos
- KINETIC THEORY OF GASES AND THERMODYNAMICSBOOK - A2ZCHAPTER - KINETIC THEORY OF GASES AND THERMODYNAMICSEXERCISE - Chapter Test
29 Videos
- GRAVITATIONBOOK - A2ZCHAPTER - GRAVITATIONEXERCISE - Chapter Test
29 Videos
- MOCK TESTBOOK - A2ZCHAPTER - MOCK TESTEXERCISE - Motion With Constant Acceleration
15 Videos
Similar Questions
Knowledge Check
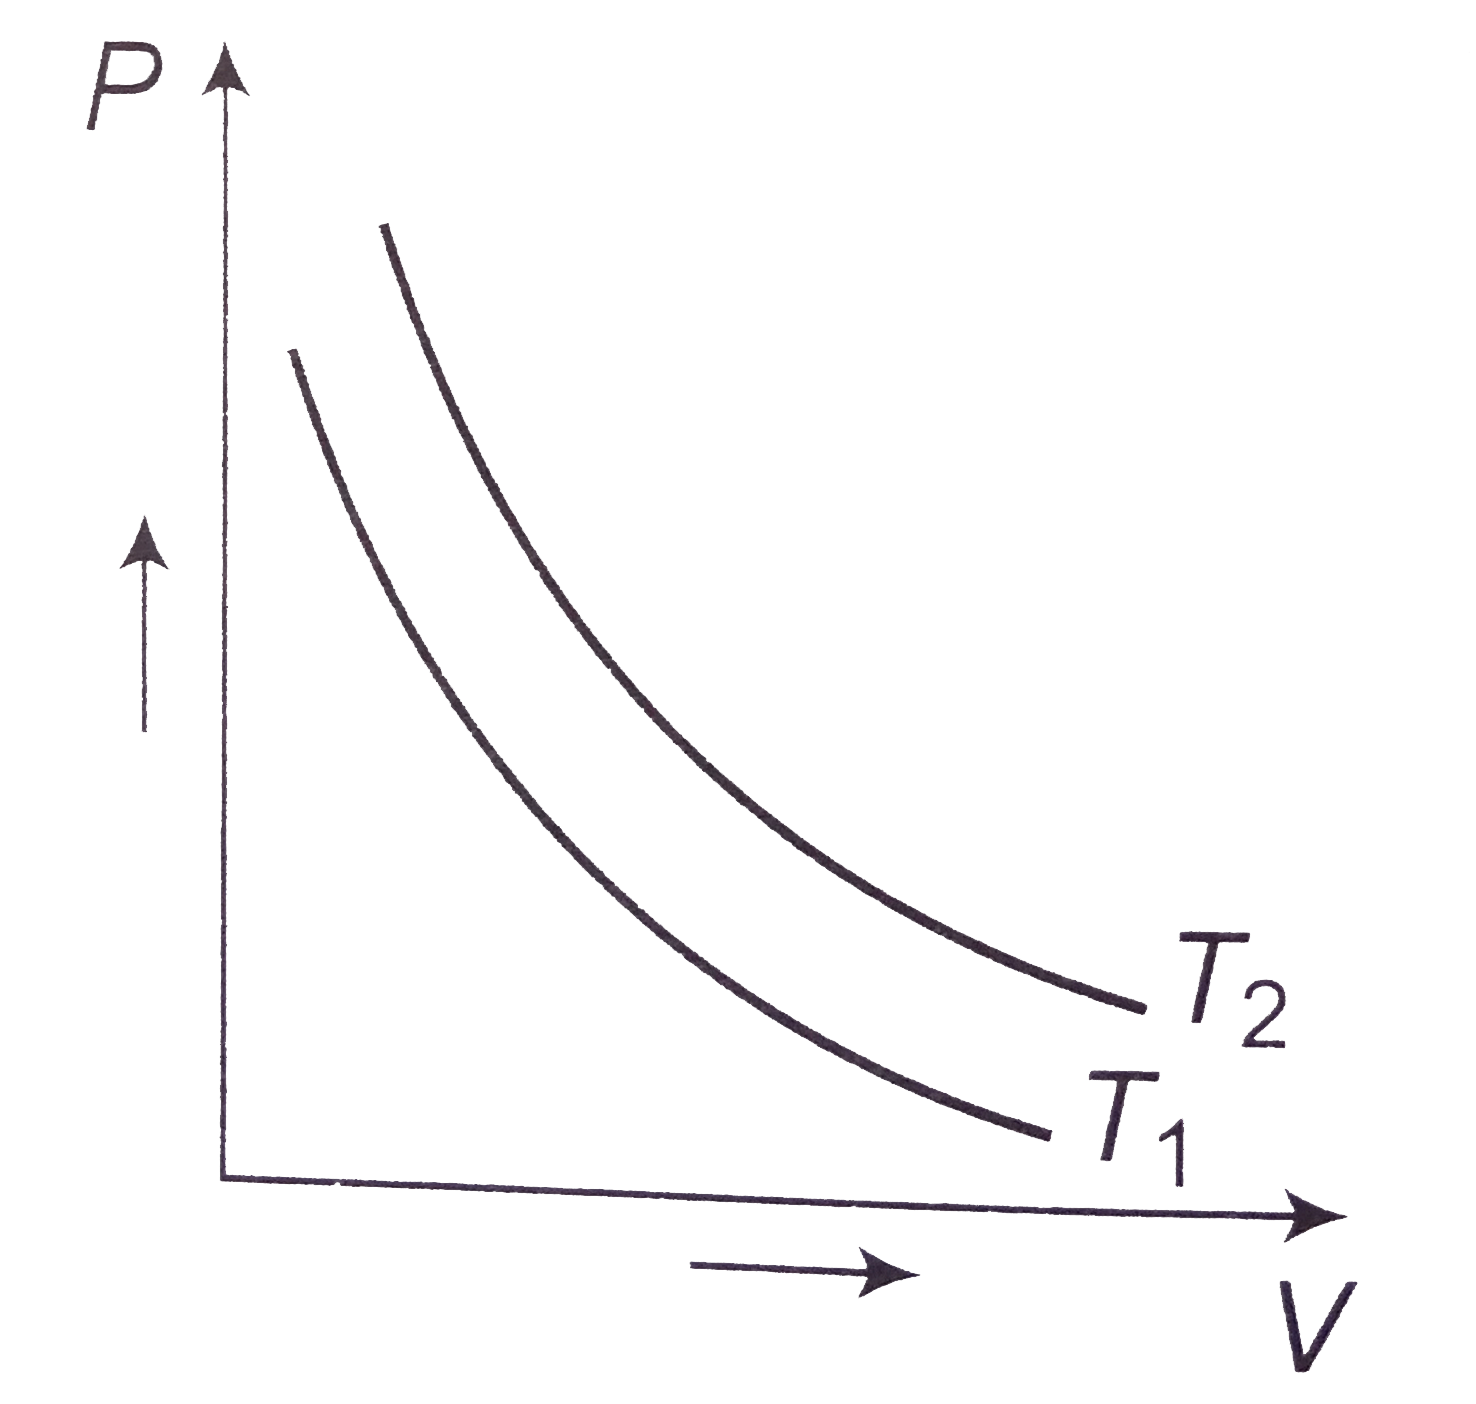
The adjoining figure shows graphs of pressure and volume of a gas at two temperature T1 and T2 Which of the following inferences is correct?AT1>T2BT1=T2CT1<T2DnoneFigure shows graphs of pressure vs density for an ideal gas at two temperature T1andT2. Which of the following is correct?
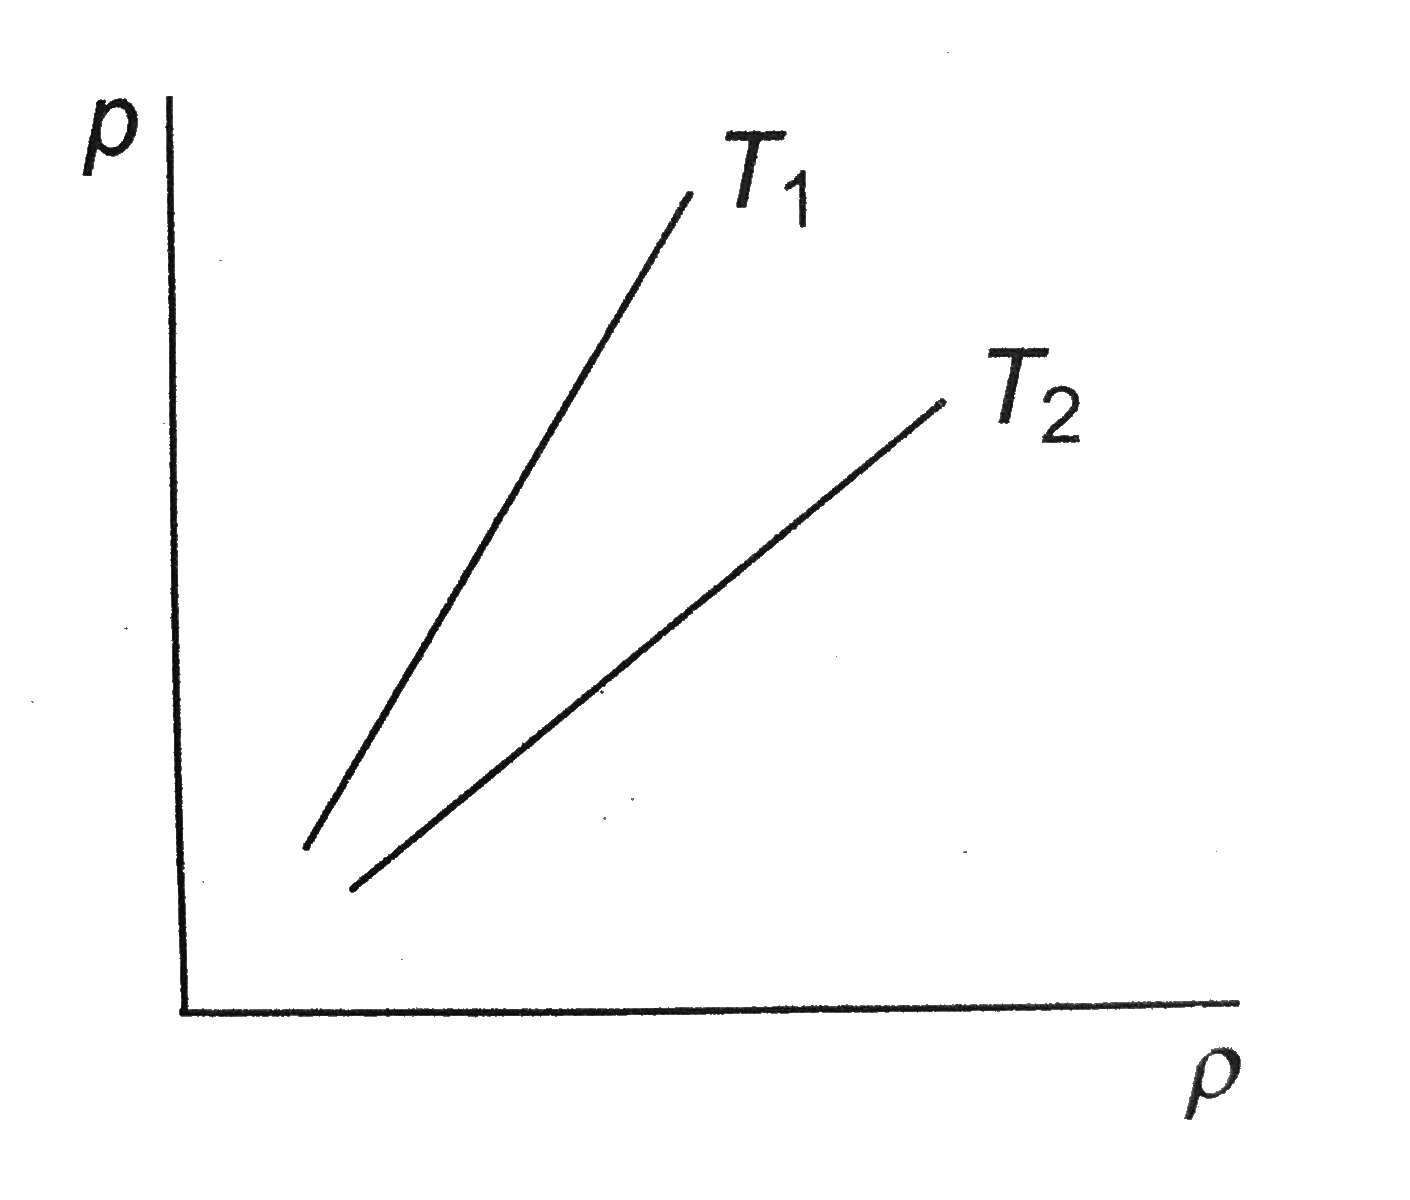 AT1>T2BT1=T2CT1<T2Dany of the three is possible
The adjoining fgure shows graph of pressure and volume of a gas at two temperatures T1 and T2 Which one the following is correct
 AT1>T2BT1=T2CT1<T2DNothing can be said about temperatures
The graph between pressure P and volume V for a given mass of a gas a fixed temperature T is a ________ .
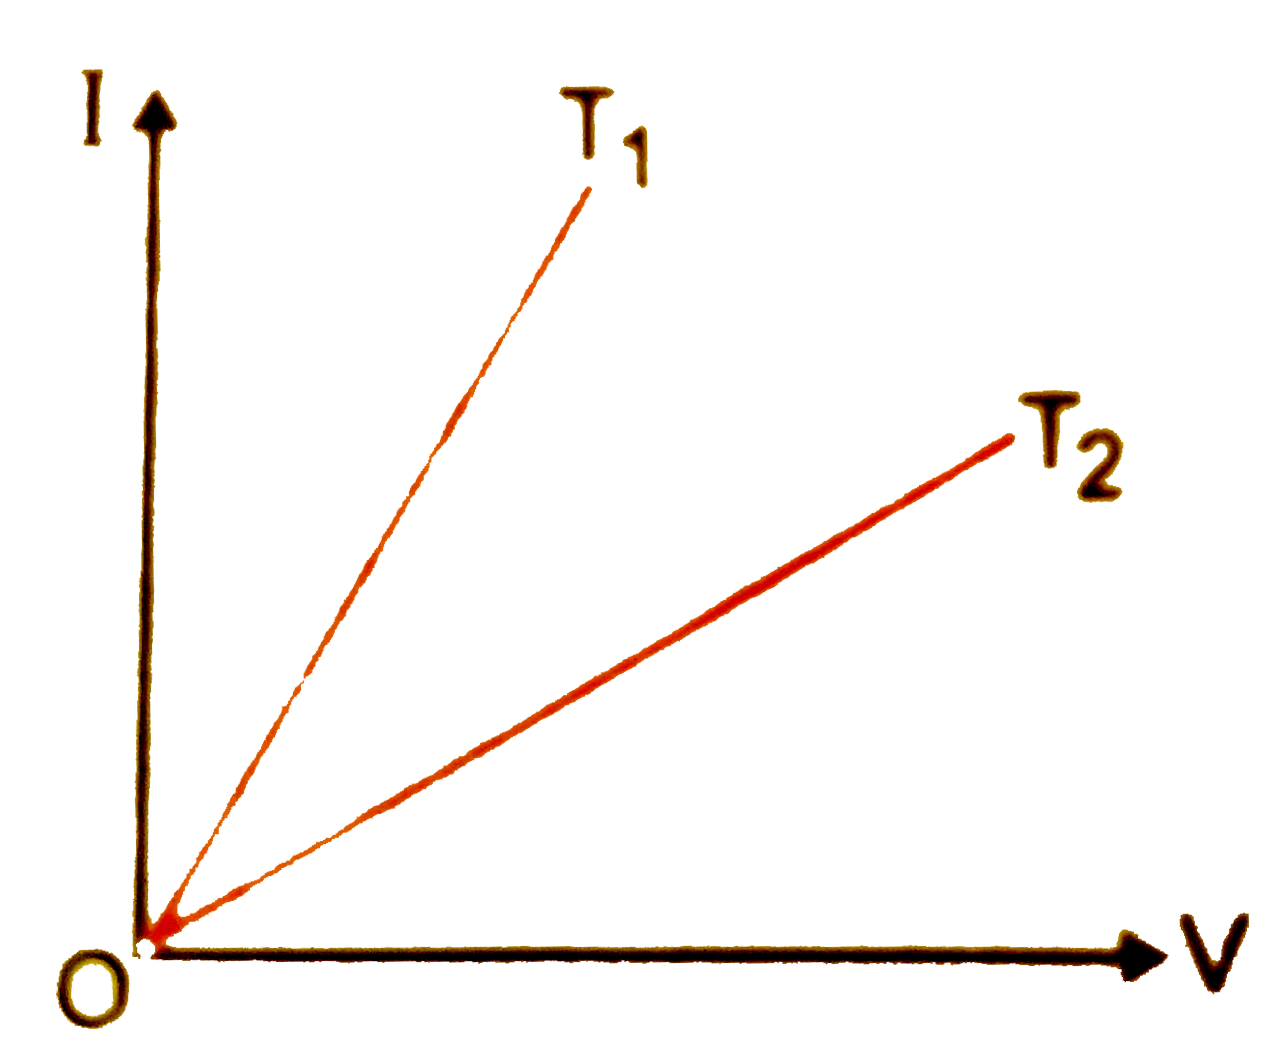
View SolutionV- I graph for a metallic wire at two different temperature T1 and T2 is shown in figure. Which of the two temperature is higher and why?
View SolutionShows graphs of pressure vs density for an ideal gas at two temperaturesT1andT2
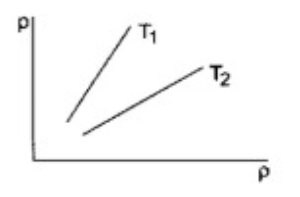
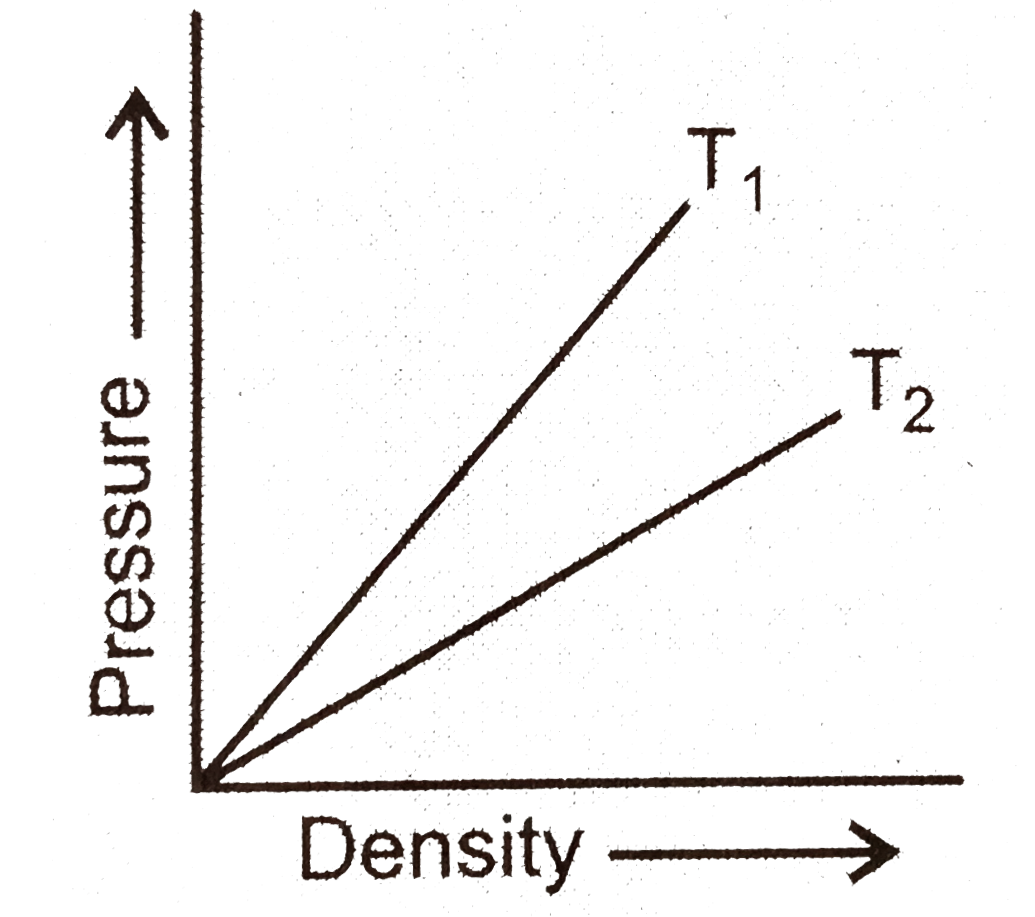
View SolutionFigure shows graphs of pressure versus density for an ideal gas at two temperatures T1 and T2 Which is correct ?
 .
.
View SolutionFigure shows graphs of pressure vs density for an ideal gas at two temperatures Tt and T2
View Solution

