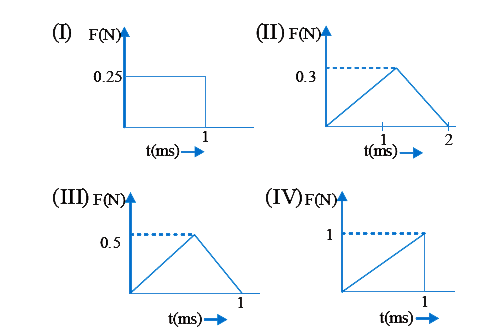
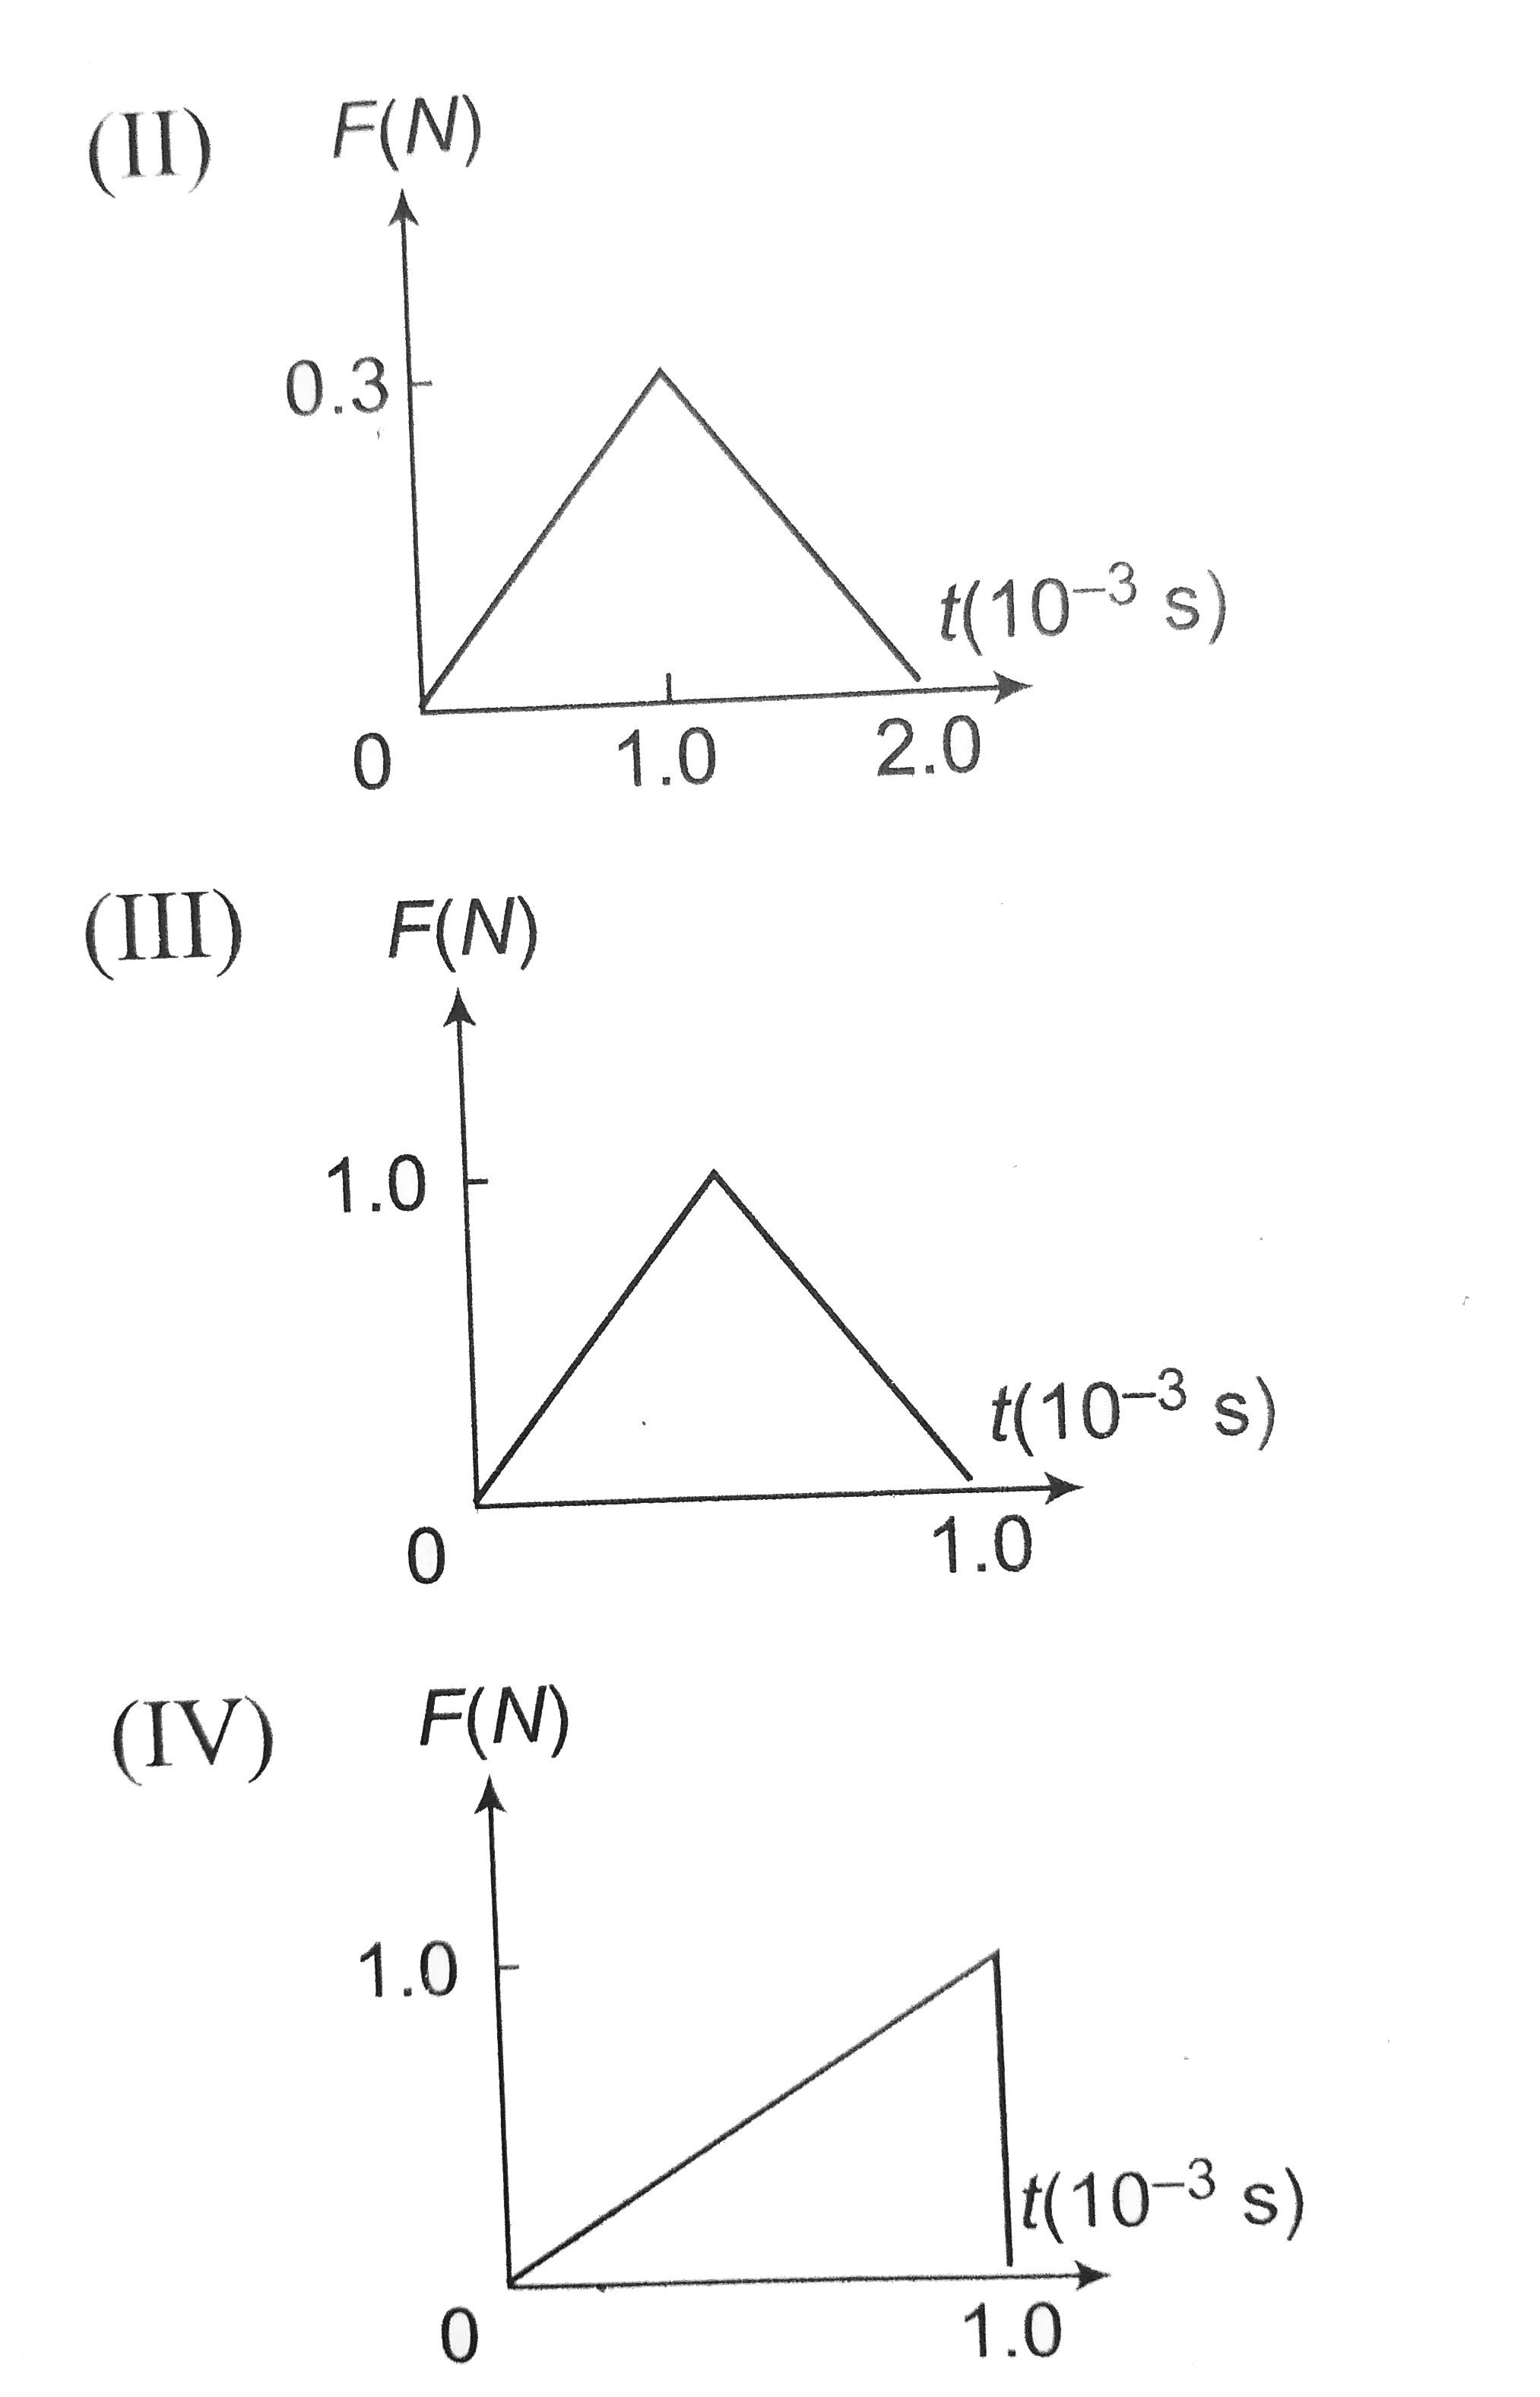
Figures I, II, III, and IV depict variation of force with time The impulse is hioghest in the case of situations depicted. Figure(s).
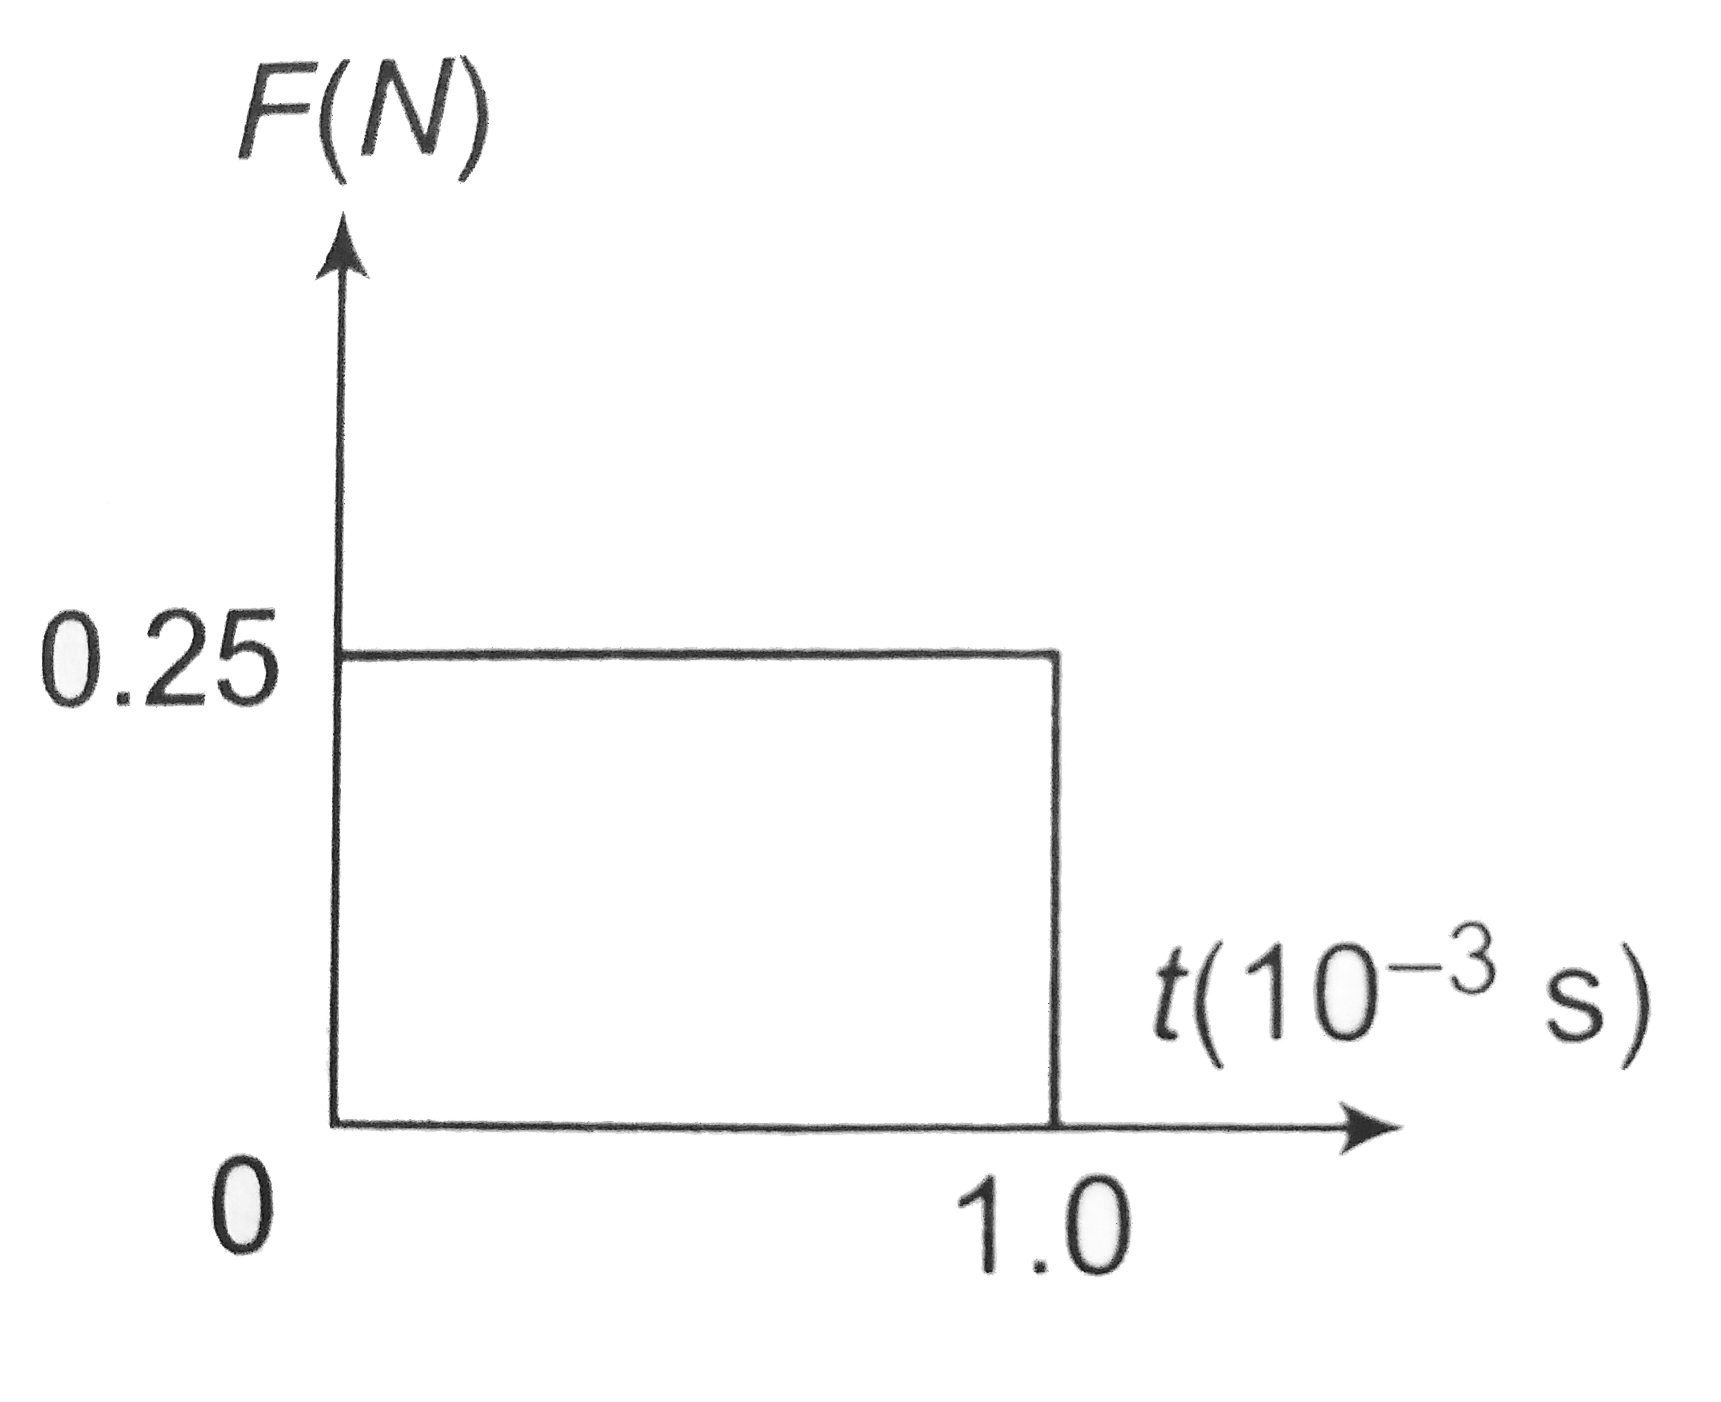 ,
, 
A
I and II
B
III and I
C
III and IV
D
IV only
Video Solution
Text Solution
The correct Answer is:C
|
Answer
Step by step video, text & image solution for Figures I, II, III, and IV depict variation of force with time The impulse is hioghest in the case of situations depicted. Figure(s). , by Physics experts to help you in doubts & scoring excellent marks in Class 11 exams.
Updated on:21/07/2023Topper's Solved these Questions
- NEWTONS LAWS OF MOTIONBOOK - ERRORLESS CHAPTER - NEWTONS LAWS OF MOTIONEXERCISE - Assertion & Reason
25 Videos
- NEWTONS LAWS OF MOTIONBOOK - ERRORLESS CHAPTER - NEWTONS LAWS OF MOTIONEXERCISE - Self Evaluation Test
16 Videos
- NEWTONS LAWS OF MOTIONBOOK - ERRORLESS CHAPTER - NEWTONS LAWS OF MOTIONEXERCISE - Critical Thinking
19 Videos
- MOTION IN TWO DIMENSIONBOOK - ERRORLESS CHAPTER - MOTION IN TWO DIMENSIONEXERCISE - Exercise
319 Videos
- ROTATIONAL MOTIONBOOK - ERRORLESS CHAPTER - ROTATIONAL MOTIONEXERCISE - Practice Problems (Problems based on motion of connected mass)
10 Videos
Similar Questions
Knowledge Check
Figures I, II, III, and IV depict variation of force with time. The impulse is highest in the case of situations depicted. Figure(s).
 ,
,  AI and IIBIII and ICIII and IVDIV only
The variation of displacement with respect to time is depicted in the following figure. The figure shows that
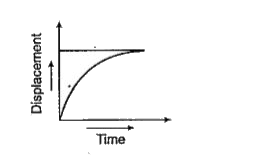 Aacceleration is constantBvelocity is constantCthe motion is acceleratedDthe motion is retarded and finally the particle stops
The variation of displacement with respect to time is depicted in the following figure. The figure shows that
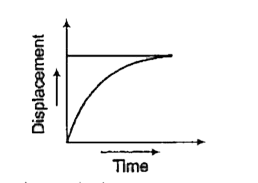 Aacceleration is canstantBvelocity is constantCthe motion is acceleratedDthe motion is retarded and finally the particle stops
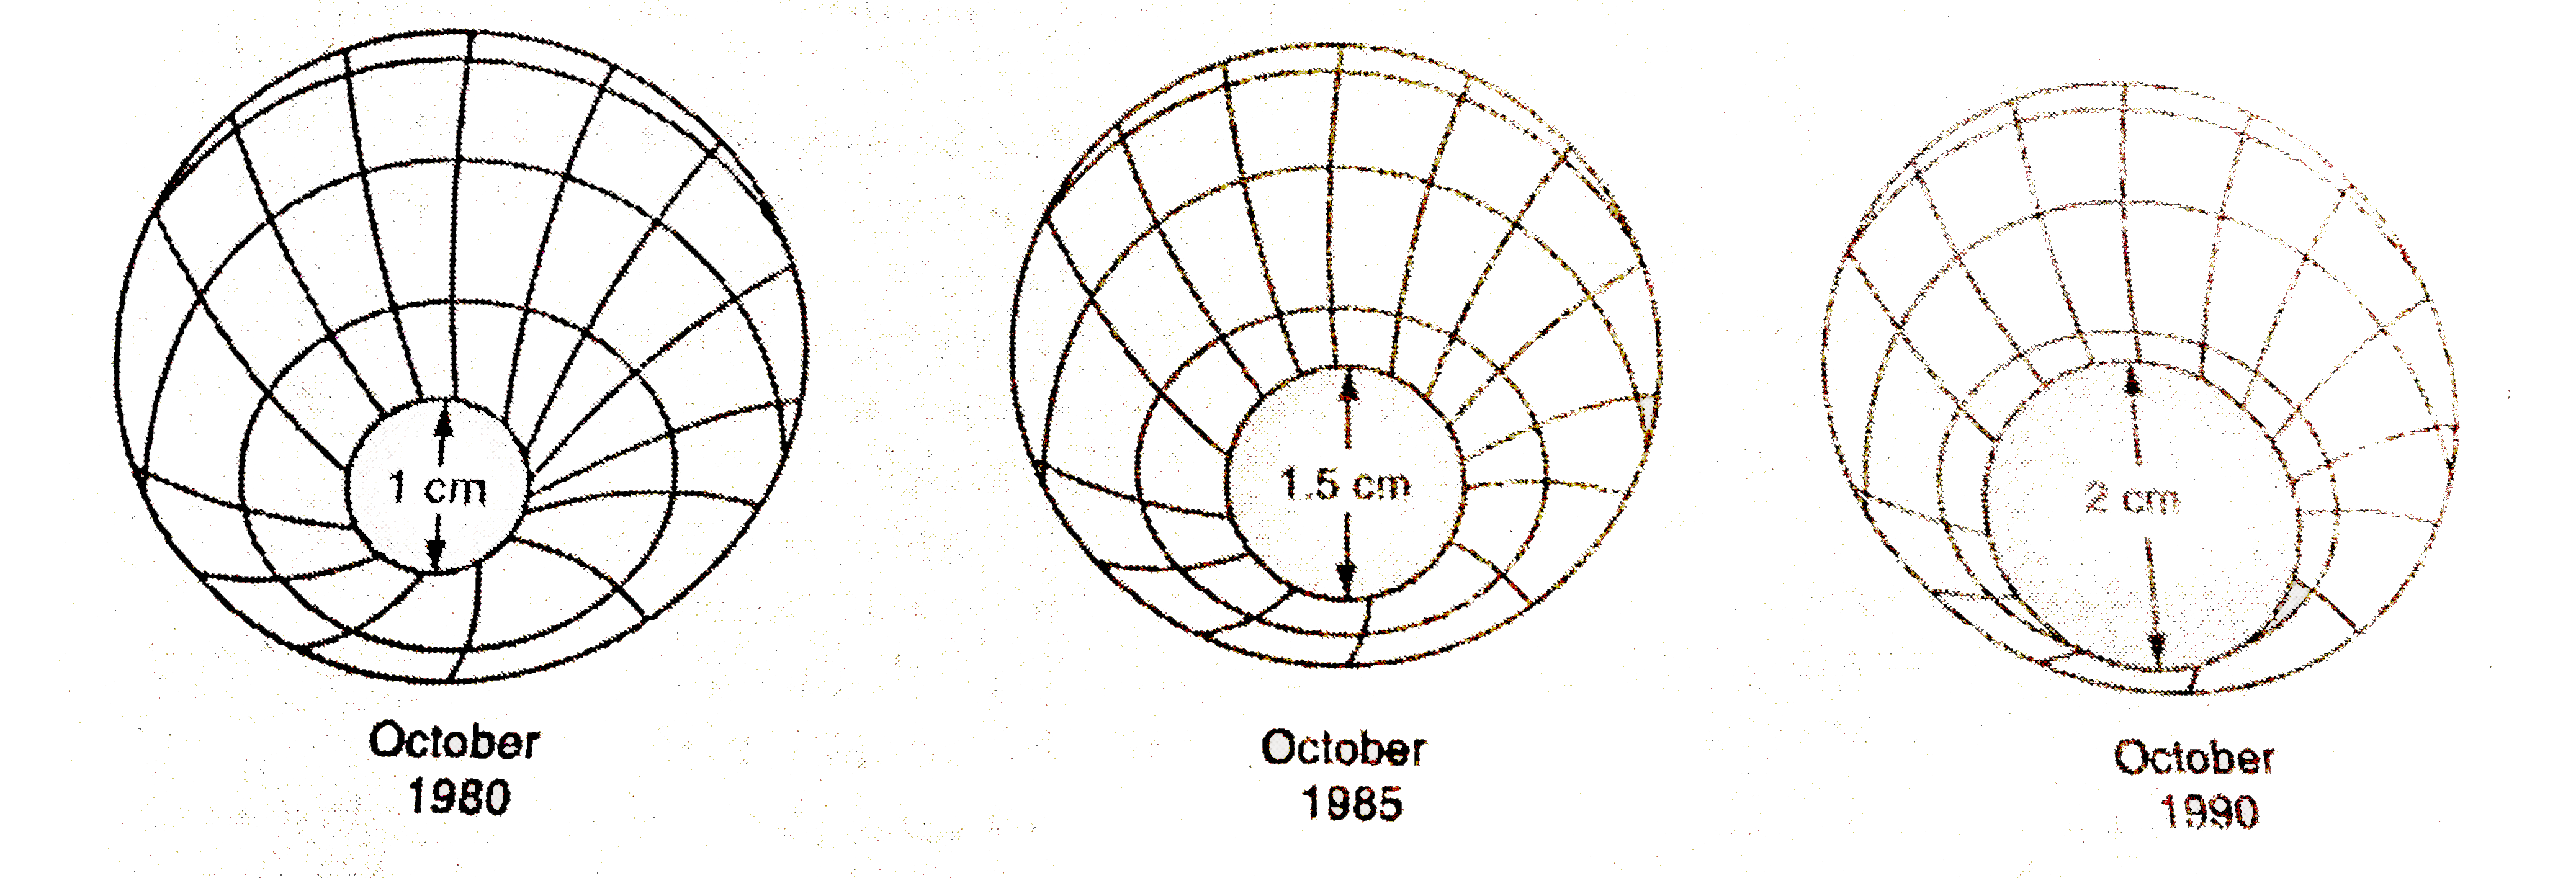
What does the following figure depict?
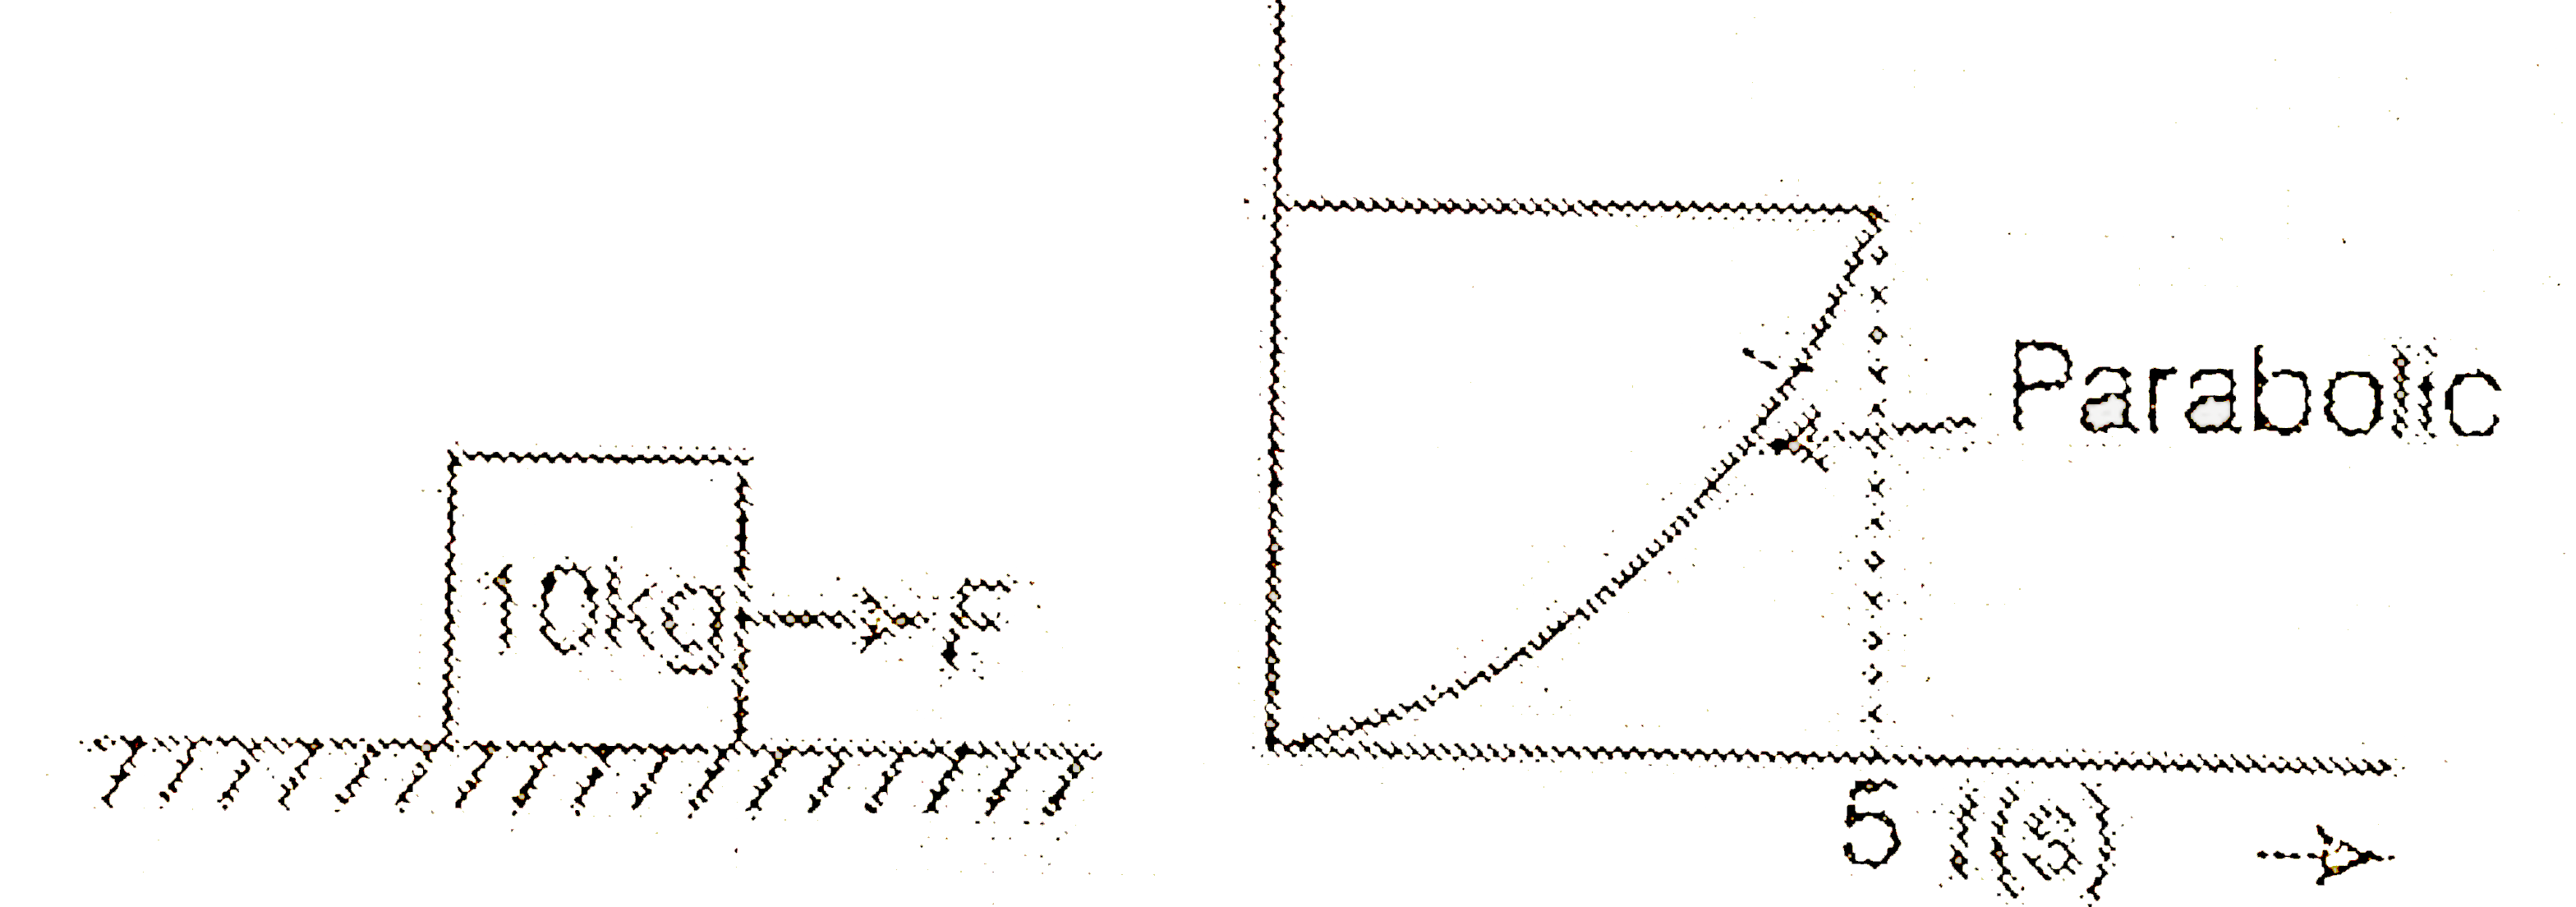
View SolutionA force F is applied to the initially, stationary cart. The variation of force with time is shown in the figure. The speed of cart at t = 5 s is
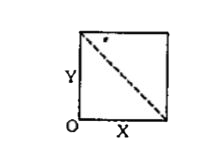
View SolutionWhat is the degree of correlation in the figure depicted below -
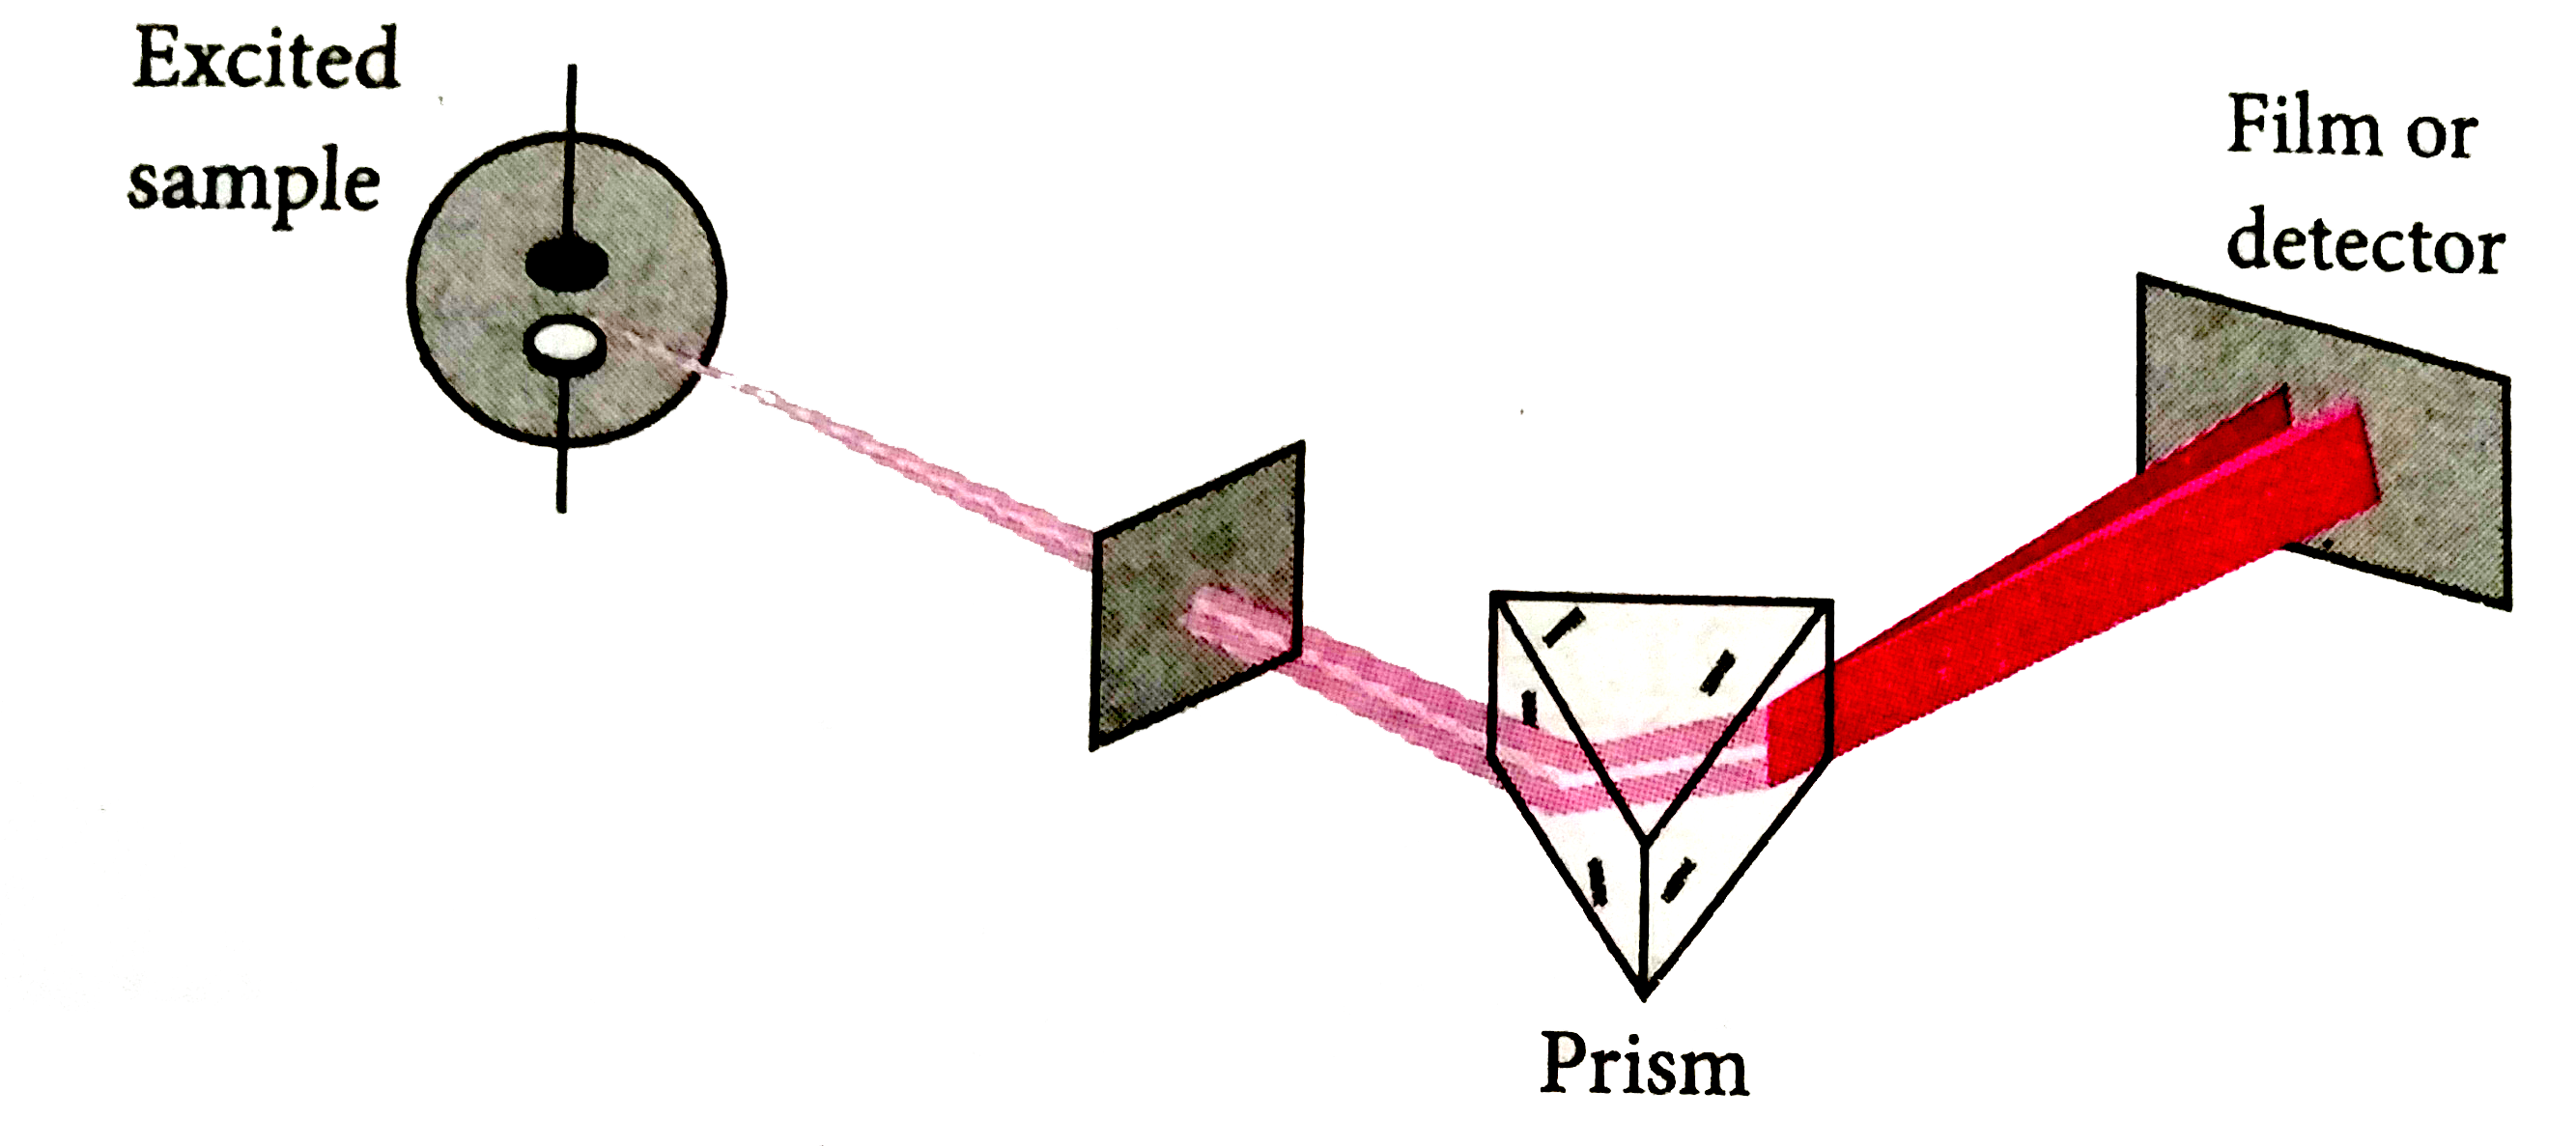
View SolutionWhich of the following types of spectrum is best depicted by the given figure?
View SolutionWhich analysis depicts the relationship between two figures :
View Solution

