Plot a graph of stopping potential versus frequency and outline how to find out Planck.s constant from it.
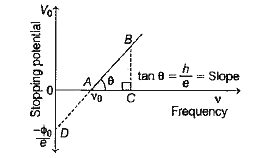
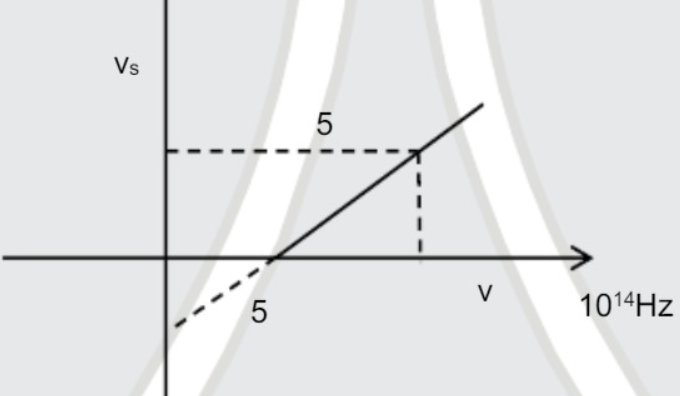
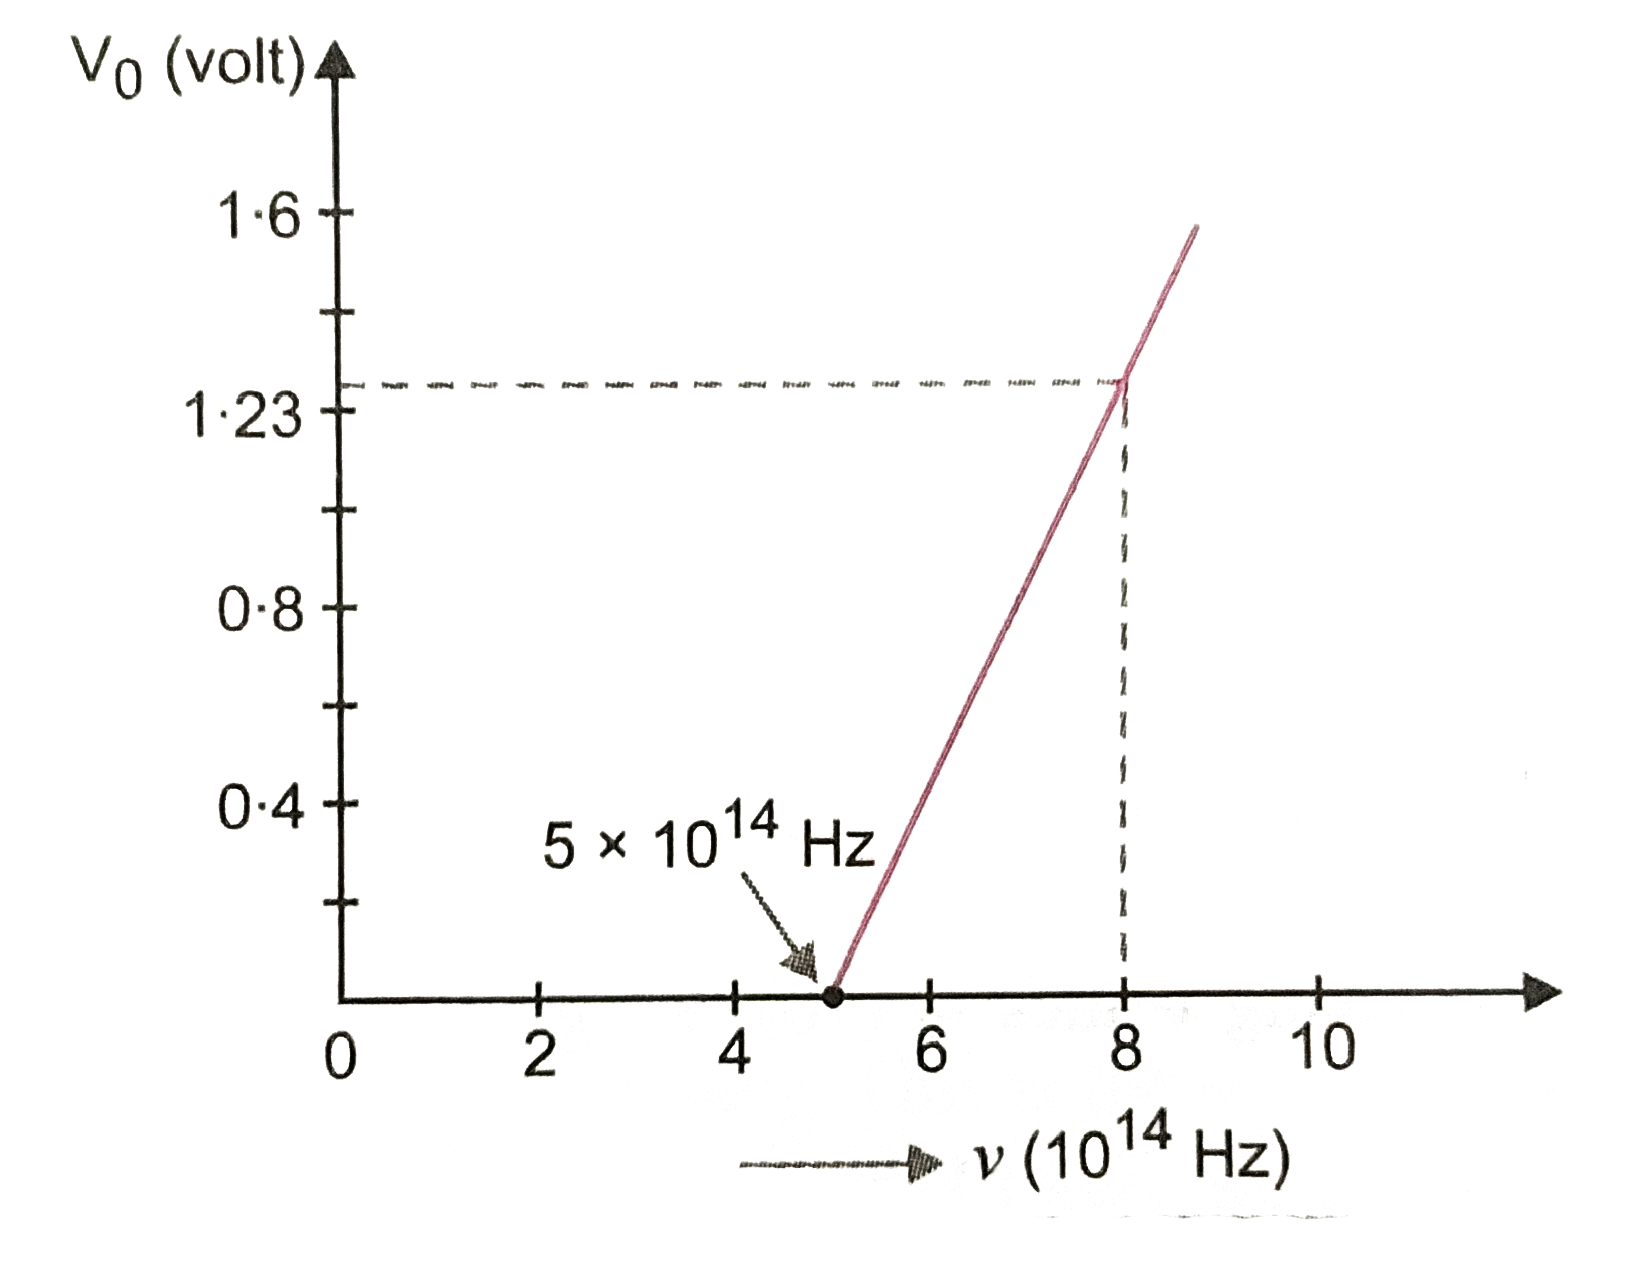
The graph between stopping potential and frequency is shown below.

As, hv=hv0+12mv2
or hv=hv0+eV0
∴eV0=hv−hv0
or V0=hve−hv0e
Comparing with straight line equation,
y=mx+c
we get, slope =m=he
and intercept = −hv0e=φ0e
Thus, value of h can be determined.
Similar Questions
Figure shows the graph of stopping potential verus that frequency of a photosensitive metal. The plank's constant and work funcation of the metal are
_S01_035_Q01.png)
View Solution
Using the graph shown in the figure for stopping potential vs. the incident frequency of photons, calculate Planck.s constant.
View Solution
Knowledge Check
Figure shows the graph of stopping potential verus that frequency of a photosensitive metal. The plank's constant and work funcation of the metal are
_S01_035_Q01.png) A(V2+V1v2+v2)e,(V2v1+V1v2v2+v1)eB(V2+V1v2−v1)e,(V2v1+V1v2v2−v1)eC(V2−V1v2+v1)e,(V2v1−V1v2v2+v1)eD(V2−V1v2−v1)e,(V2v1−V1v2v2−v1)e
A(V2+V1v2+v2)e,(V2v1+V1v2v2+v1)eB(V2+V1v2−v1)e,(V2v1+V1v2v2−v1)eC(V2−V1v2+v1)e,(V2v1−V1v2v2+v1)eD(V2−V1v2−v1)e,(V2v1−V1v2v2−v1)eIn photoelectric effect experiment, the slope of the graph of the stopping potential versus frequency gives the value of :
AheBhCehDhceGraph between stopping potential and frequency of light as shown find the work function
 A4.01 evB2.07 evC5.01 evD2.09 ev
Using the graph shown in fig for stopping potential vs the incident frequency of photons, calculate Planck's constant.

View SolutionGraph between stopping potential and frequency of light as shown find the work function

View SolutionThe work function of Silver and Sodium are 5eV and 2.5eV,respectively.The ratio of slope of the stopping potential versus frequency plot for Silver to that of Sodium is
View Solution(i) Plot a labelled graph of |Vs| where Vs is stopping potential versus frequency f of the incident radiation.
(ii) State how will you use this graph to determine the value of Planck.s constant.
View SolutionIn photo electric effect, the slope of the straight line graph between stopping potential and frequency of the incident light gives the ratio of Planck's constant to
View Solution
