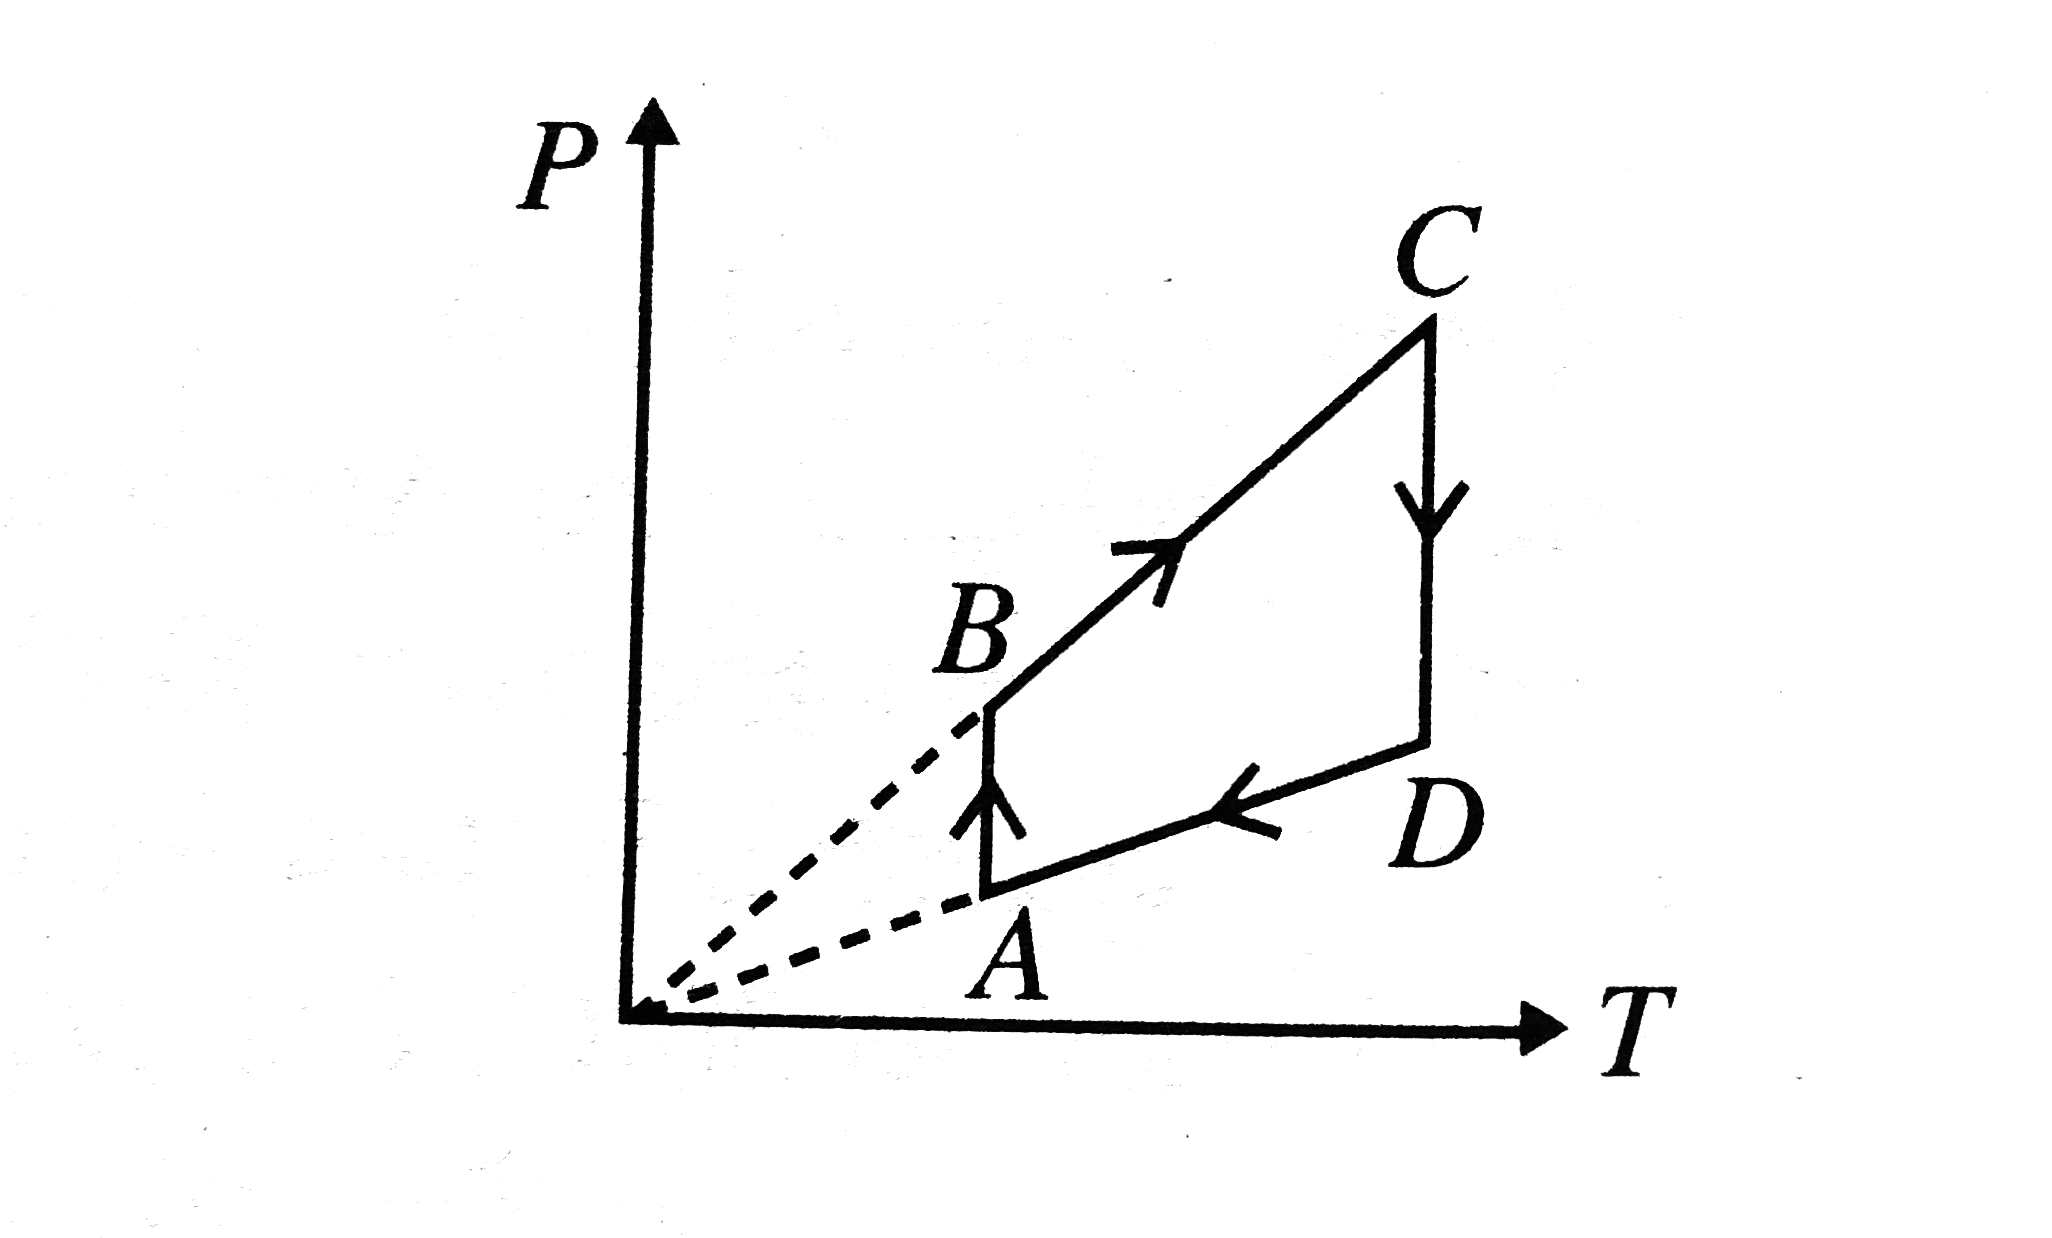
Pressure versus temperature graph of an ideal gas of equal number of moles of different volumes is plotted as shown in Fig. Choose the correct alternative.
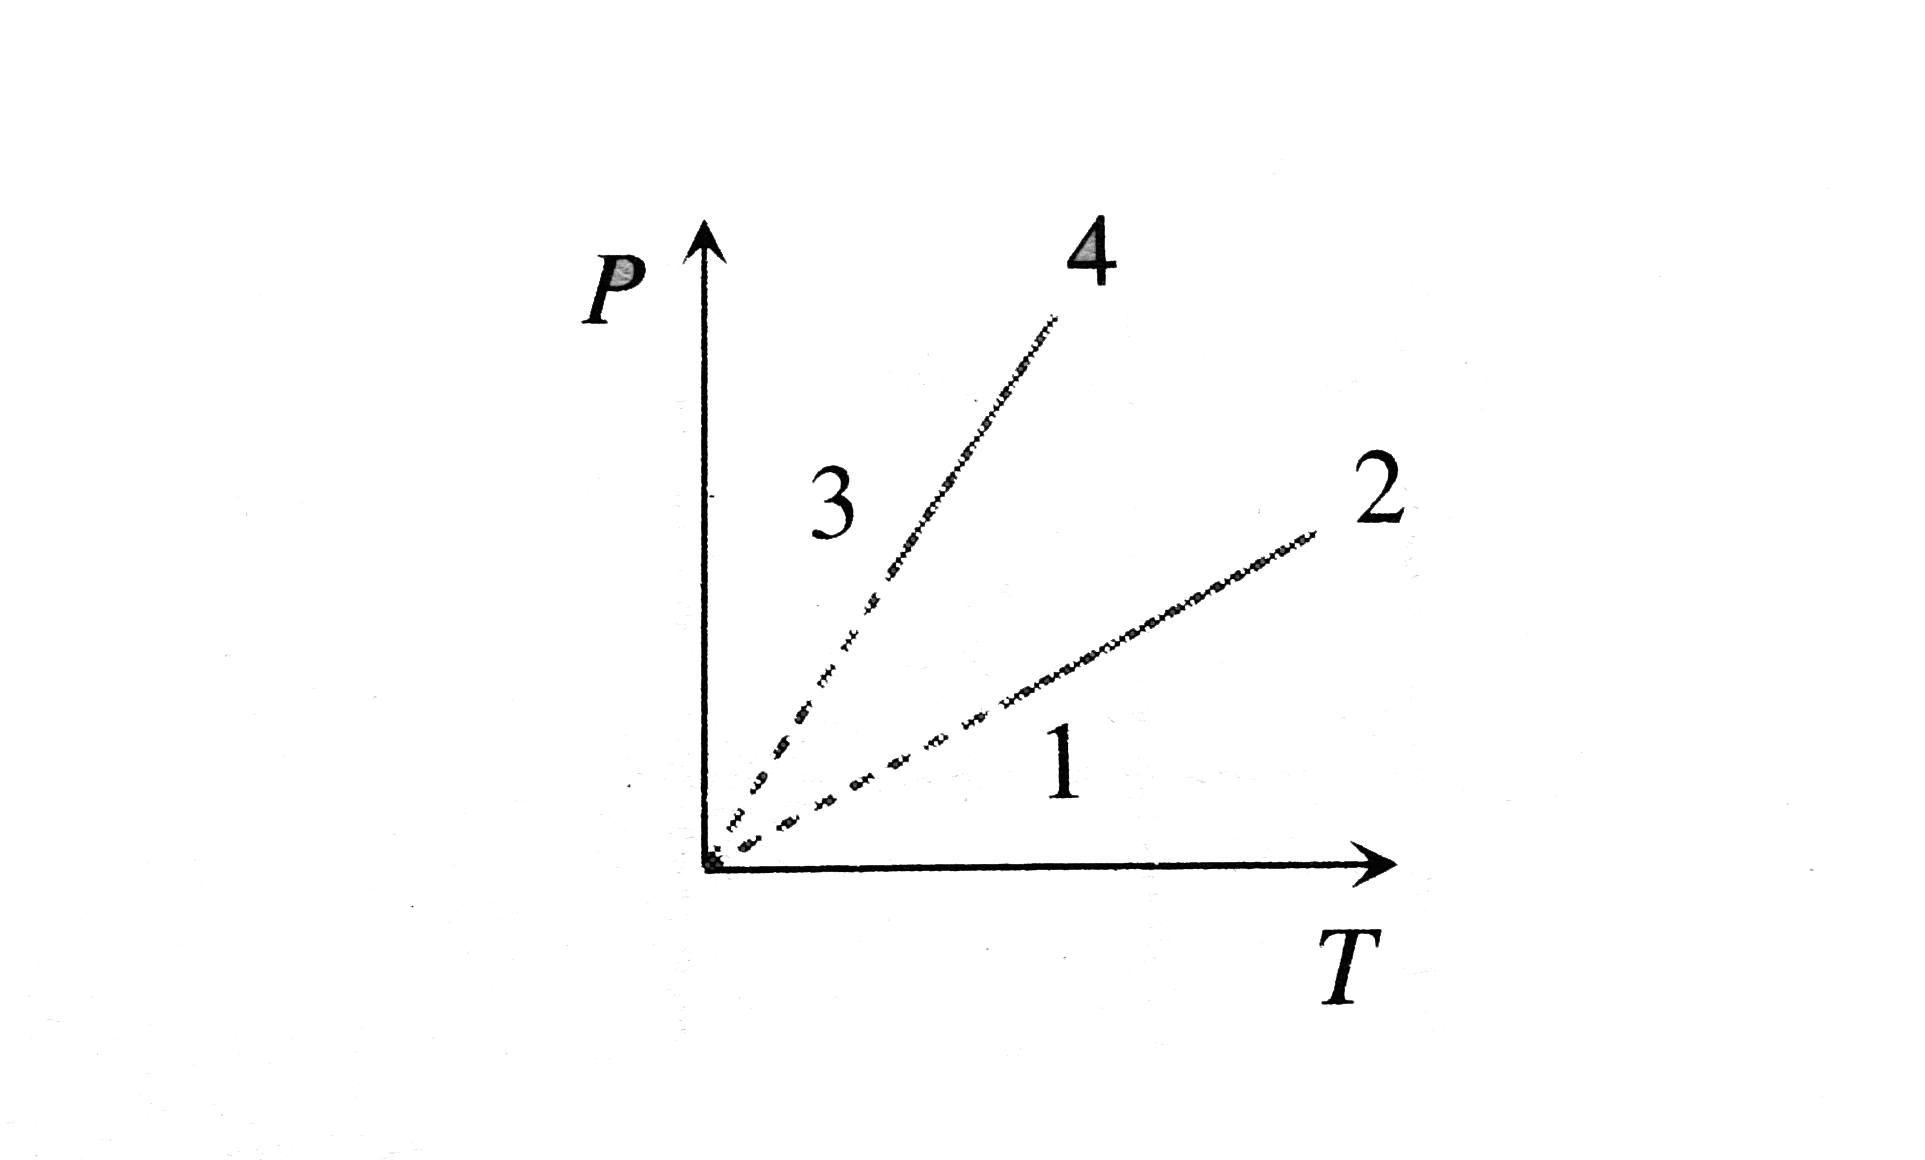
V1=V2,V3=V4 and V2>V3
V1=V2,V3=V4 and V2<V3
V1=V2,V3=V4
V4=V3>V2>V1
The correct Answer is:A
a. From ideal gas equation,
PV=μRT
∴P=μRTVT
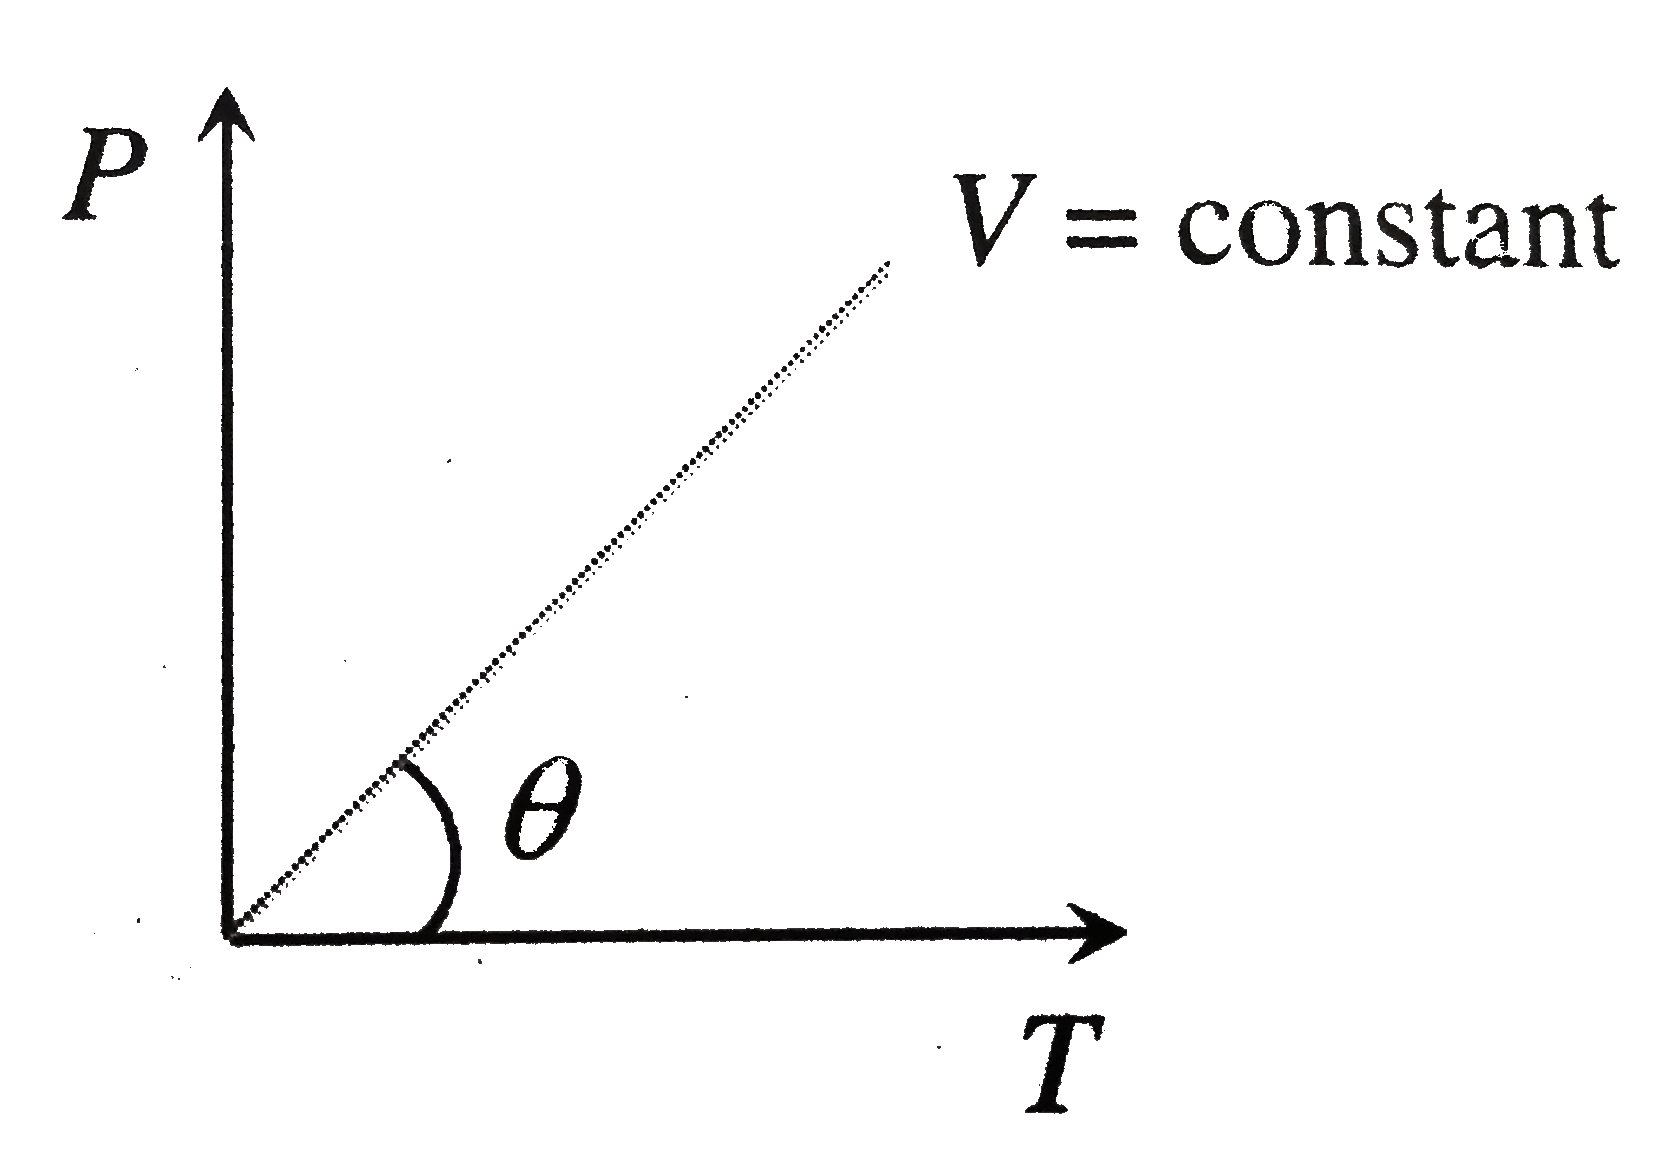
Comparing, this equation with y=mx
slope of line, tanθ=mμR/V
i.e., V∝1tanθ
It means line of smaller slope represents greater volume of gas
For the given problem figue
Point 1 and 2 are on the same line, so they will represent same volume, i.e., V1=V2
Similarly point 3 and 4 are on the same line, so they will represent same volume V3=V4, ltbRgt But V1>V3(=V4 or V2>V3=V4 as slope of line −2 is less than that of 3-4.
Topper's Solved these Questions
- BOOK - CENGAGE PHYSICSCHAPTER - KINETIC THEORY OF GASES AND FIRST LAW OF THERMODYNAMICSEXERCISE - Multiple Corrects29videos
KINETIC THEORY OF GASES AND FIRST LAW OF THERMODYNAMICS
- BOOK - CENGAGE PHYSICSCHAPTER - KINETIC THEORY OF GASES AND FIRST LAW OF THERMODYNAMICSEXERCISE - Assertion-Reasoning6videos
KINETIC THEORY OF GASES AND FIRST LAW OF THERMODYNAMICS
- BOOK - CENGAGE PHYSICSCHAPTER - KINETIC THEORY OF GASES AND FIRST LAW OF THERMODYNAMICSEXERCISE - Subjective22videos
KINETIC THEORY OF GASES AND FIRST LAW OF THERMODYNAMICS
- BOOK - CENGAGE PHYSICSCHAPTER - KINETIC THEORY OF GASESEXERCISE - Compression2videos
KINETIC THEORY OF GASES
- BOOK - CENGAGE PHYSICSCHAPTER - LINEAR AND ANGULAR SIMPLE HARMONIC MOTIONEXERCISE - Multiple Correct Answer Type9videos
LINEAR AND ANGULAR SIMPLE HARMONIC MOTION
Similar Questions
Knowledge Check
- Question 1 - Select One
Pressure versus temperature graph of an ideal gas of equal number of moles of different volumes is plotted as shown in figure. Choose the correct alternatives.
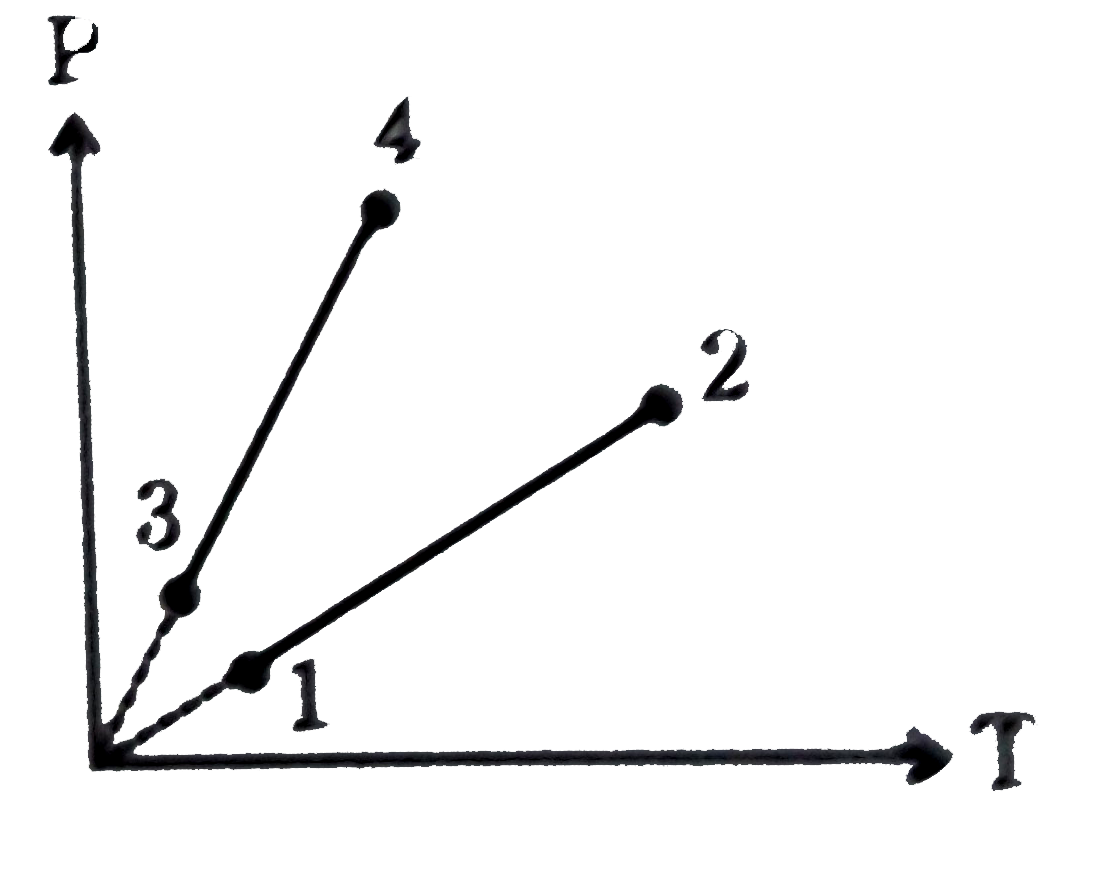 AV1=V2,V3=V4 and V2>V3BV1=V2,V3=V4 and V2<V3CV1=V2=V3=V4DV4>V3>V2>V1
 - Question 2 - Select One
Pressure versus density graph of an ideal gas is shown in figure
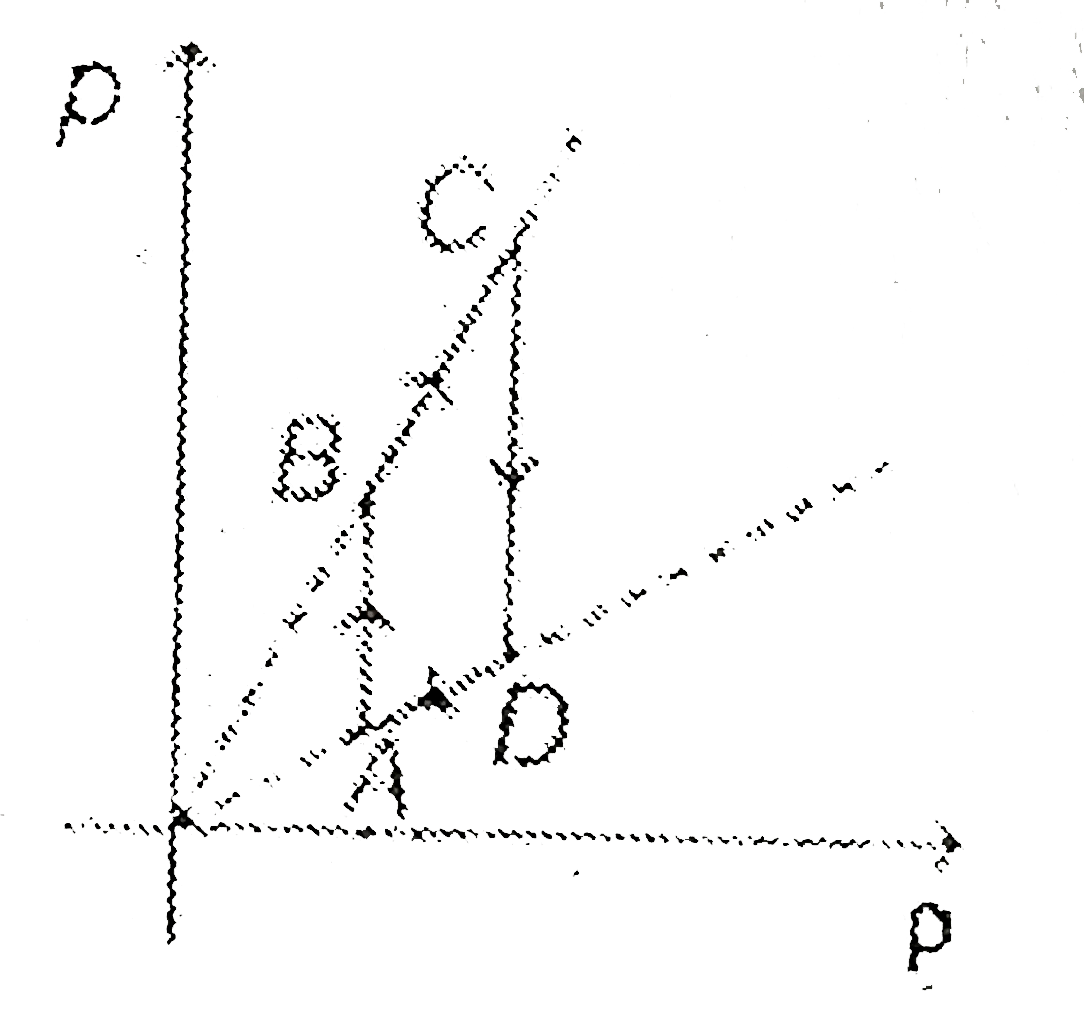 Aduring the process AB work done by the gas is positiveBduring the process AB work done by the gas is negativeCduring the process BC internal energy of the gas is increasingDNone of the above
 - Question 3 - Select One or More
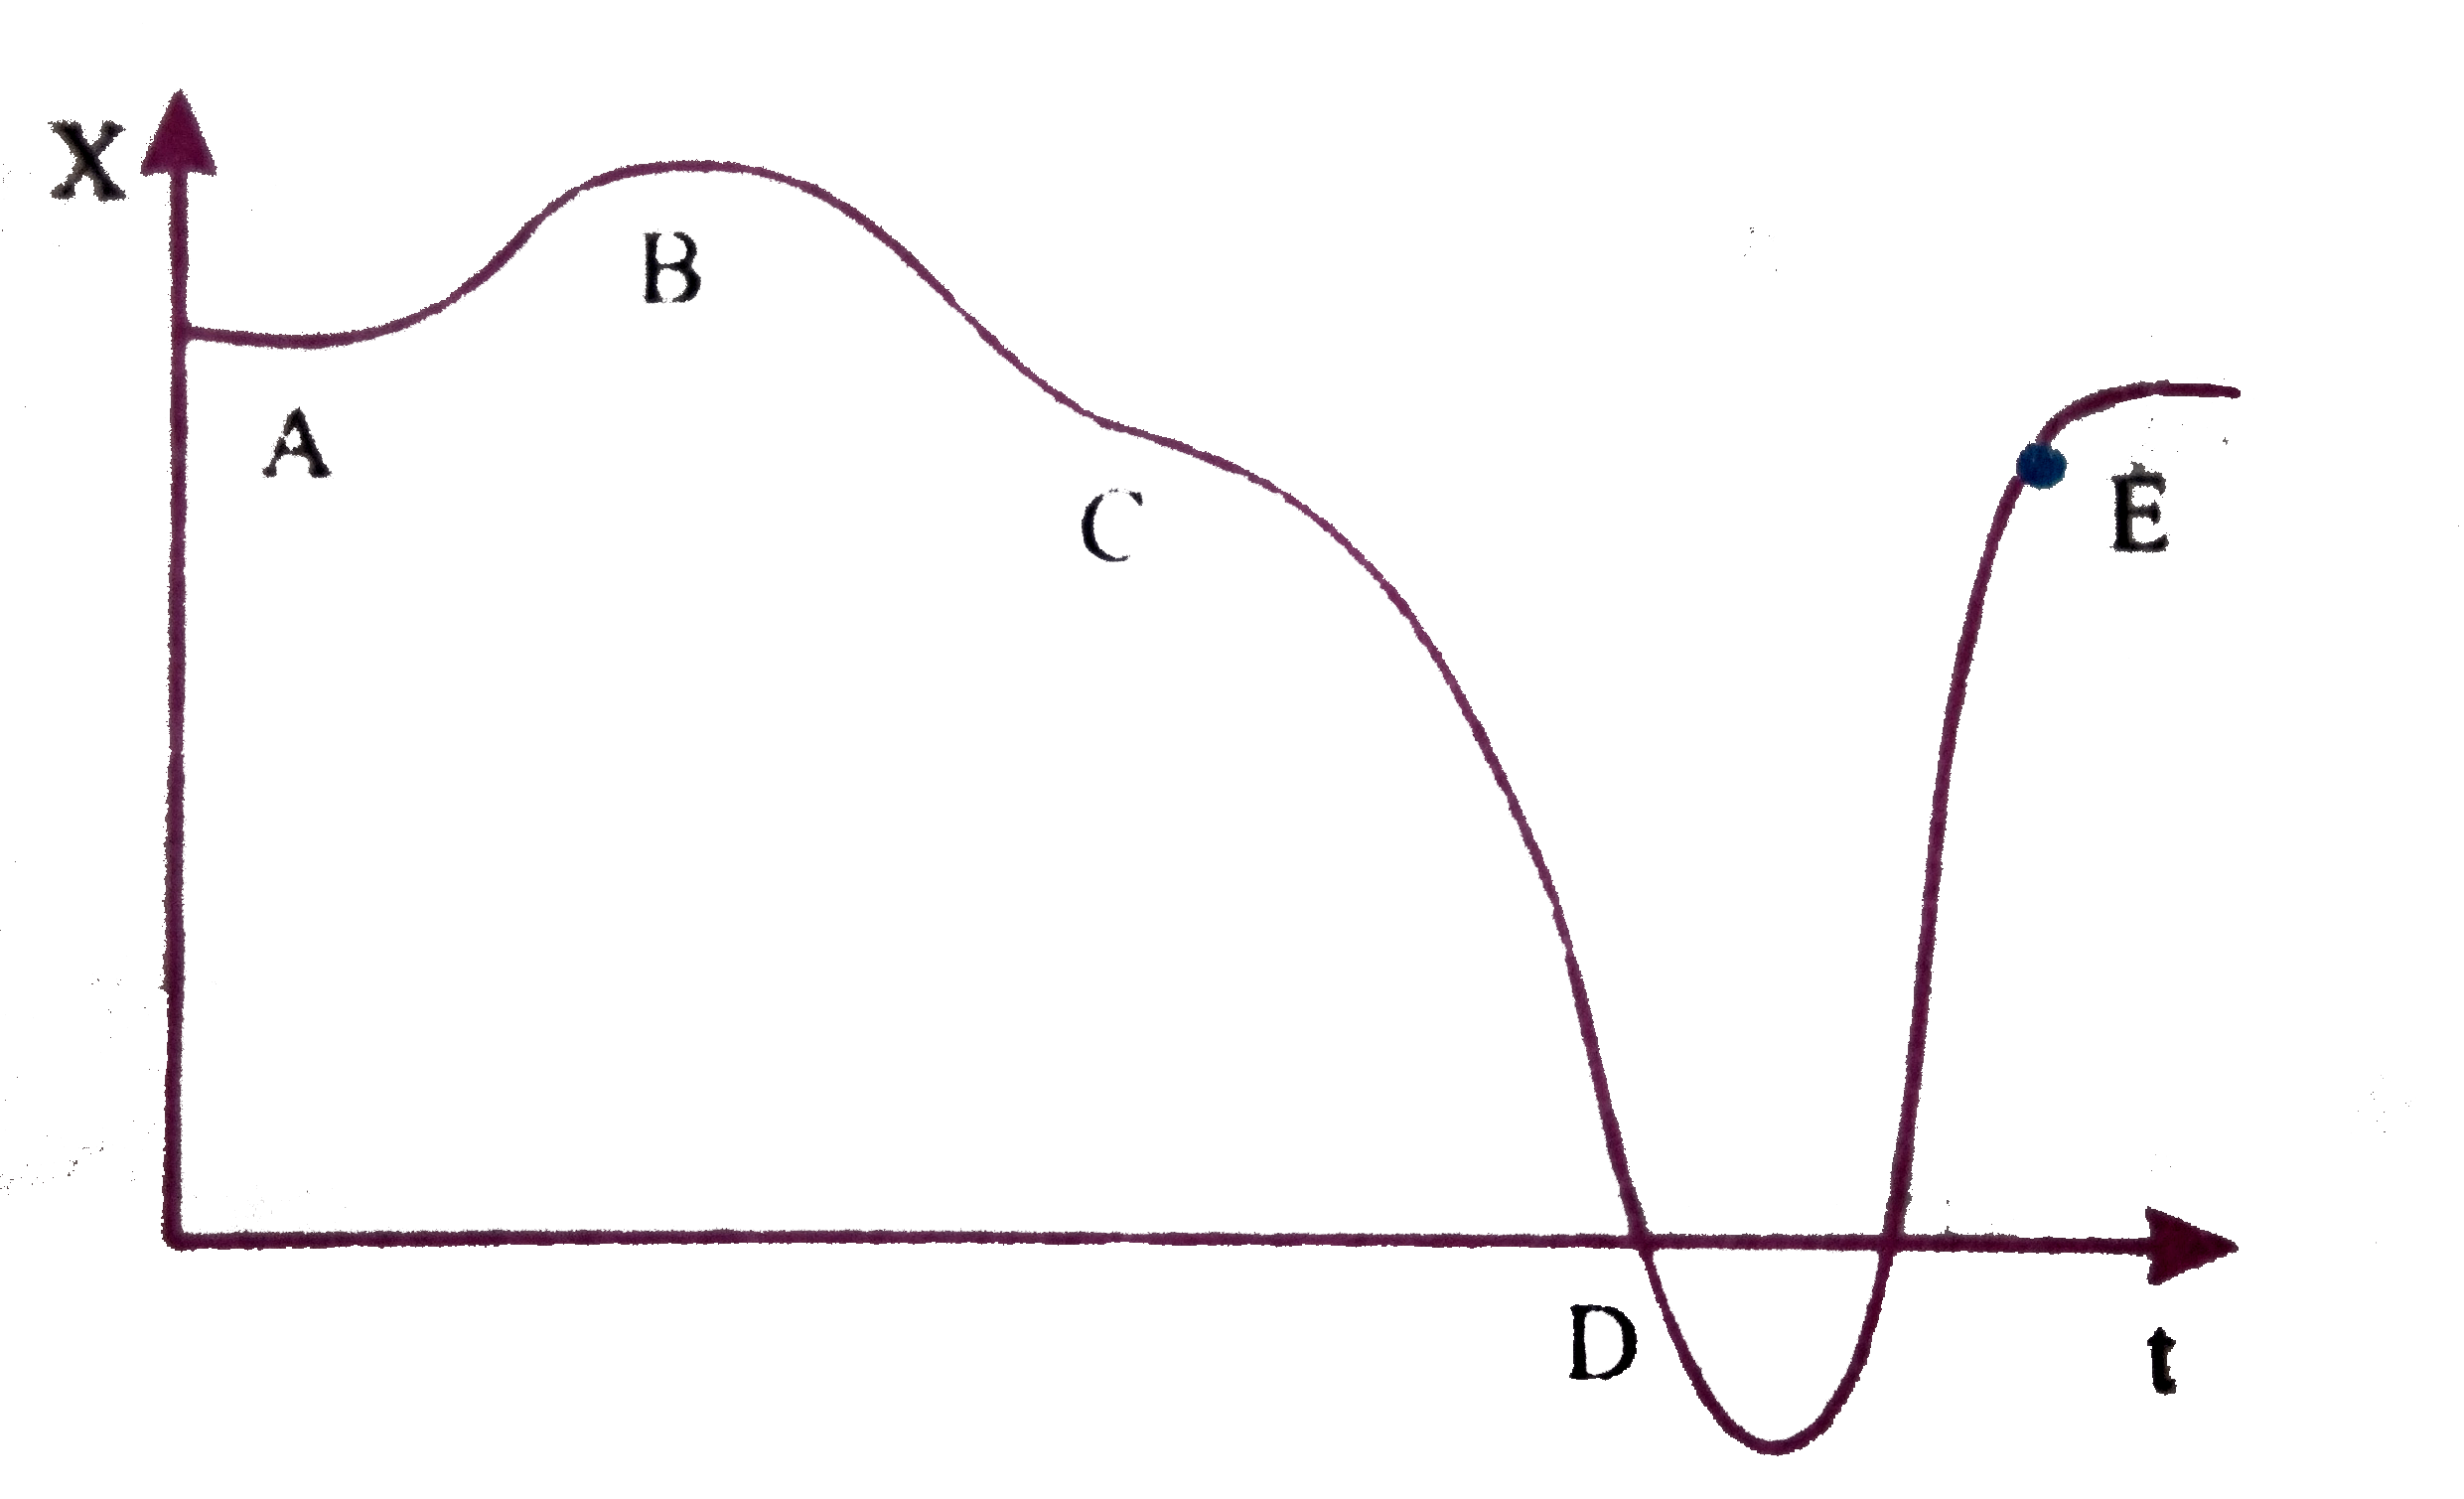
A graph of x versus t is shown in figure. Choose correct alternative from below.AThe particle was released from rest at t=0BAt B, the accleration a>0CAverage velocity for the motion between A and D is positive.DThe speed at D exceeds that at E.
Pressure versus temperature graphs of an ideal gas are as shown in figure. Choose the wrong statement
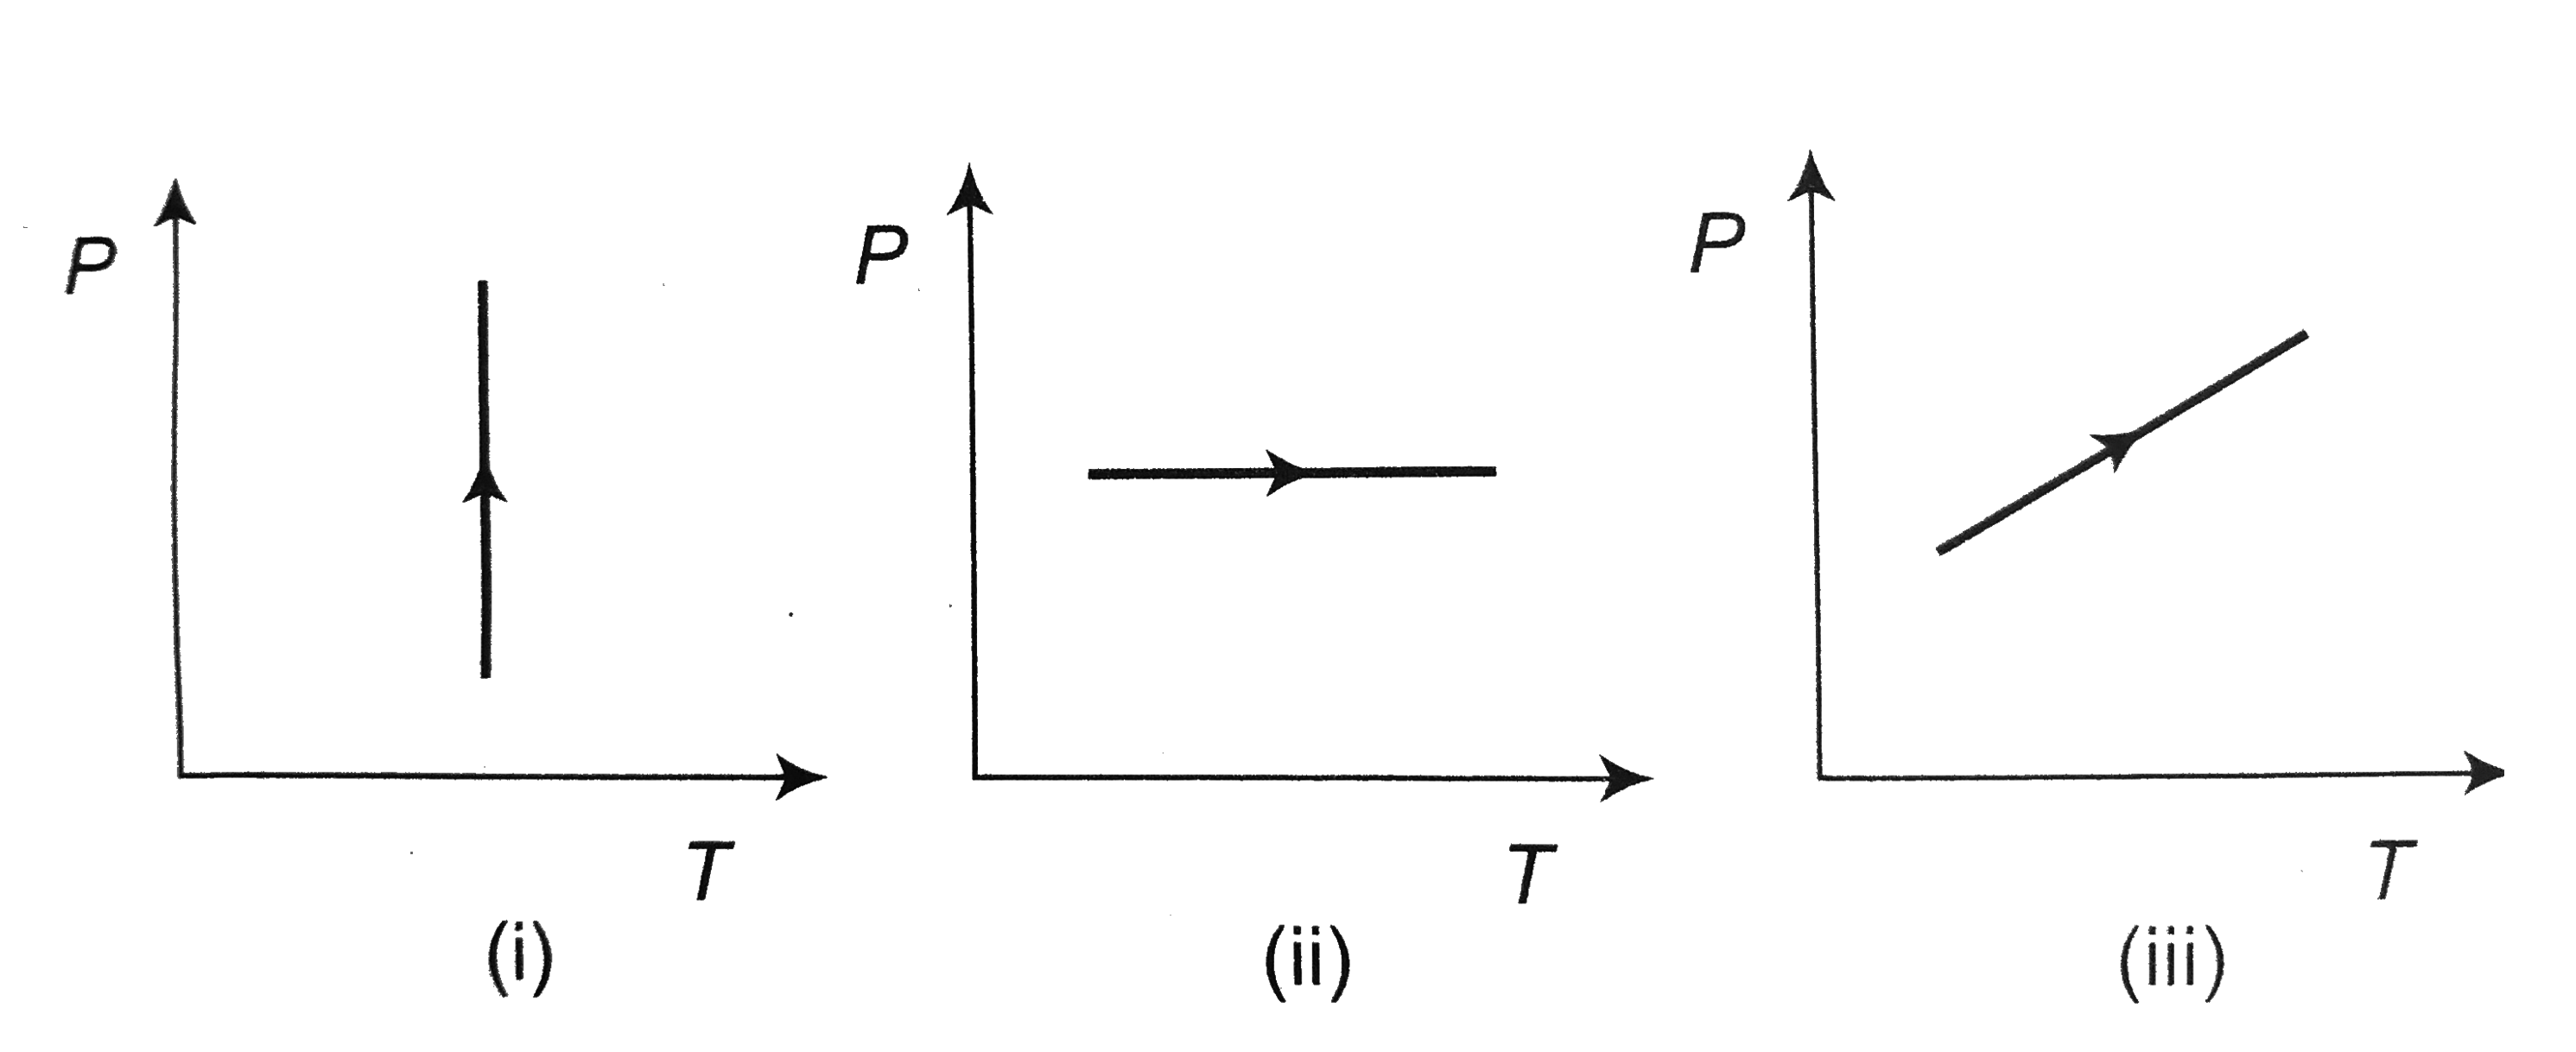 View Solution
PV versus T graph of equal masses of H2, He and CO2 is shown in figure. Choose the correct alternative?
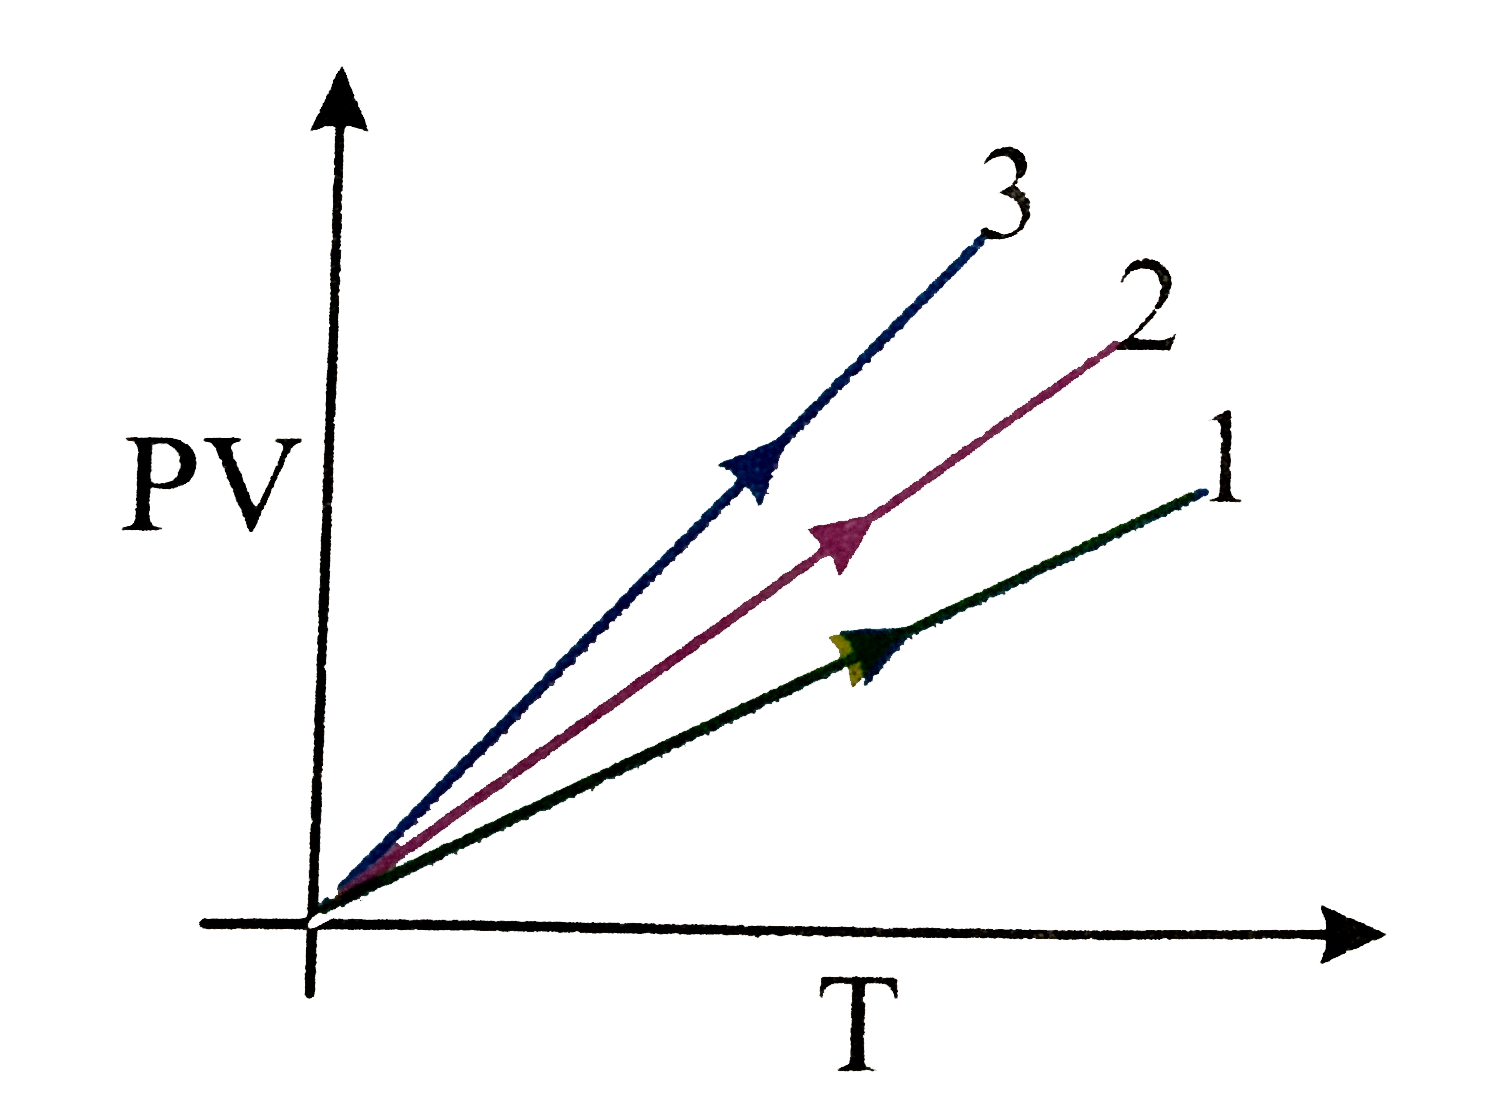 View Solution
Pressure versus temperature graph of an ideal gas as shown in Fig.
Corresponding density (ρ) versus volume (V) graph will be
 View Solution
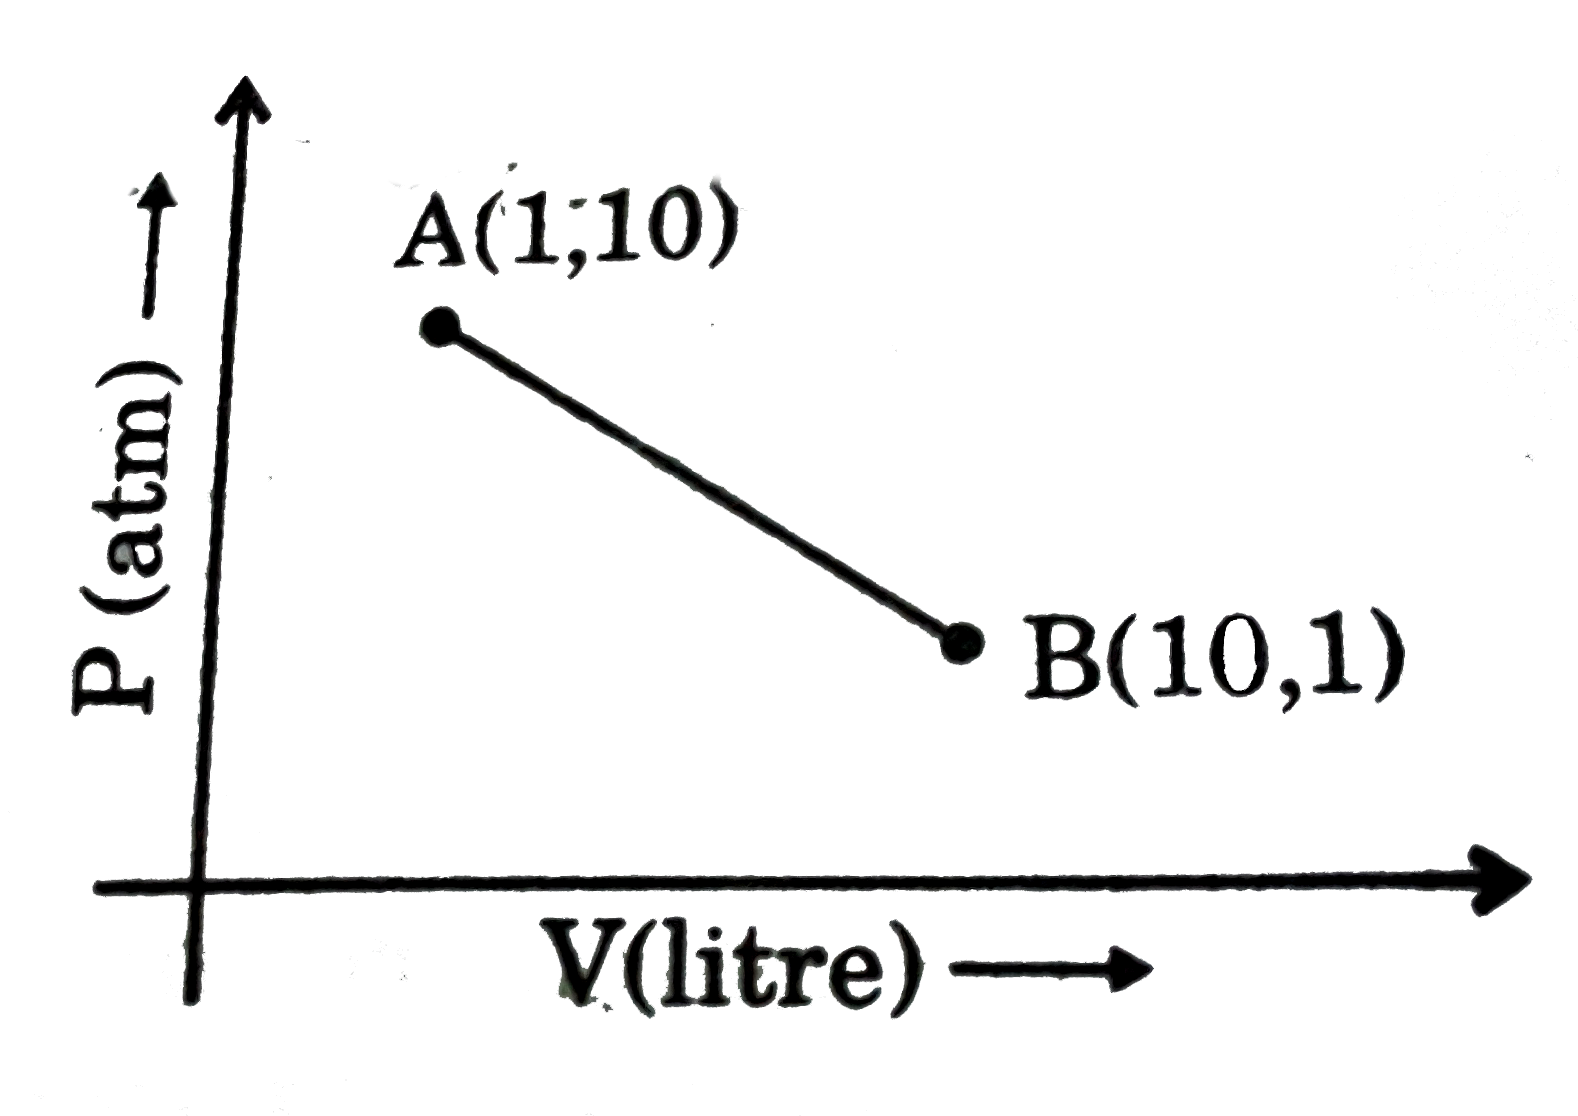
For 1 mole of an ideal gas, a graph of pressure vs volume is plotted as shown. Which of the following option is correct ?
 View Solution
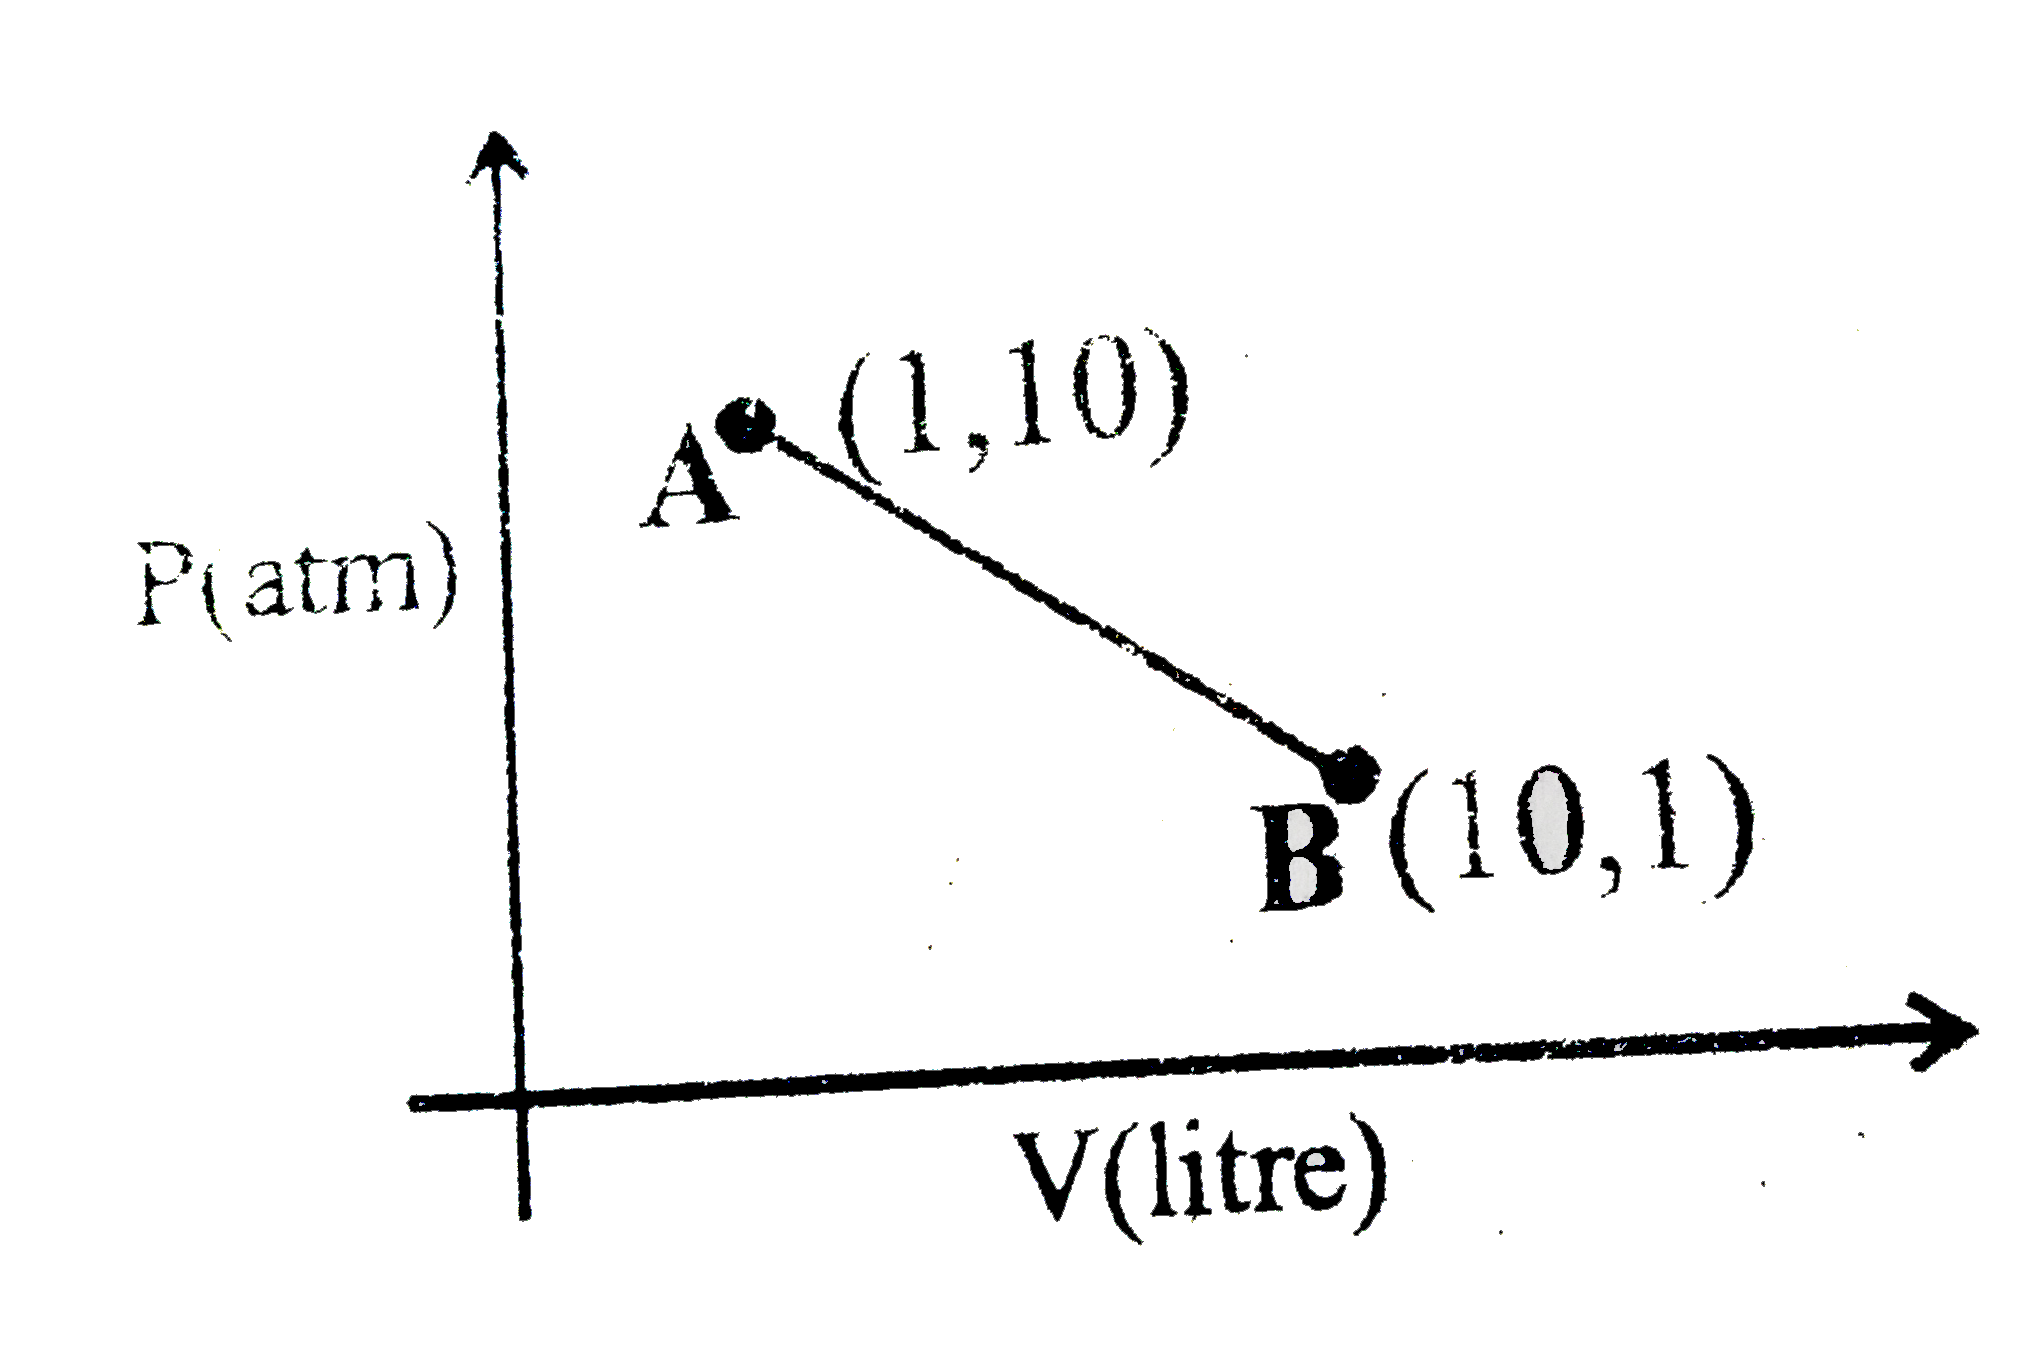
For 1 mole of an ideal gas, a graph of pressure vs volume is plotted as shown. Which of the following options is correct ?
 View Solution


