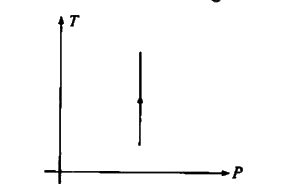
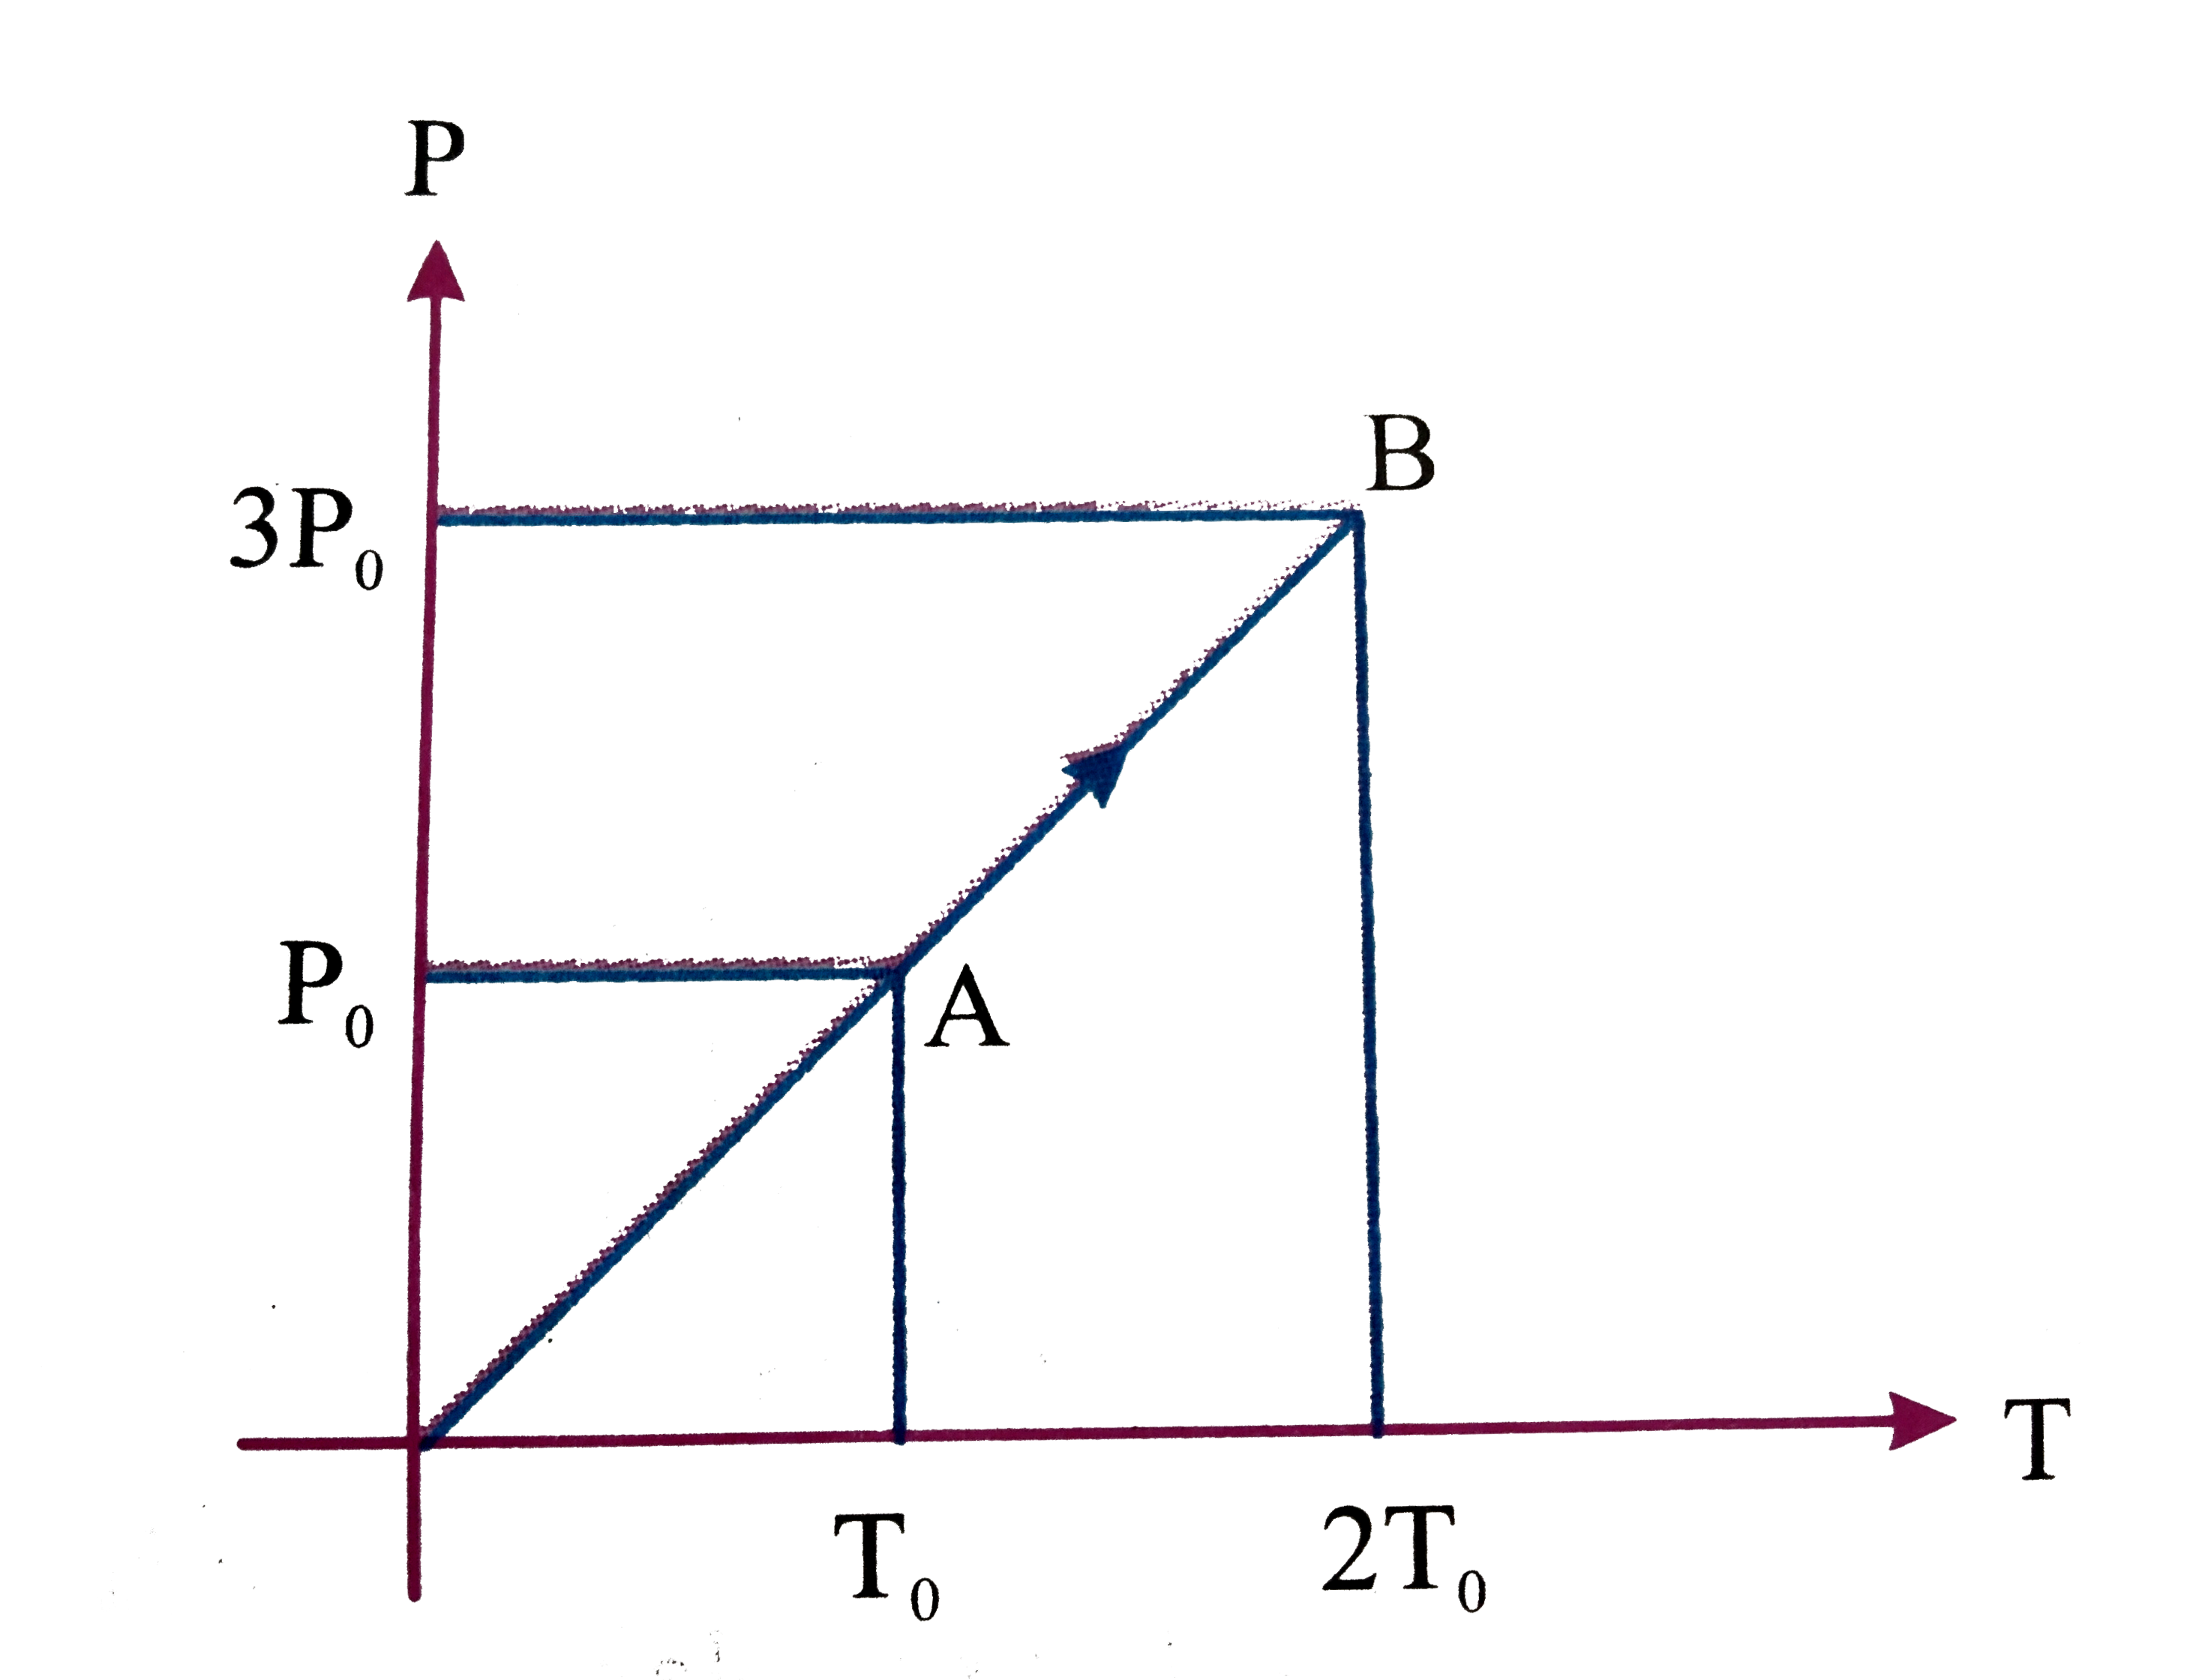
Temperature versus pressure graph of an ideal gas is shown in Fig. During the process
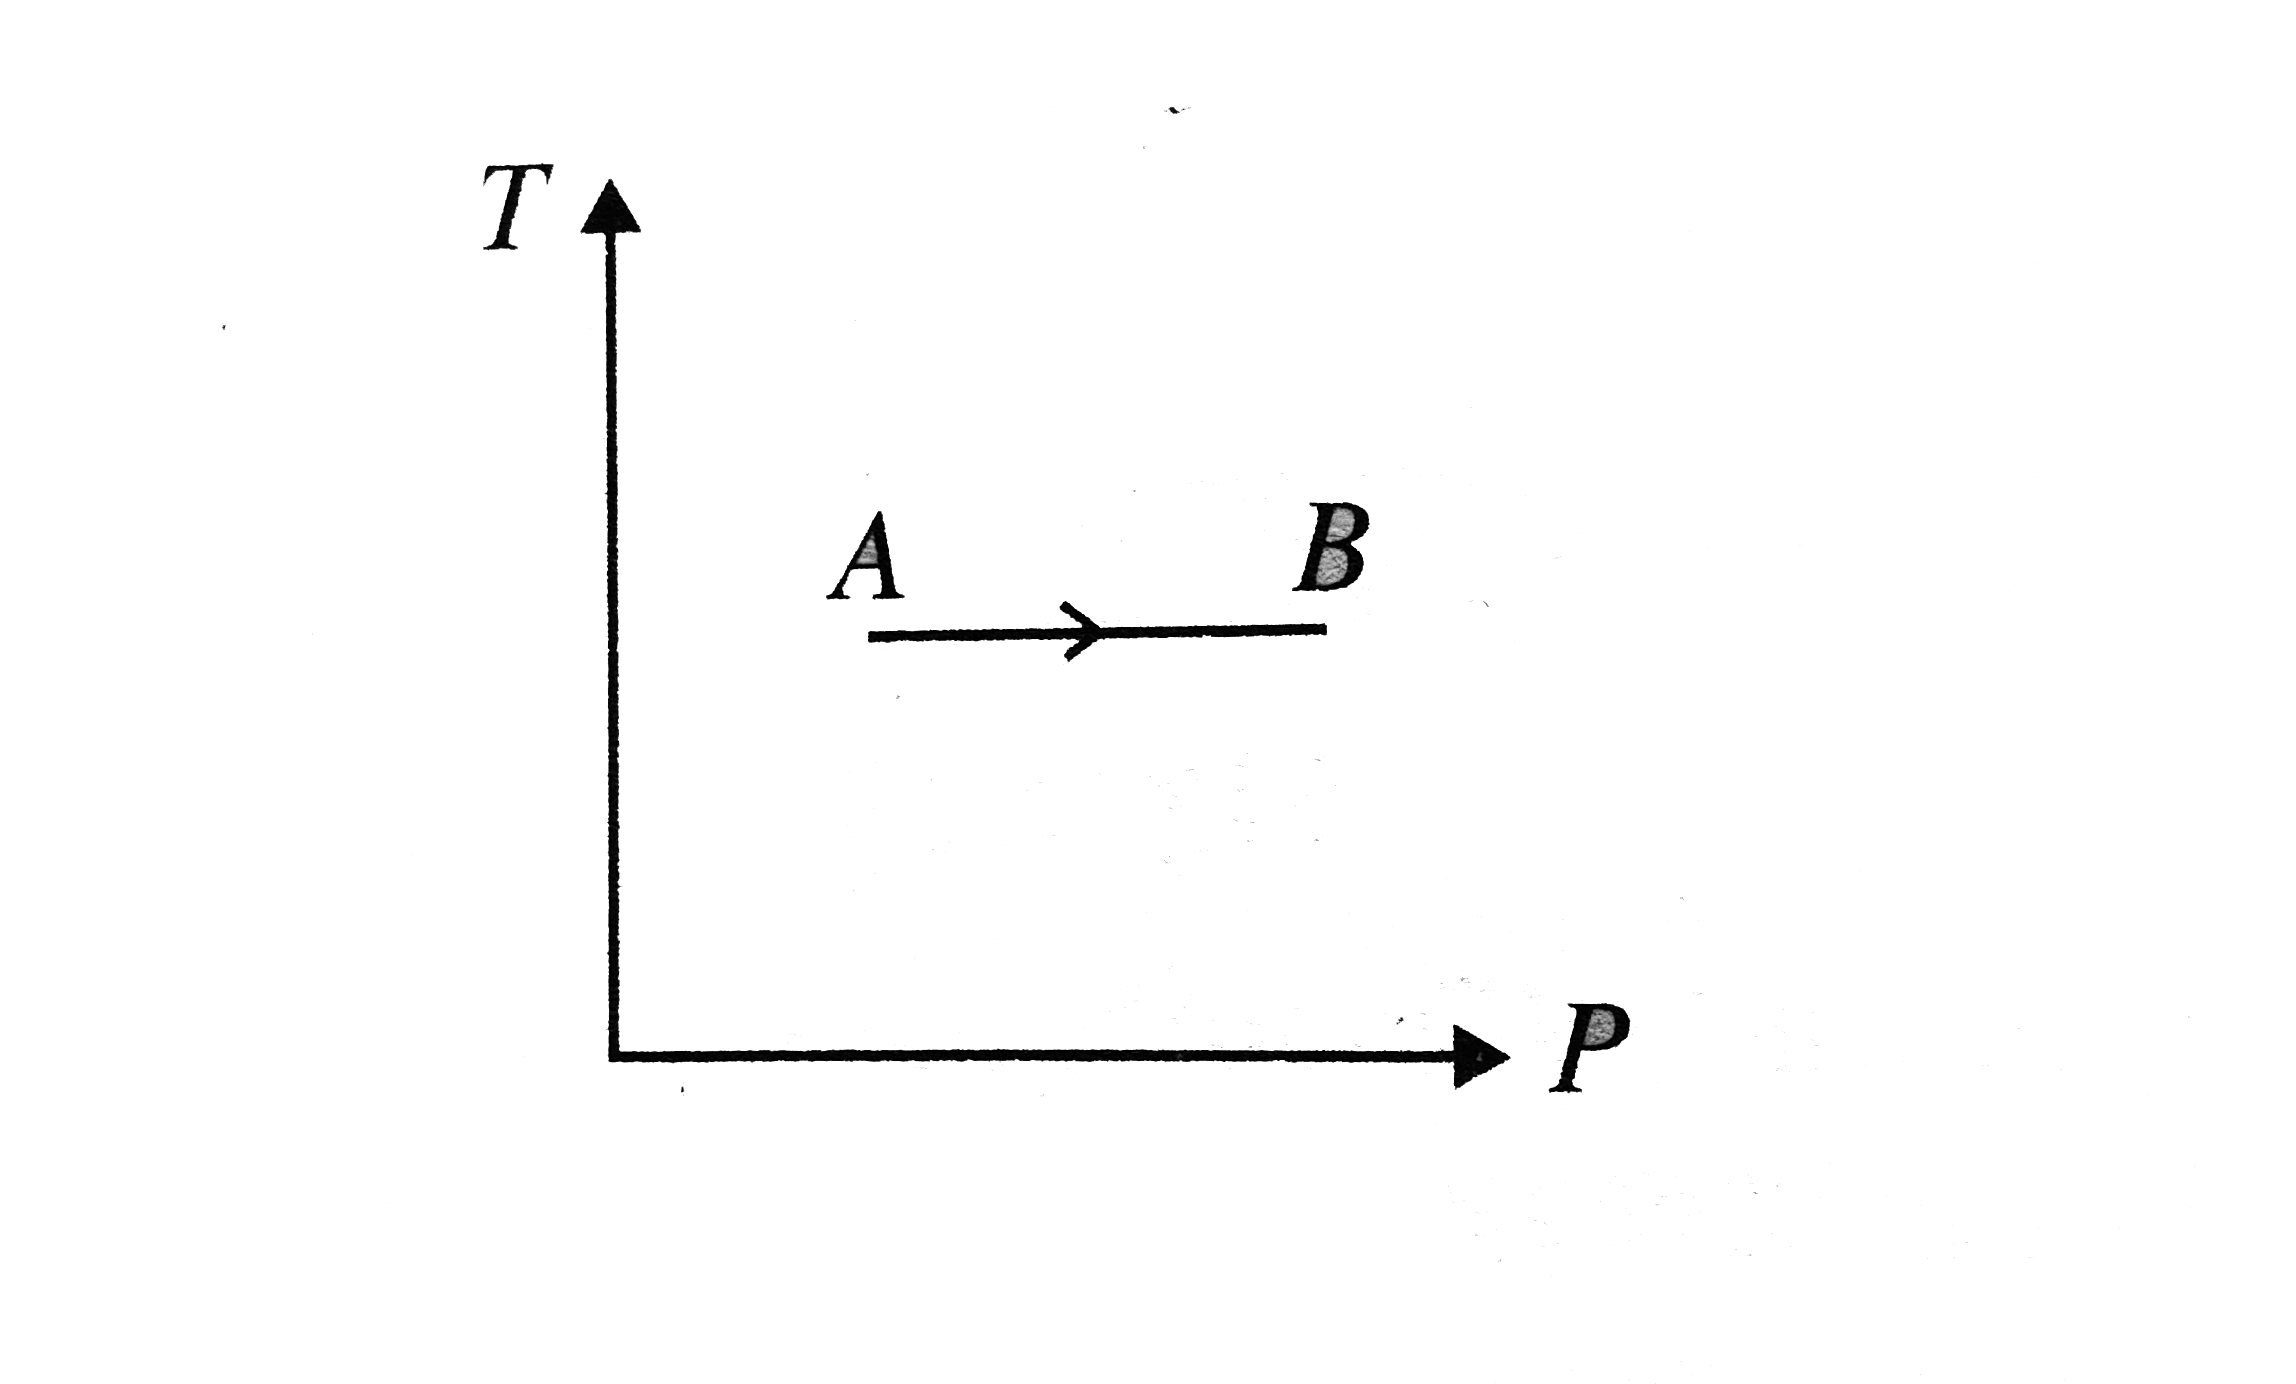
internal energy of the gas remains constant
volume of the gas is increased
work done by the atmosphere on the gas is positive
pressure is inversely proportional to volume
The correct Answer is:A, C, D
constant
constant Boyle's law
or
Pressure of the gas is increasing. Therefore, volume should decrease. Work done by the gas is negative or work done on the gas is constant. Therefore, inter energy will remain constant.
Topper's Solved these Questions
- KINETIC THEORY OF GASES AND FIRST LAW OF THERMODYNAMICSBOOK - CENGAGE PHYSICSCHAPTER - KINETIC THEORY OF GASES AND FIRST LAW OF THERMODYNAMICSEXERCISE - Assertion-Reasoning
6 Videos
- KINETIC THEORY OF GASES AND FIRST LAW OF THERMODYNAMICSBOOK - CENGAGE PHYSICSCHAPTER - KINETIC THEORY OF GASES AND FIRST LAW OF THERMODYNAMICSEXERCISE - Comprehension
56 Videos
- KINETIC THEORY OF GASES AND FIRST LAW OF THERMODYNAMICSBOOK - CENGAGE PHYSICSCHAPTER - KINETIC THEORY OF GASES AND FIRST LAW OF THERMODYNAMICSEXERCISE - Single Correct
140 Videos
- KINETIC THEORY OF GASESBOOK - CENGAGE PHYSICSCHAPTER - KINETIC THEORY OF GASESEXERCISE - Compression
2 Videos
- LINEAR AND ANGULAR SIMPLE HARMONIC MOTIONBOOK - CENGAGE PHYSICSCHAPTER - LINEAR AND ANGULAR SIMPLE HARMONIC MOTIONEXERCISE - Multiple Correct Answer Type
9 Videos
Similar Questions
Knowledge Check
Pressure versus density graph of an ideal gas is shown in figure
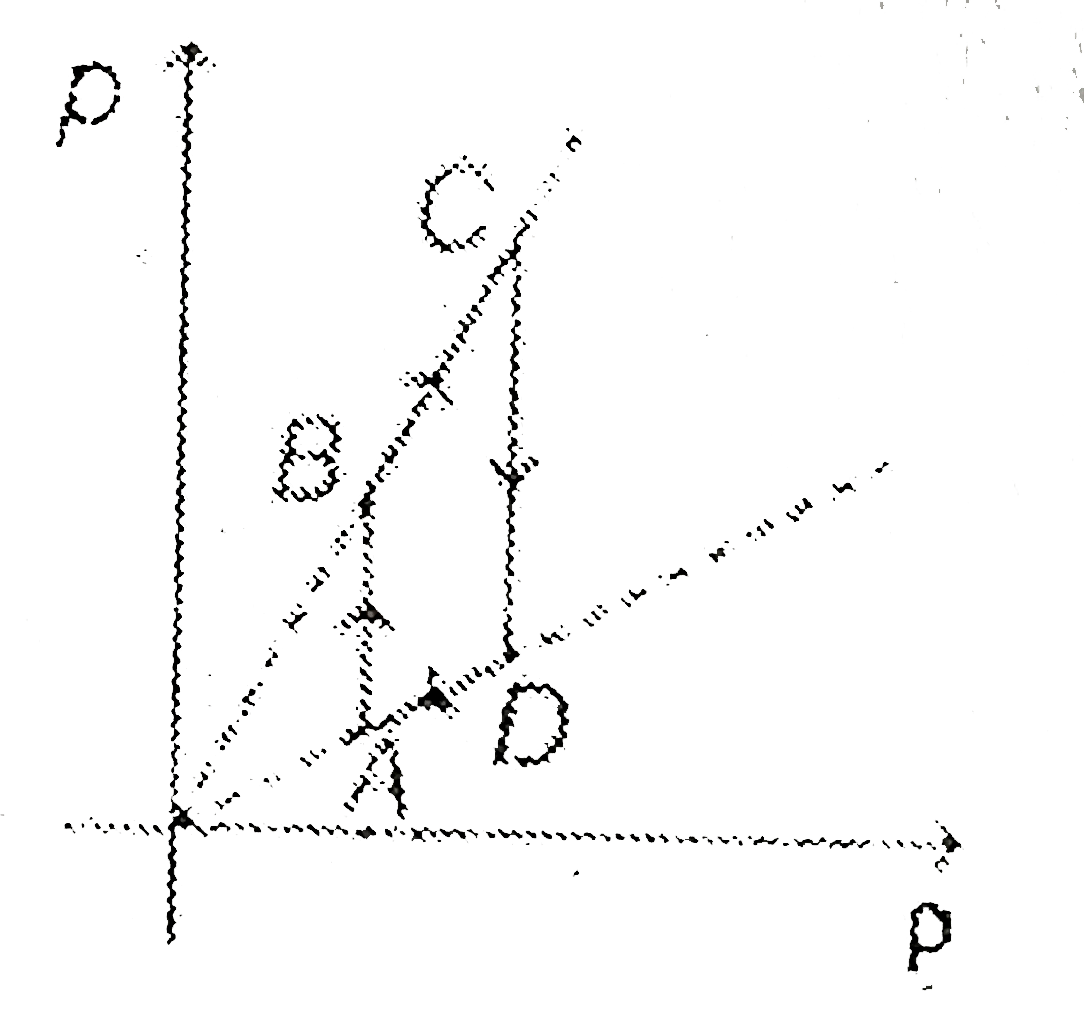 Aduring the process AB work done by the gas is positiveBduring the process AB work done by the gas is negativeCduring the process BC internal energy of the gas is increasingDNone of the above
At same temperature and pressure of an ideal gas
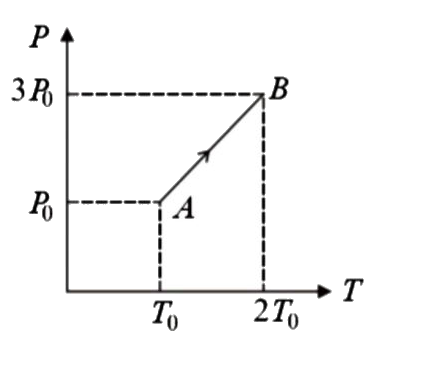
Athe molar specific heat at constant pressure is the same for the all gasesBthe molar specific heat at constant volume is the same for all gases.Cthe ratio of the molar specific heats at constant volume and at constant pressure is the same for all gasesDthe difference between the molar specific heats at constant pressure and at constant volume is the same for all gasesPressure versus temperature graph of an ideal gas is shown in figure. Density of the gas at point A is P0. Density at B will be
 A34ρ0B32ρ0C43ρ0D2ρ0
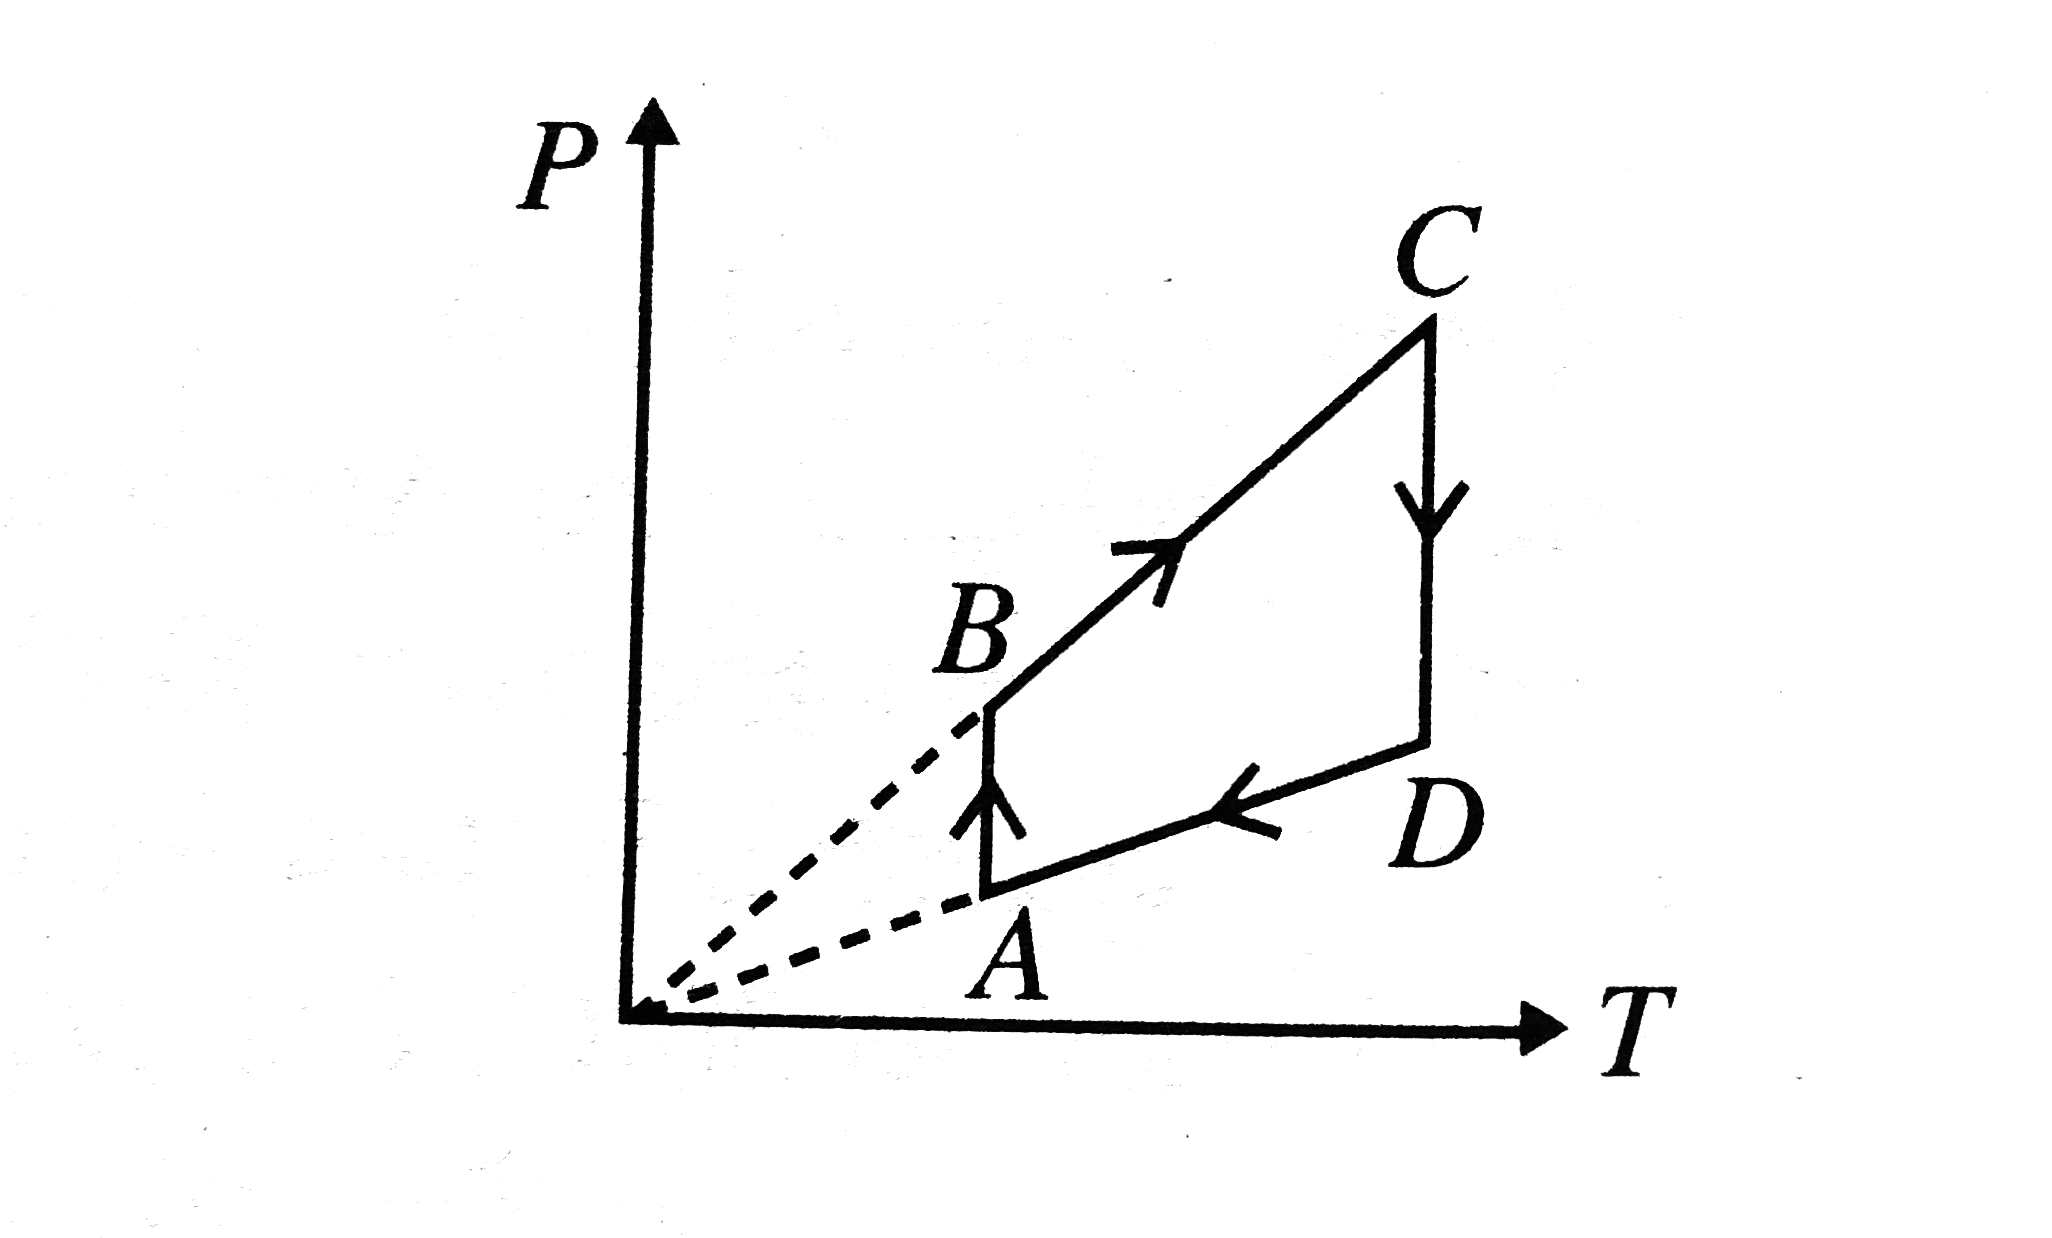
Pressure versus temperature graph of an ideal gas as shown in Fig.
Corresponding density (ρ) versus volume (V) graph will be
View Solutiongraph of an ideal gas is as shown in figure.
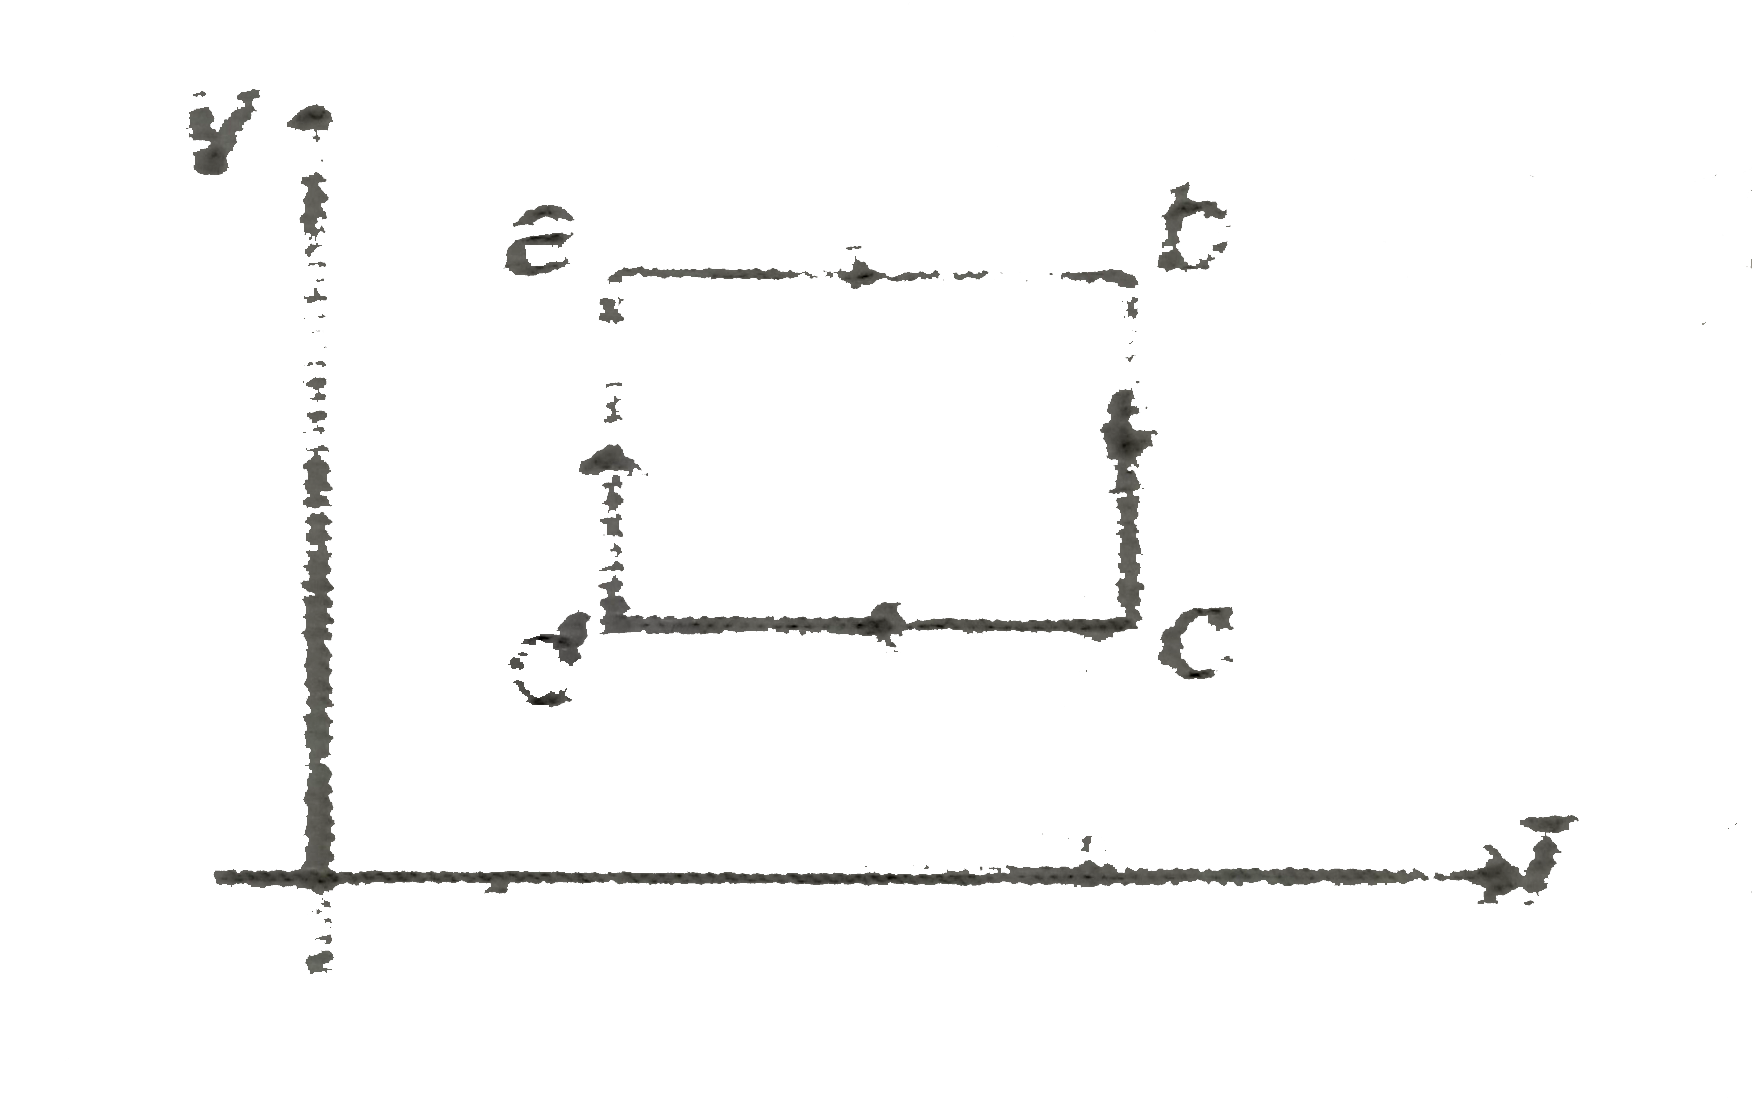
Heat is supplied to the gas in process (s).
View SolutionThe process on an ideal gas, shown in figure,is <br><imga≤ocr_imageload∈g=lazysrc=https://d10lpgp6xz60nq.cloudfront.net/physics_imagesHCV_VOL2_C24_E01_027_Q01.pngwh=80%mx-autosty≤=background:white;>
View SolutionV−T diagram for a process of given mass of ideal gas is as shown in fig. During the process pressure of the gas
_E01_072_Q01.png)
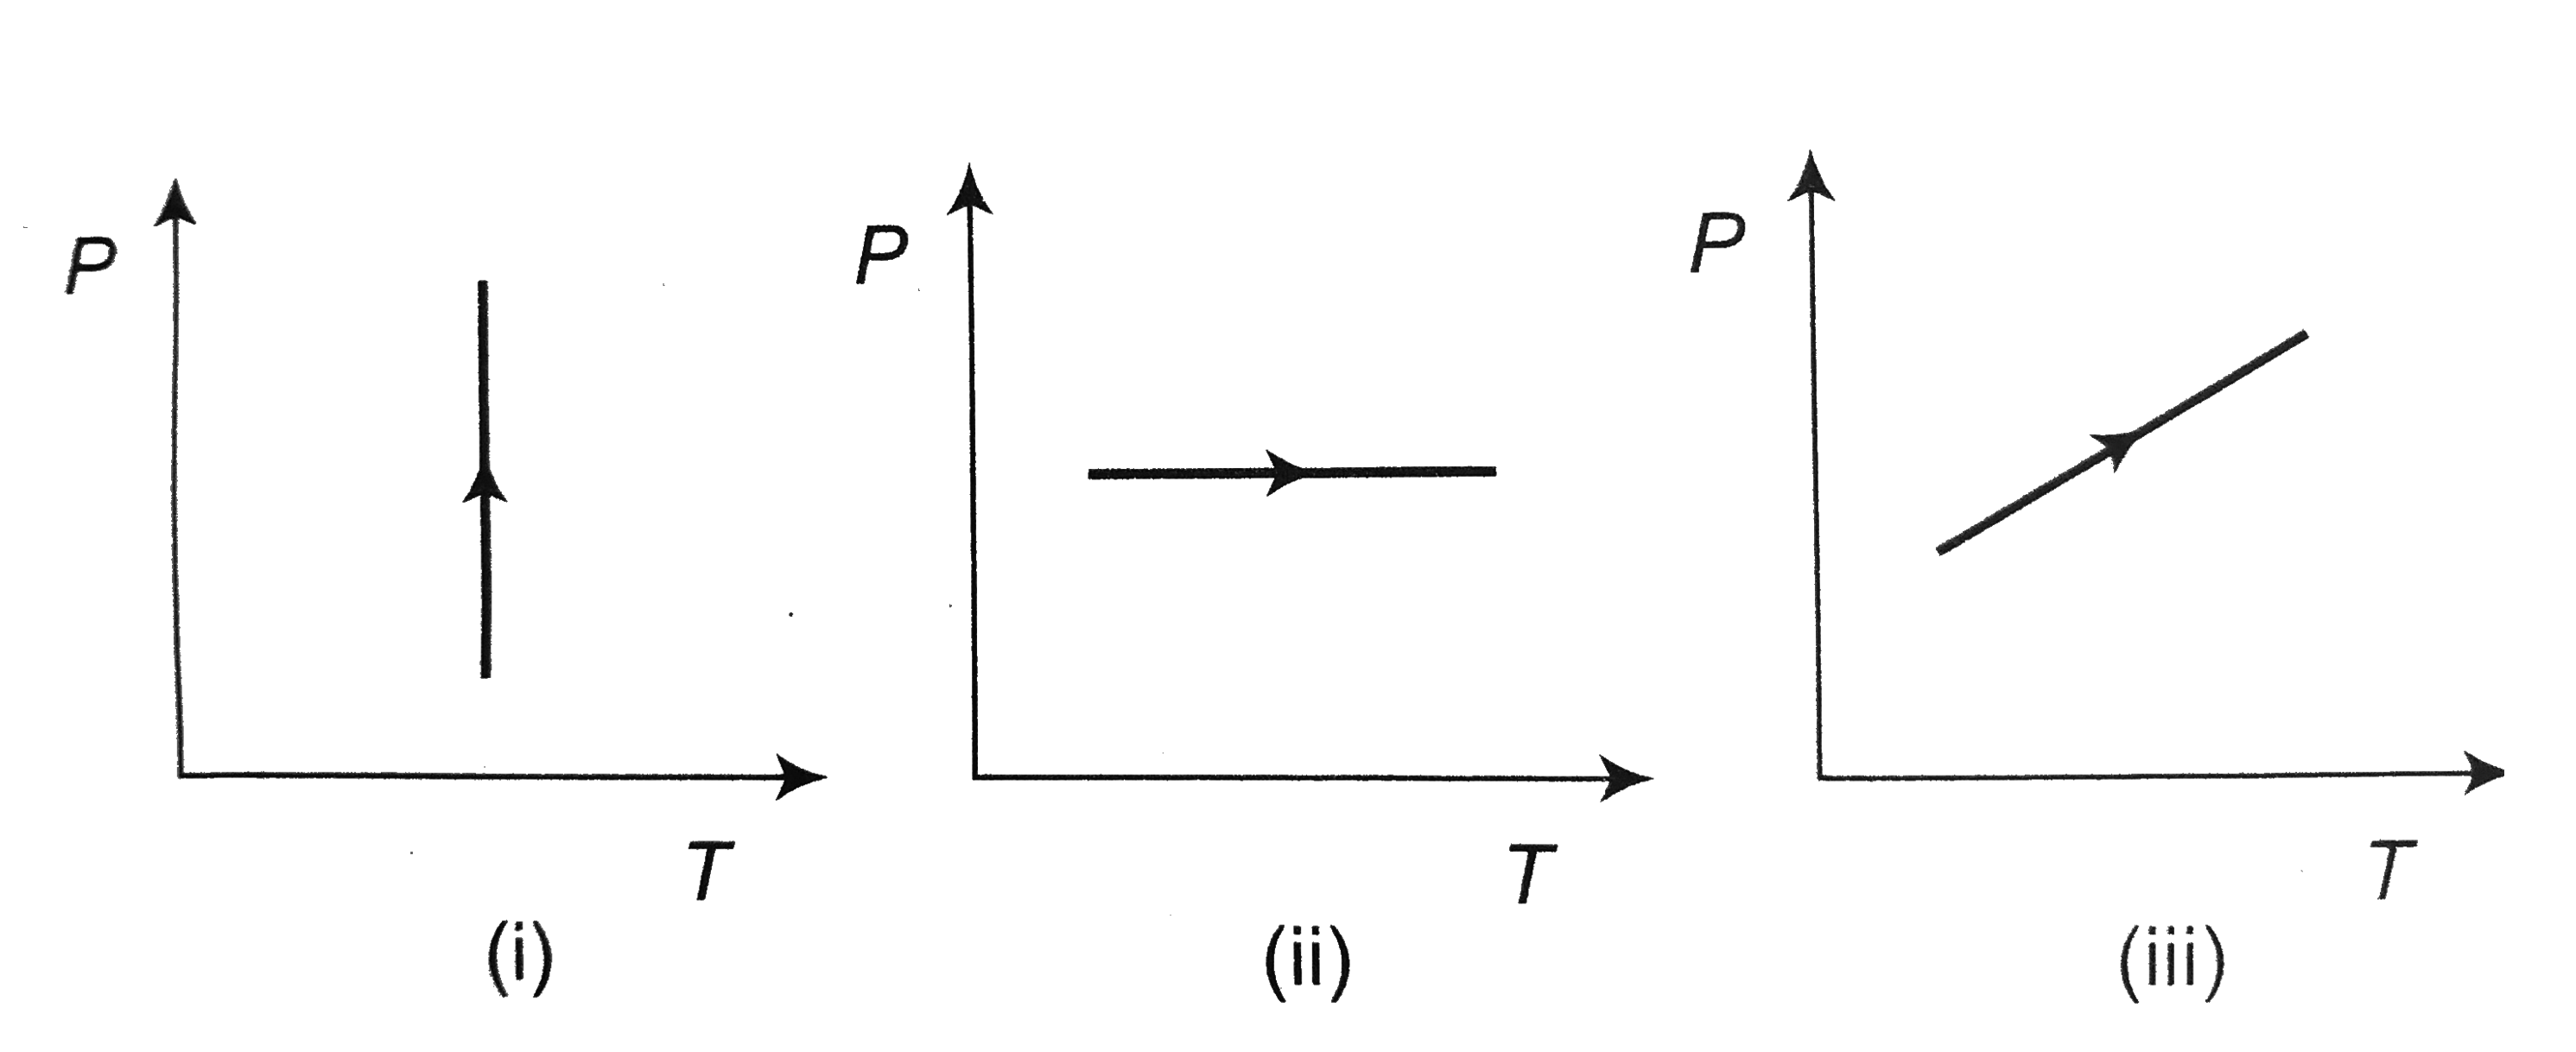
View SolutionPressure versus temperature graphs of an ideal gas are as shown in figure. Choose the wrong statement
View Solution

